3D bar, scatter and surface charts for Unity, included with Chart Guru.
3D bars, point clouds and surface plots you can orbit, select and animate in Unity, plus 2D charts that lift into 3D. Included with Chart Guru.
Chart3D, 3D point, rule and rectangle marks, surface plots, poses and projections follow Swift Charts 3D, and Chart3D code pastes in like 2D code.
Compatible charts switch between 2D and 3D with an animated transition that keeps data and styling, and 2D and 3D views can select together.
Orbit, hover and select 3D charts in scenes, on Canvas, in UI Toolkit and in textures, and stream new values into them without rebuilding.
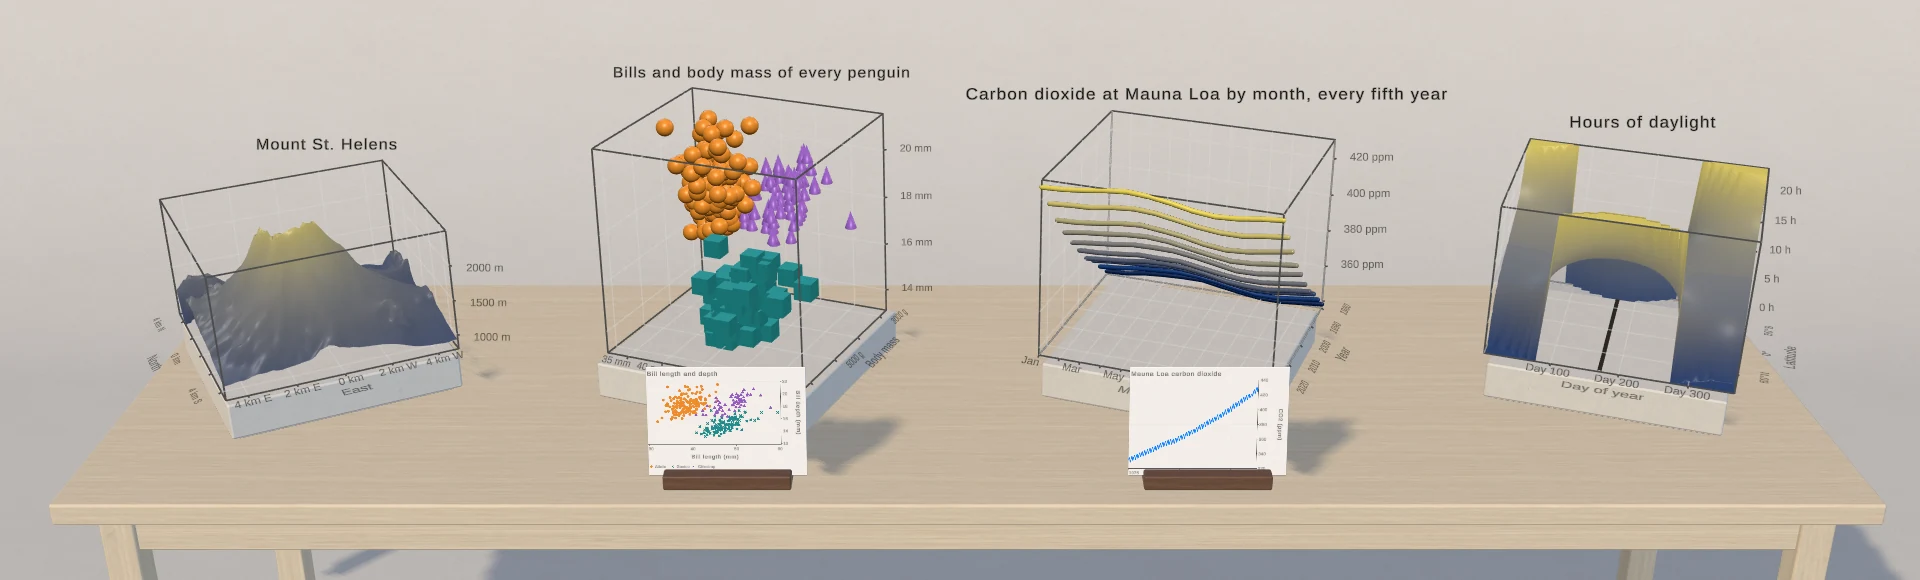
From 2D to 3D in one move. Four sample charts lift from their flat 2D drawings into 3D and back, rendered in Unity by Chart Guru.
Add depth when the data has a third dimension.
Chart Guru 3D uses the same definitions, data sources, themes, Designer and API as the 2D charts. Add a Z value, choose a 3D chart type or lift an existing chart, and the conventions you already rely on carry over.
Surface plots and terrain
Plot functions, elevation grids and yield curves as surfaces colored by height or normal, with viridis, magma, turbo and other scientific colormaps.
Points, bars and planes
Point clouds sized and colored by data, extruded bars, ribbons, stacked areas, rule stems and depth planes.
Round charts with depth
Pie, donut and radar charts in 3D, framed around what they draw rather than an empty plot box.
Poses, orbit and projection
Pose presets, perspective or orthographic cameras, drag to orbit, automatic rotation and zoom.
Selection and tooltips
Hover and click 3D marks, pin tooltips and link the selection to 2D charts of the same data.
Live updates in place
Value changes update surfaces, points and bars in place without compiling the chart again, and allocate nothing once warm.
Scenes, UI and textures
Place charts as scene objects, show them on Canvas or in UI Toolkit, or render them into textures and PNG captures.
Every render pipeline
Lit materials with roughness and metalness presets in Built-in, URP and HDRP, with Single Pass Instanced XR support.
Pick the job. See how it works.
Each guide shows one everyday problem with a real library, the steps inside Unity, and what you get back.

Lift a 2D chart into 3D in Unity
Compatible charts switch from 2D to 3D with an animated lift: the flat chart turns from the front view into its 3D pose while its marks gain depth. The Chart Designer, the inspectors and the runtime API share the same lift.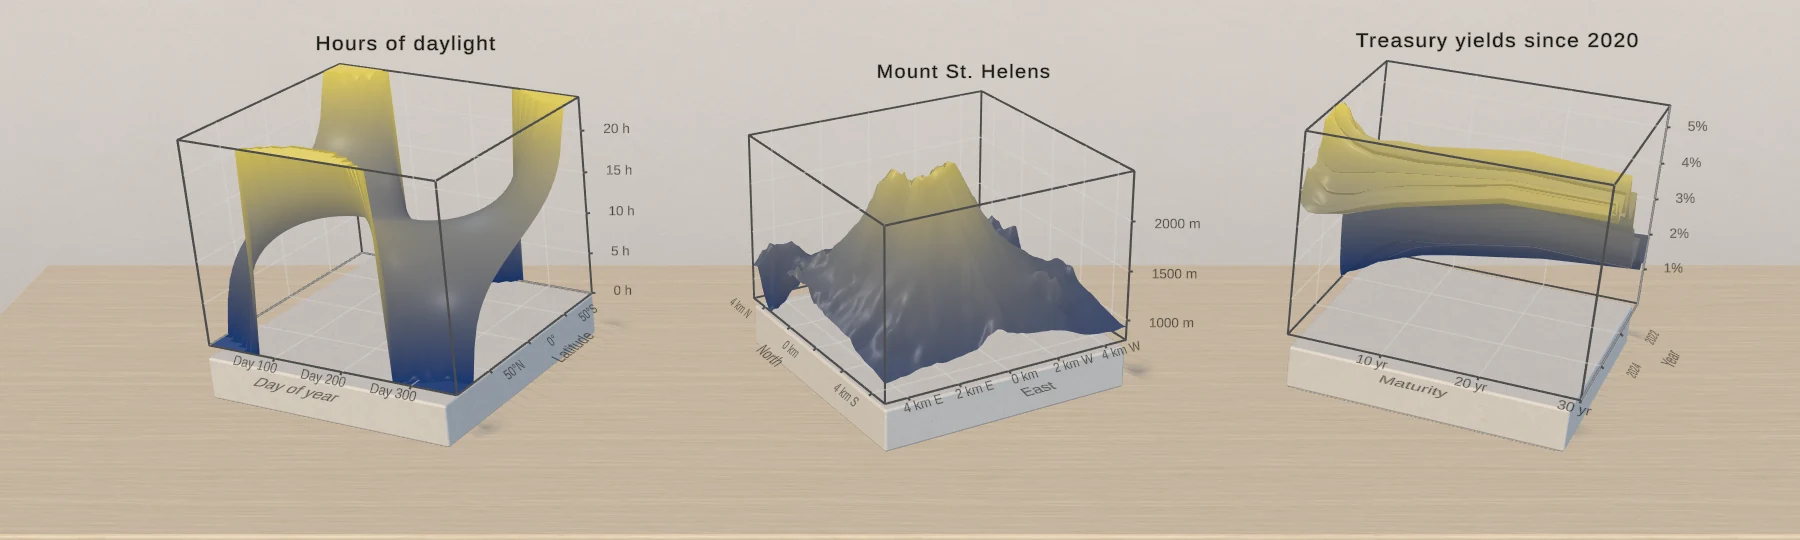
Surface plots and terrain data in Unity
Chart Guru 3D draws a surface from a function or from a grid of measured rows, colors it by height or slope with viridis, magma, cividis or turbo, and leaves holes where values are missing instead of dropping the surface.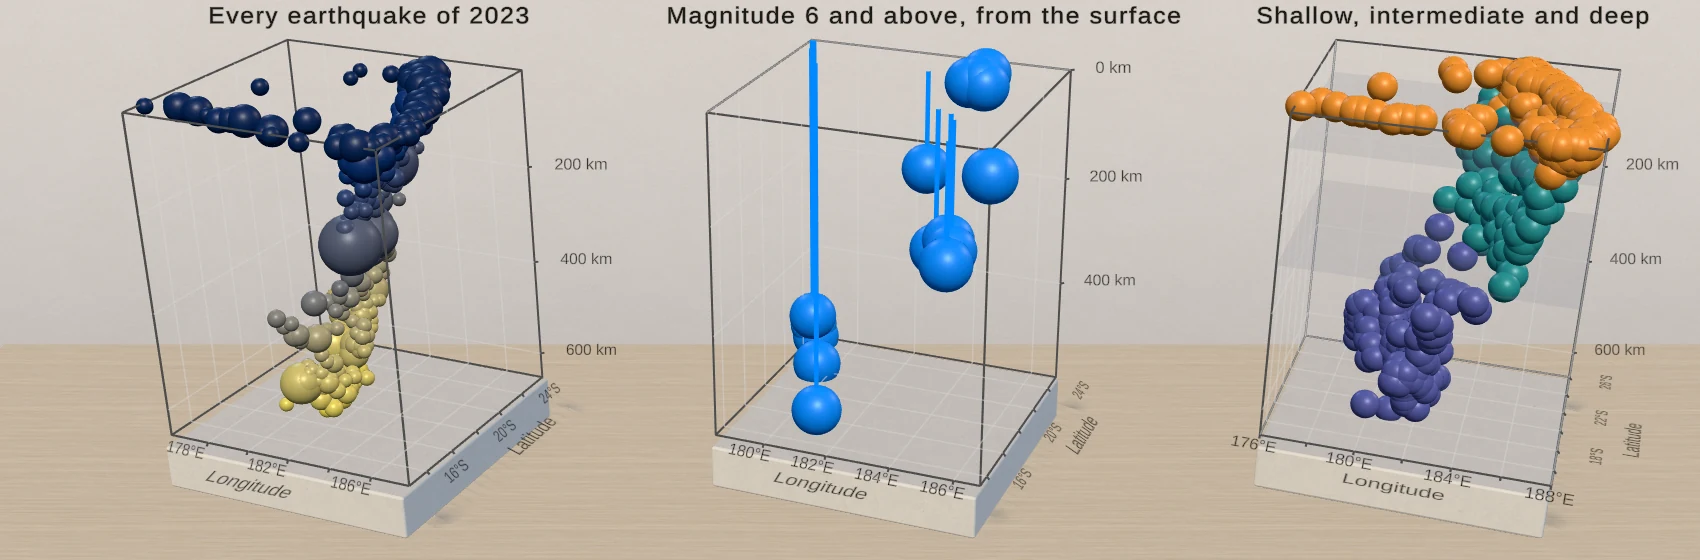
3D scatter plots and point clouds in Unity
PointMark3D places a symbol at three values. Size and color the points from data columns, add rules and planes for context, and let users orbit, hover and select, with a linked 2D chart where a flat view reads better.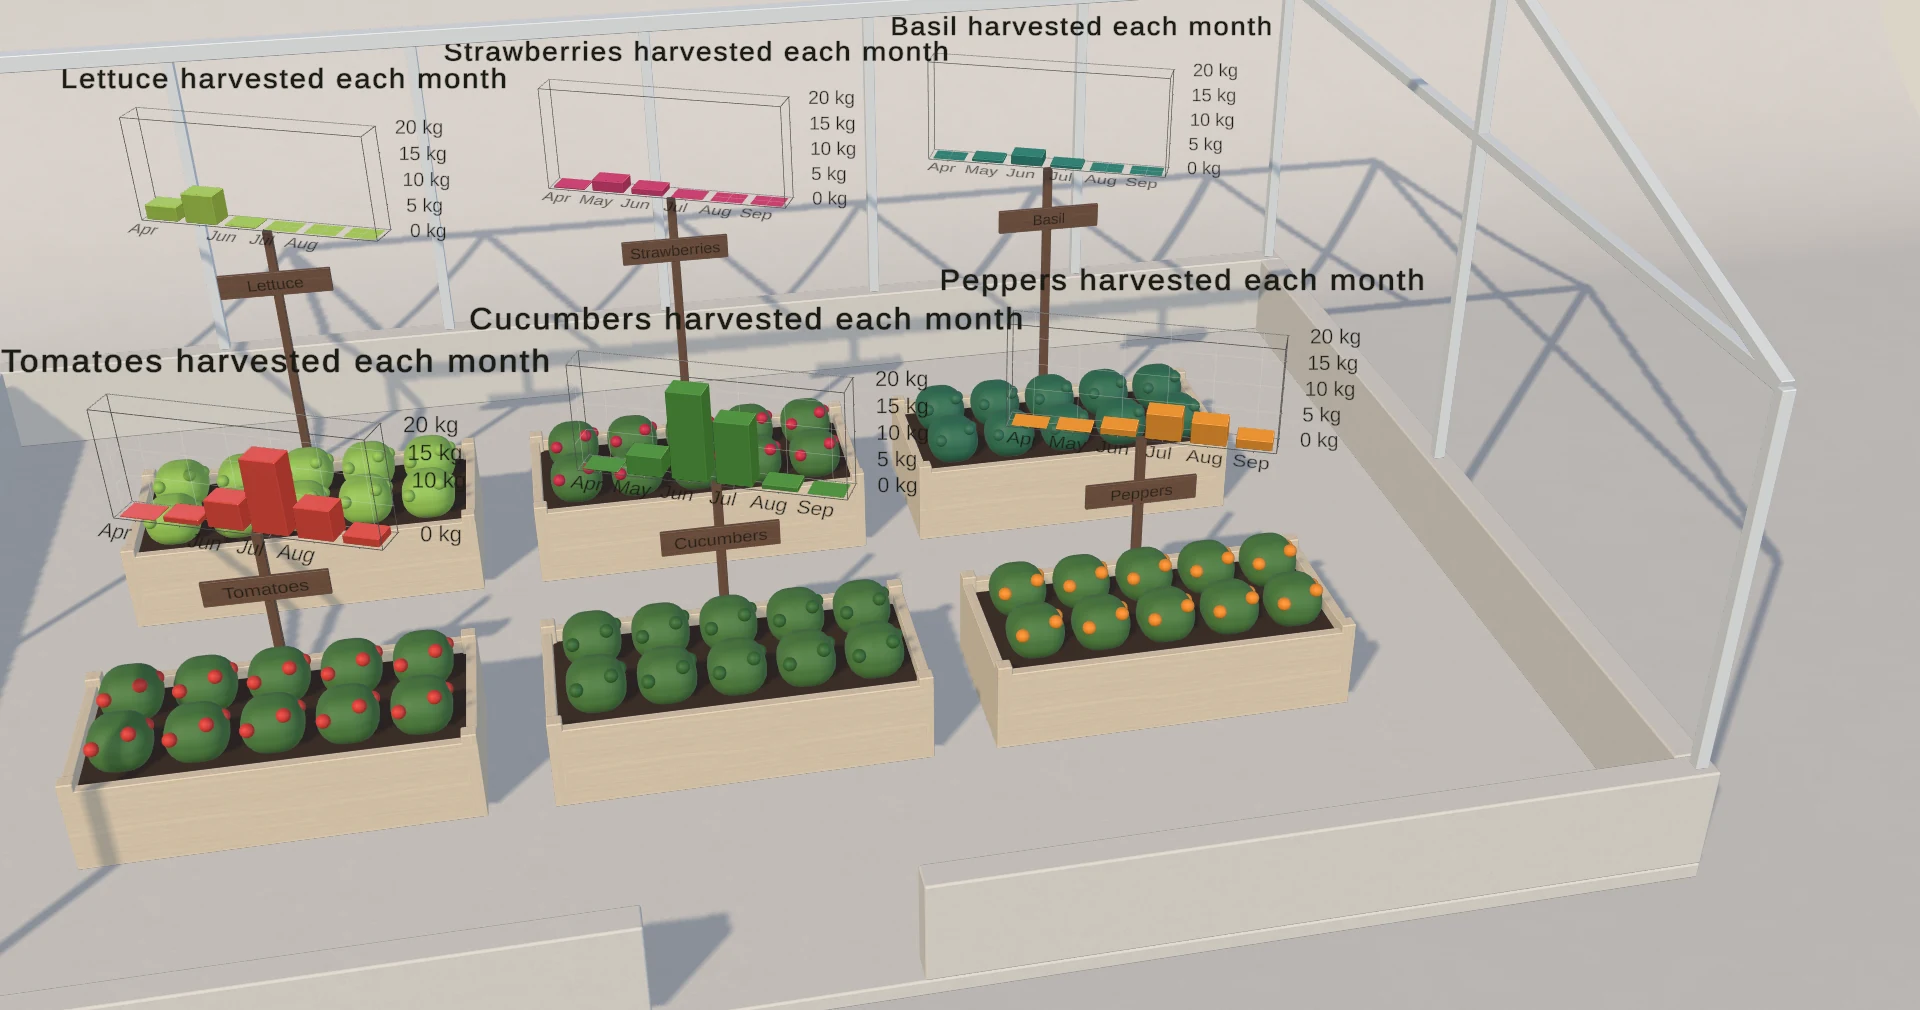
Charts on objects in your Unity game world
A Chart 3D is a GameObject in your level: it follows its transform, every camera sees its own side, labels face the camera and pointer input needs no colliders. The greenhouse example puts a harvest chart beside every raised bed.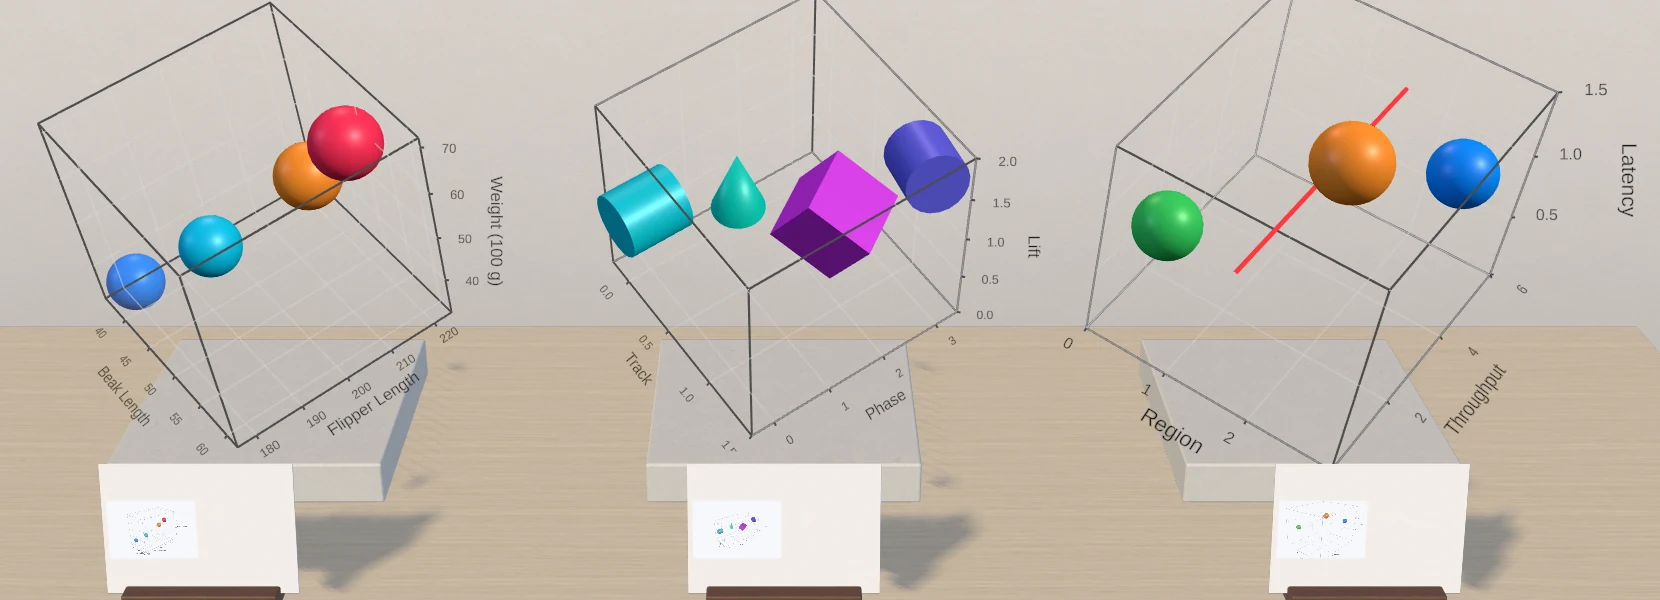
Import Swift Charts 3D code into Unity
Chart3D arrived with iOS, macOS and visionOS 26. Chart Guru 3D imports its marks, poses, projections and scales into a saved Unity chart, names every construct it skips, and exports back to Swift with its own extensions identified.Real workflows. Real Unity output.
Articles and field notes
Frequently asked questions
Is Chart Guru 3D a separate purchase?
No. The 3D module is bundled with Chart Guru and installs with it, so every Chart Guru license includes it.
Can I import Swift Charts 3D code?
Yes. Chart3D code with PointMark, RuleMark, RectangleMark and SurfacePlot imports into a live 3D chart and C#. Chart Guru's own 3D types, such as bars, pies and radars, are marked as extensions when you export back to Swift.
Which 3D chart types are included?
Point, rule, rectangle and surface charts, which mirror the Swift Charts 3D marks, plus 3D bar, line, area, stacked area, pie, donut, radar and scatter charts.
Where can 3D charts appear?
As scene objects in world space, on Canvas through a Chart 3D Image, in UI Toolkit through a 3D chart element, and in render textures or PNG captures.
Turn a flat chart into a 3D view without starting over.
Chart Guru 3D installs with Chart Guru. Start from a 3D template, paste Swift Charts 3D code or lift the 2D chart you already have.