Surface plots and terrain data in Unity
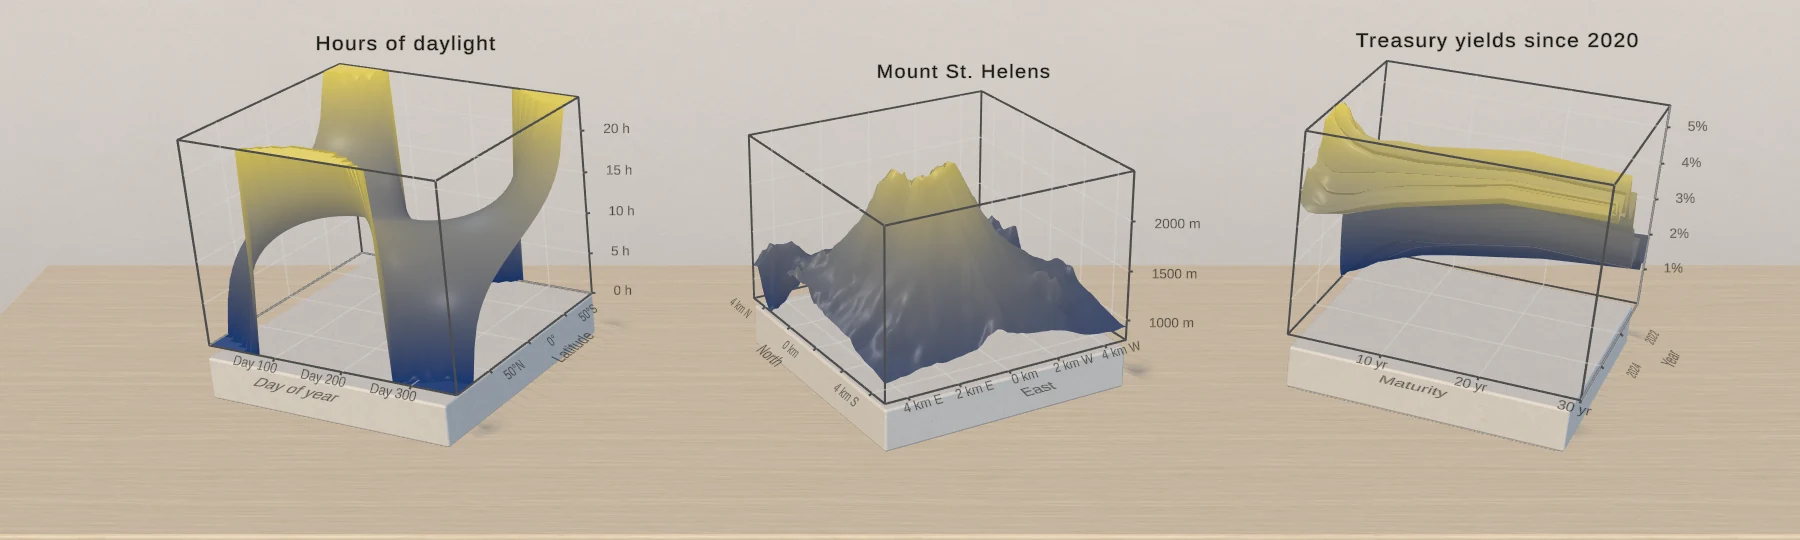
Plot surfaces in Unity with Chart Guru 3D: functions of x and z or measured grids such as terrain, colored by height or slope with scientific colormaps, with holes for gaps.
Frequently asked questions
Can a surface come from measured data instead of a function?
Yes. A Surface 3D chart with one row per grid point uses the distinct X and Z values as its grid and Y as the height. Missing rows and empty values become holes as long as the rows cover at least half of the grid. In code, SurfaceGrid3DMark takes the samples row by row along X.
What is the difference between YRange and ClampY?
YRange sets the height range the colors span and leaves the geometry alone, like the yRange of the heightBased style in Swift Charts. ClampY clamps the sampled geometry. Fix the color range with YRange, the layer's Height Range or an explicit Y domain when colors must not drift while data changes.
Do function surfaces work in IL2CPP builds?
Yes. A function stored as text, such as sin(x) * cos(z) or an imported Swift closure, runs in a compiled evaluator in double precision without allocations, reflection or generated code, so it works in IL2CPP players without the editor. C# delegates work too, for charts built in code.
3D bar, scatter and surface charts for Unity, included with Chart Guru.
Keep reading
 Use case
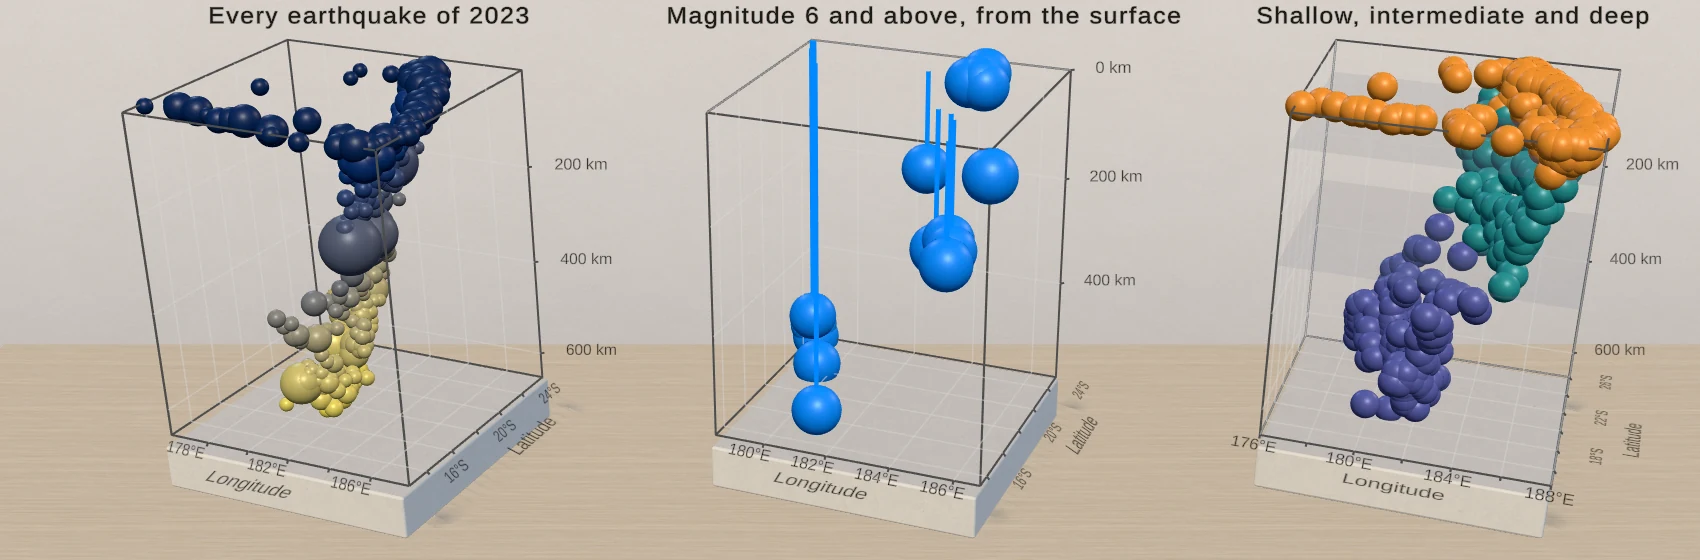
3D scatter plots and point clouds in Unity
PointMark3D places a symbol at three values. Size and color the points from data columns, add rules and planes for context, and let users orbit, hover and select, with a linked 2D chart where a flat view reads better.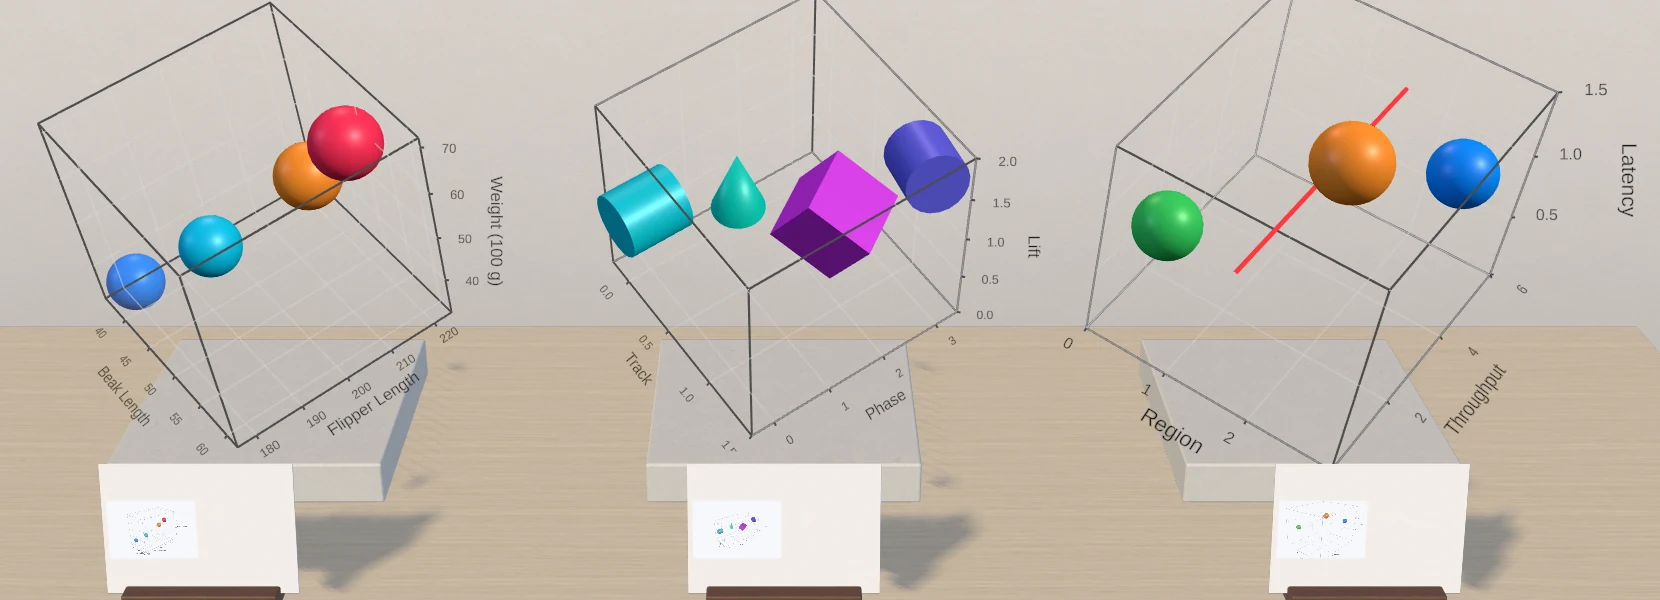 Use case