Simulate sensor telemetry for a Unity digital twin
Prototype digital twin and IoT dashboards before devices are connected: jittery readings, cyclic loads, rare faults and bursty batches generated inside Unity.
Digital twin projects rarely start with working telemetry. The PLC is not wired yet, the broker credentials are still waiting in a ticket, and half of the sensors are in shipping. The 3D scene, the status panels and the alarm logic can still be built, as long as something produces believable readings in the meantime. Mock Magic generates them inside Unity: live values per sensor on the kind of schedule real devices keep, and histories in typical shapes for the charts.
Map sensor behavior to patterns and rhythms
| What the sensor does | Mock Magic setting | What it generates |
|---|---|---|
| Jitters around a stable value: pressure, temperature, voltage | Gaussian Noise pattern | Normally distributed values around the midpoint of the range; Noise sets the spread |
| Follows a daily or hourly cycle: HVAC load, occupancy | Sine pattern | One smooth wave per pattern cycle, flowing into the next |
| Wanders: tank level, battery charge | Random Walk pattern | Each point moves up to 15 percent of the range from the previous one, for as long as the stream runs |
| Steps through stages: a pump ramping up its speed | Stepped pattern | Equal plateaus that climb from the minimum through each cycle |
| Reports rare events: faults, alarms, door openings | Sparse pattern | About seven in ten values are zero, the rest random spikes |
| Reads at irregular moments, like event-driven sensors | Drip rhythm | Single readings at random gaps that average the interval |
| Uploads in batches through a gateway | Burst rhythm | Several emissions in quick succession, then a pause |
| Reports on a jittery schedule | Random rhythm | A random wait between a minimum and a maximum interval |
Streams continue their pattern from one reading to the next. Pattern cycle, CycleLength in code with 50 points by default, sets how long one cycle lasts in points rather than seconds: one reading per second and a cycle of 60 give a Sine sensor one wave per minute. Sine and Cosine flow from one cycle into the next. Seasonal, Stepped and the climbing patterns jump back to their start when a cycle ends, which suits a batch process that restarts but not a smooth daily curve. Random Walk has no cycle at all.
Stepped only ever climbs within a cycle, so it models a ramp rather than a machine that hops between idle, running and fault. For random states, draw them with Mock.Enum<T>() or with weights through Mock.PickWeighted. The same helper makes faults rarer than Sparse’s three in ten: Mock.PickWeighted((49f, 0f), (1f, point.Value)) keeps a reading in one case out of fifty and reports zero otherwise.
History and live values from one curve
A trend panel usually shows the last 24 hours next to the live value, and the two should meet. A MockSeriesCursor continues a pattern across calls, so one cursor can draw the history and then every new reading:
using System;using MockMagic;
public class ChillerFeed{    const int PointsPerDay = 288; // five-minute readings    readonly MockSeriesCursor cursor = new MockSeriesCursor(SeriesPattern.Sine, PointsPerDay);
    // Call once when the panel opens: one full wave, labeled with the time of day.    public MockDataPoint[] LastDay()    {        float[] values = cursor.Next(PointsPerDay, 40f, 95f, 0.03f);        MockDataPoint[] points = new MockDataPoint[values.Length];        for (int i = 0; i < values.Length; i++)        {            string time = TimeSpan.FromMinutes(i * 5).ToString(@"hh\:mm");            points[i] = new MockDataPoint(time, values[i], seriesName: "Chiller 2 load");        }        return points;    }
    // Call on your own timer: each reading continues the curve where the history ended.    public float NextReading() => cursor.Next(1, 40f, 95f, 0.03f)[0];}
For a random walk that should continue real data you loaded, ContinueFrom(lastValue) sets its starting point. A history without a live tail is one call: MockSeries.Generate with the Custom label preset, or MockSeries.GenerateMultiSeries with seriesNames such as Pump 1, Pump 2 and Pump 3, which share one pattern and range.
One stream per sensor
MockStreaming is a single shared stream on a hidden object of its own, and the Generator’s Live Stream workspace drives that same one. For a twin with many sensors, give each its own MockStream component; the shared stream never takes these over. Their settings are C# properties rather than Inspector fields, so this wrapper exposes the important ones in the Inspector and configures the stream when the scene starts:
using System;using ImpossibleRobert.Common.Timing;using MockMagic;using UnityEngine;
public class SimulatedSensor : MonoBehaviour{    public string sensorName = "Pump 3 pressure";    public SeriesPattern pattern = SeriesPattern.GaussianNoise;    public StreamRhythm rhythm = StreamRhythm.Drip;    public float minValue = 2.5f;    public float maxValue = 3.5f;    public float noise = 0.1f;    public int cycleLength = 60;
    public event Action<string, float> Reading;
    MockStream stream;
    void Start()    {        stream = gameObject.AddComponent<MockStream>();        stream.Pattern = pattern;        stream.Rhythm = rhythm;        stream.MinValue = minValue;        stream.MaxValue = maxValue;        stream.Noise = noise;        stream.CycleLength = cycleLength;        stream.Interval = 1f;      // Constant interval and Drip average; Burst spaces emissions a tenth of this apart        stream.MinInterval = 0.4f; // Random rhythm        stream.MaxInterval = 3f;        stream.BurstCount = 10;        stream.BurstDelay = 30f;        stream.ClockMode = ClockMode.Scaled; // a paused twin pauses its sensors        stream.LabelPreset = LabelPreset.Custom;        stream.CustomLabels = new[] { sensorName }; // every reading carries the sensor's name        stream.Register(OnPoints);        stream.StartStream();    }
    void OnDestroy()    {        if (stream == null) return;        stream.Unregister(OnPoints);        stream.StopStream();    }
    void OnPoints(MockDataPoint[] points)    {        foreach (MockDataPoint point in points)            Reading?.Invoke(point.Label, point.Value);    }}
Put one SimulatedSensor on each sensor object in the scene and let the panels subscribe to its Reading event. A few setups cover most of the table above:
- A pressure gauge: Gaussian Noise between 2.5 and 3.5 with the Drip rhythm, so readings jitter and arrive about once a second at irregular moments.
- A tank level: Random Walk between 0 and 100 with the Constant rhythm, so the level keeps wandering from its last value.
- A vibration alarm: Sparse between 0 and 10 with the Constant rhythm, so most readings are quiet and some spike.
- A gateway that uploads in batches: the Burst rhythm, so ten readings arrive 0.1 seconds apart, followed by a 30-second pause.
Sensor names and labels
In a series, the sensor’s name goes into seriesName or seriesNames, and the x-axis labels can be your own, either through the Custom preset or built yourself as in the history example. Streams take custom labels too: SimulatedSensor sets the Custom preset with the sensor’s name as the only label, so every reading carries it. A longer list cycles from one reading to the next, the Live Stream workspace offers the same Custom labels field, and an empty list falls back to Item 1, Item 2 and so on. When you would rather count samples, the Numeric preset gives a running number across emissions.
Preview in Edit Mode first
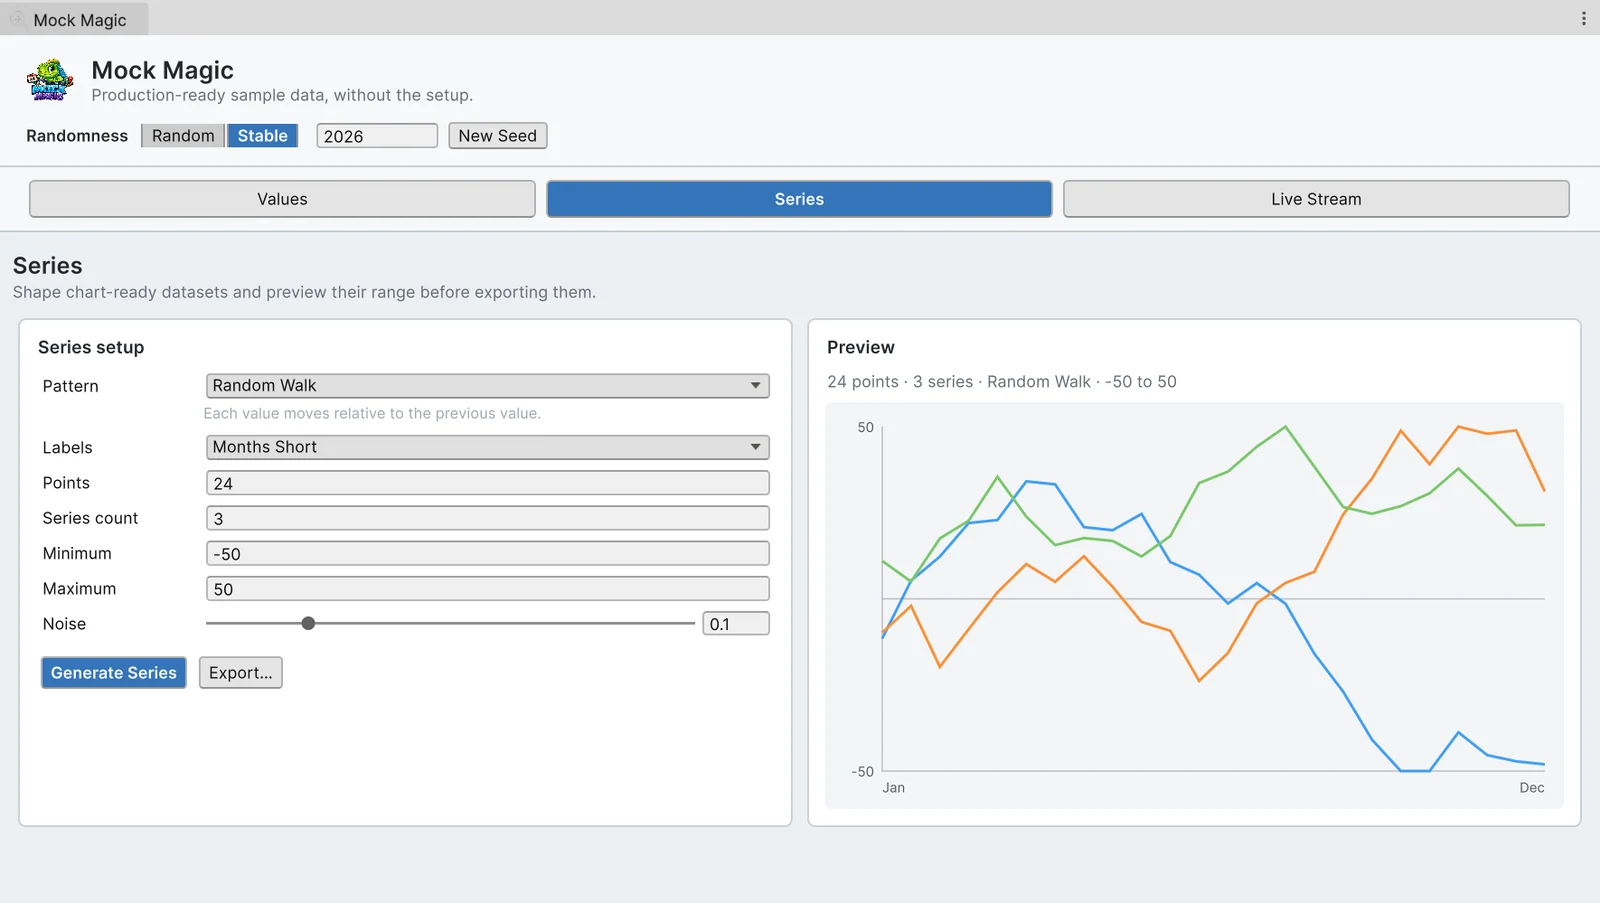
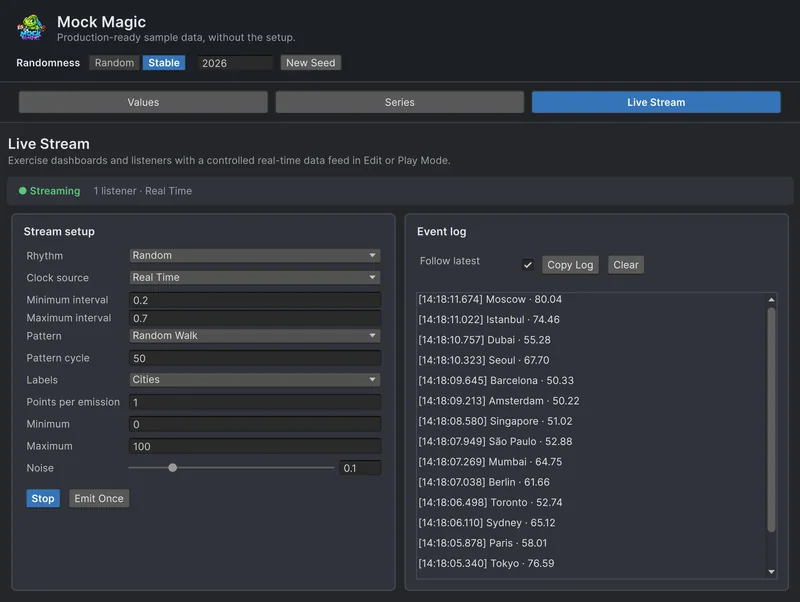
Shapes and timing are quicker to judge in Tools > Mock Magic > Generator than in code. The Series workspace generates and previews a history of up to 1,000 points, with Custom labels when you need them. The Live Stream workspace runs any rhythm and pattern cycle in Edit Mode and lists each reading with a millisecond timestamp in its Event log, so you can see what a burst of ten or a Drip average of one second looks like before a panel depends on it.
Compared with Unity’s IoT Sample Project
Unity’s free IoT Sample Project shows a complete pipeline: simulated device data produced by Python scripts, sent over MQTT, with Azure integration. It is the better reference when the connection itself is the work, because it deals with the MQTT and cloud side, which Mock Magic does not touch at all. Mock Magic works one step earlier. It generates the data inside the Unity process, in Edit Mode and Play Mode, with no scripts to run outside Unity and no broker to host, which fits the phase where you design the scene, the panels and the alarm rules. When the real feed is ready, your MQTT client calls the same listener code the mock stream called.
Hand the feed to Chart Guru
A twin’s panels are mostly charts: trends, gauges and sparklines. Digital twin and HMI charts covers them with Chart Guru, which includes Mock Magic and offers a Mock Chart Data Source that streams test data into a chart without code. To push readings from your own listeners into a scrolling chart, see real-time graphs in Unity. The stream settings in general are explained in simulating live data without a backend.
Frequently asked questions
How do I simulate sensor data in Unity?
Give each sensor its own MockStream component with a pattern, rhythm and pattern cycle set in code, and register a listener that forwards every reading to your twin. For a history chart whose live values continue the same curve, draw both from one MockSeriesCursor.
Can Mock Magic replace an MQTT or Azure IoT connection?
Only while you build. It generates data inside Unity and has no network transport, so it stands in for the feed until your real client is ready to call the same code.
Can I run several simulated sensors at the same time?
Yes. MockStreaming is one shared stream, but every MockStream component you add is independent, with its own settings, listeners and timing.
Realistic fake data for Unity, from one value to a live stream.
Keep reading
 Use case
Simulate live data in Unity without a backend
Build the live parts of a UI before the server exists. Mock Magic sends labeled values that continue their pattern to your listeners on a schedule you choose, in Edit Mode or Play Mode, so bursts, gaps and pauses show up early.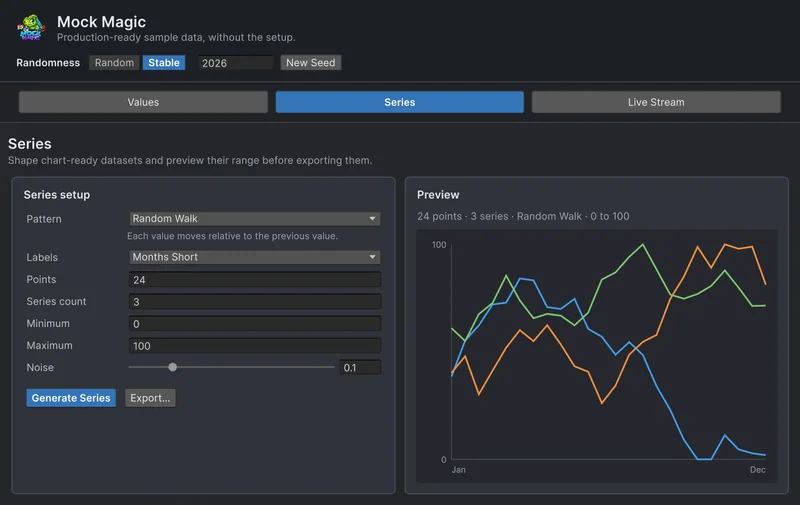 Use case