Swift Charts 3D in Unity: what carries over
How Apple's Swift Charts 3D concepts map to Unity with Chart Guru 3D: Chart3D, z values, SurfacePlot, poses, projection and surface styles, and what Unity adds.
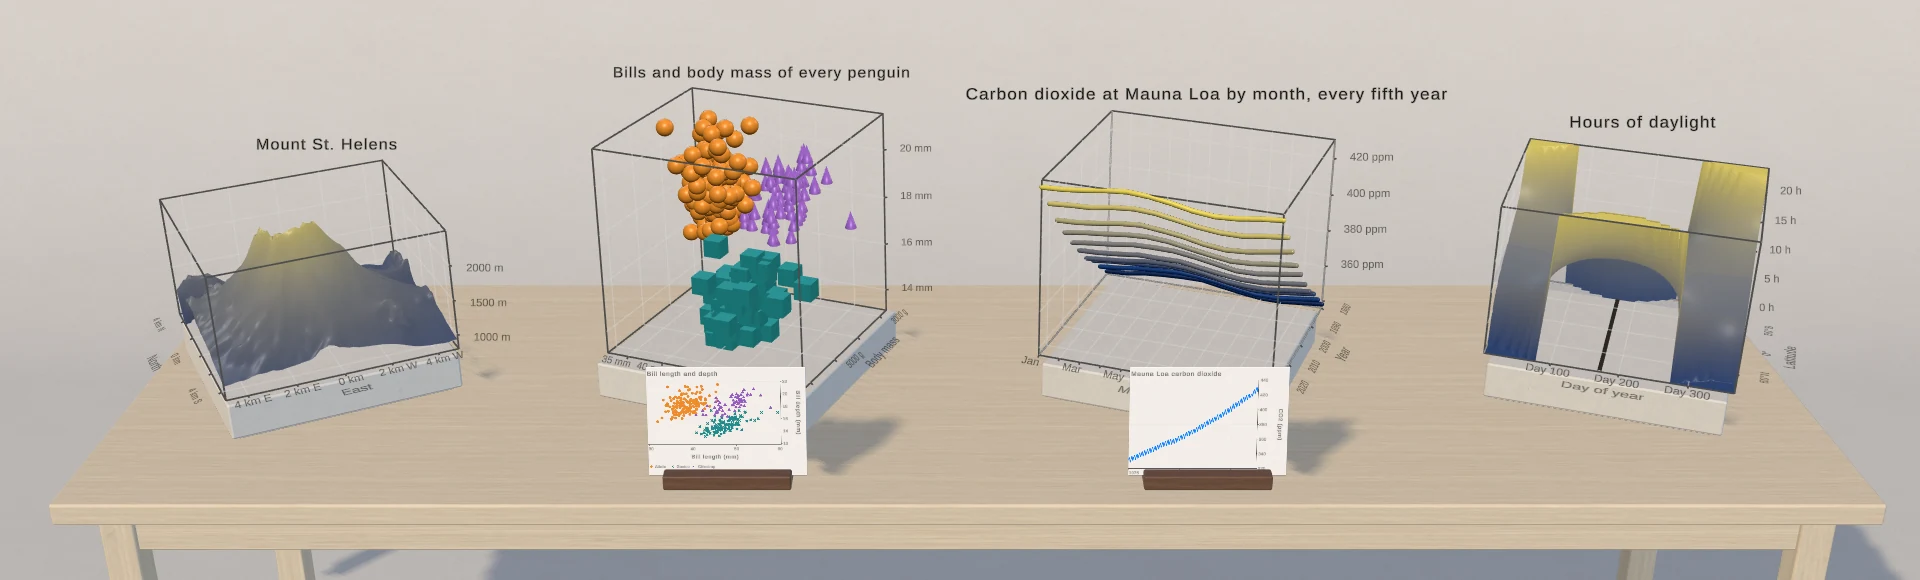
At WWDC25 Apple extended Swift Charts into three dimensions. Chart3D shipped with iOS 26, macOS 26 and visionOS 26, and it does what Swift Charts always did well: a few marks, a few modifiers and good defaults. If you write Swift, the question is how much of that vocabulary survives in Unity. If you write C# for Unity, the question is why a Swift API should matter to you at all.
The short answers: the concepts carry over one to one, and the C# names follow them in PascalCase. A proven vocabulary helps even if you never write a line of Swift, because it gives a 3D chart library a small set of words that each mean one thing, and defaults that look right before you configure anything.
What Swift Charts 3D introduced
Chart3D keeps the 2D model and adds a third axis:
- Marks with z.
PointMark,RuleMarkandRectangleMarktakex,yandz. A rule is one range at two values, a line along one axis, and a rectangle is two ranges at one value, a flat plane. Ranges are half-open, such as0.0 ..< 6.0. - Surfaces.
SurfacePlotdrawsy = f(x, z)from a closure, and a.nanresult leaves a hole. - Poses.
chart3DPosesets azimuth and inclination, with presets for default, front, back, top, bottom, left and right. - Projection.
chart3DCameraProjectionchooses orthographic, perspective or automatic, which is orthographic. - Surface styles.
.heightBased, optionally with a gradient and ayRange, and.normalBased. - 3D symbols and materials. Sphere, cube, cylinder and cone symbols,
symbolRotation, androughnessandmetalness. - The Z axis.
chartZAxis,chartZScaleandchartZSelectioncomplete the set.
How each concept maps
Chart Guru 3D mirrors these concepts wherever they map cleanly to Unity:
| Swift Charts 3D | Chart Guru 3D (C#) |
|---|---|
Chart3D { ... } | Chart3D.Create(), which returns a Chart3DBuilder |
PointMark(x:y:z:) | new PointMark3D(x, y, z) |
RuleMark(x:y:z:) | RuleMark3D |
RectangleMark(x:y:z:) | RectangleMark3D |
SurfacePlot(x:y:z:) { ... } | new SurfacePlotMark("X", "Y", "Z", (x, z) => ...) |
.foregroundStyle(.heightBased) | .ForegroundStyle(SurfaceStyle.HeightBased) |
.symbol(.sphere) | .Symbol(Symbol3D.Sphere) |
Chart3DPose(azimuth: .degrees(20), inclination: .degrees(7)) | new Chart3DPose(20f, 7f) |
.chart3DPose(.front) | .Chart3DPose(Chart3DPose.Front) |
.chart3DCameraProjection(.perspective) | .Chart3DCameraProjection(Chart3DCameraProjection.Perspective) |
.chartZScale(domain:) | .ChartZScaleDomain(min, max) |
.roughness(_:), .metalness(_:) | .Roughness(value), .Metalness(value) |
.chartZSelection(value:) | Chart.OnZSelectionChanged or Chart3DBuilder.ChartZSelection(handler) |
The defaults follow the Swift side too. Automatic projection is orthographic, unsized points draw at 0.03 of the plot, and 3D text is calibrated to Swift Charts 3D, where a tick label’s cap height is about 3.4% of a one-unit plot. Text then scales with the plot, so labels keep that share at any plot size.
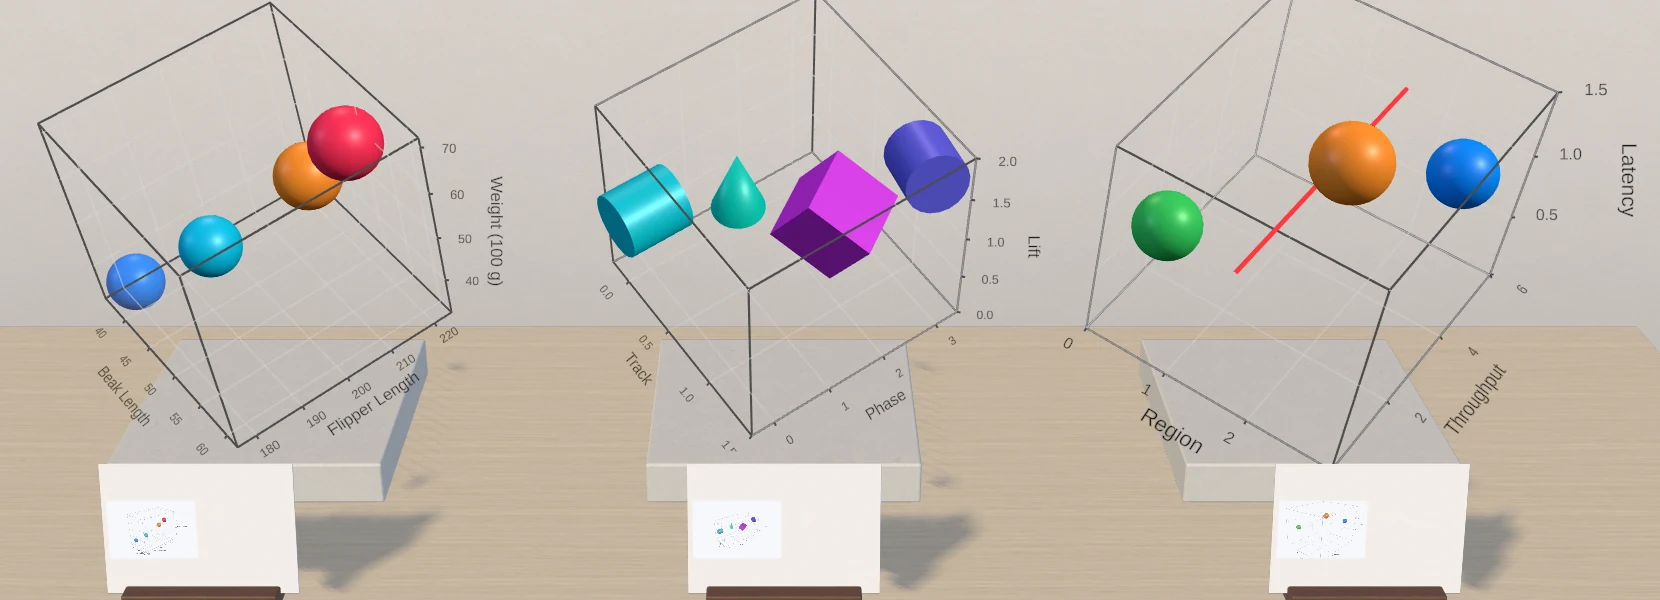 The Swift Charts 3D Import scene: live imports beside native renders captured on the iOS 27 simulator.
The mapping is more than naming. Paste a supported Chart3D declaration into a 3D chart’s Inspector or the Chart Designer, and Chart Guru builds the chart, reports what it skipped and can write the chart back as Swift. The Swift Charts 3D import guide covers what imports and what does not.
The same shape as 2D Chart Guru
Swift Charts 3D adds z: to marks you already know, and Chart Guru 3D extends Chart Guru’s 2D API the same way. The builder keeps its shape, and a 3D mark takes one more value:
// 2DChart chart = Chart.Create()    .Add(new BarMark(PlottableValue.Value("Region", "North"), PlottableValue.Value("Sales", 12f)))    .Add(new BarMark(PlottableValue.Value("Region", "South"), PlottableValue.Value("Sales", 7f)))    .Build();host.SetChart(chart);
// 3DChart cloud = Chart3D.Create()    .Add(new PointMark3D(PlottableValue.Value("Flipper (mm)", 190f), PlottableValue.Value("Mass (g)", 3700f), PlottableValue.Value("Bill (mm)", 38.8f)))    .Chart3DPose(Chart3DPose.Default)    .Build();chart3D.SetChart(cloud);
The rest of the model is shared as well. A 3D chart is a Chart Guru chart definition with a 3D chart type, so data assets, data sources, SetData and themes work exactly as in 2D, and the same Chart Designer and inspectors edit both. Existing 2D marks lift with .Z(z): a PointMark, BarMark, LineMark or AreaMark becomes its 3D mark and keeps its style. ChartTypeExtensions.Extrude and Flatten map each 2D chart type to its 3D form and back.
Where Chart Guru 3D differs on purpose
Native captures of the sample corpus show a few places where Chart Guru deliberately does not copy the native behavior:
- Native Chart3D ignores
chartForegroundStyleScaleand draws keyed marks in default colors. Chart Guru applies the scale, and the import notes the difference. - A native logarithmic scale labels decades but places marks linearly. Chart Guru draws a logarithmic scale.
- Native Chart3D stops with an assertion failure for a rule without a range or a rectangle with ranges on all three axes. Chart Guru imports such rules with a warning and treats boxes as an extension.
- Point sizes are diameters, as in Chart Guru’s 2D charts, where Swift Charts sizes spheres by radius. Imports double sphere sizes and exports halve them.
Some native features are not matched yet: animated pose changes in the style of withAnimation (Chart3DPose.Lerp blends two poses if you animate a pose yourself), the highlight and range form of chartZSelection, and the visionOS modifier chart3DRenderingStyle.
What Unity adds
A game engine does things a SwiftUI view does not try to do. Chart Guru 3D labels these as Chart Guru extensions: the galleries mark them with a Chart Guru badge, and the Swift export reports each one it leaves out.
- More chart types. 3D bars, grouped and stacked; lines drawn as round tubes; areas and stacked areas; pies, donuts and radar charts; boxes; billboard symbols that face every camera and custom point meshes; open surface boundaries and clamped surfaces.
- Interaction. Drag to orbit, scroll or pinch to zoom, double-tap to restore the home pose, and pose presets; hover tooltips; tap selection that reports X, Y and Z, even in the empty plot volume; and selection linked between 2D and 3D charts.
- Live data in place. When data keeps its shape, new values are written into the compiled marks without compiling again and without allocating once warm.
- Hosts. A GameObject in the scene, an interactive Canvas image, a texture, a UI Toolkit element and PNG captures. See charts on objects in your game world.
- The lift. A compatible 2D chart turns into its 3D form with an animated transition, in the Designer, in the Inspector or with
PlayLiftat runtime. See lifting a 2D chart into 3D. - Authoring and rendering. The Chart Designer’s 3D mode, a 3D Gallery with Swift Charts and Chart Guru badges, themes with a 3D appearance block, geometry built by Burst jobs with GPU-instanced symbols, the Built-in Render Pipeline, URP and HDRP, and Single Pass Instanced XR.
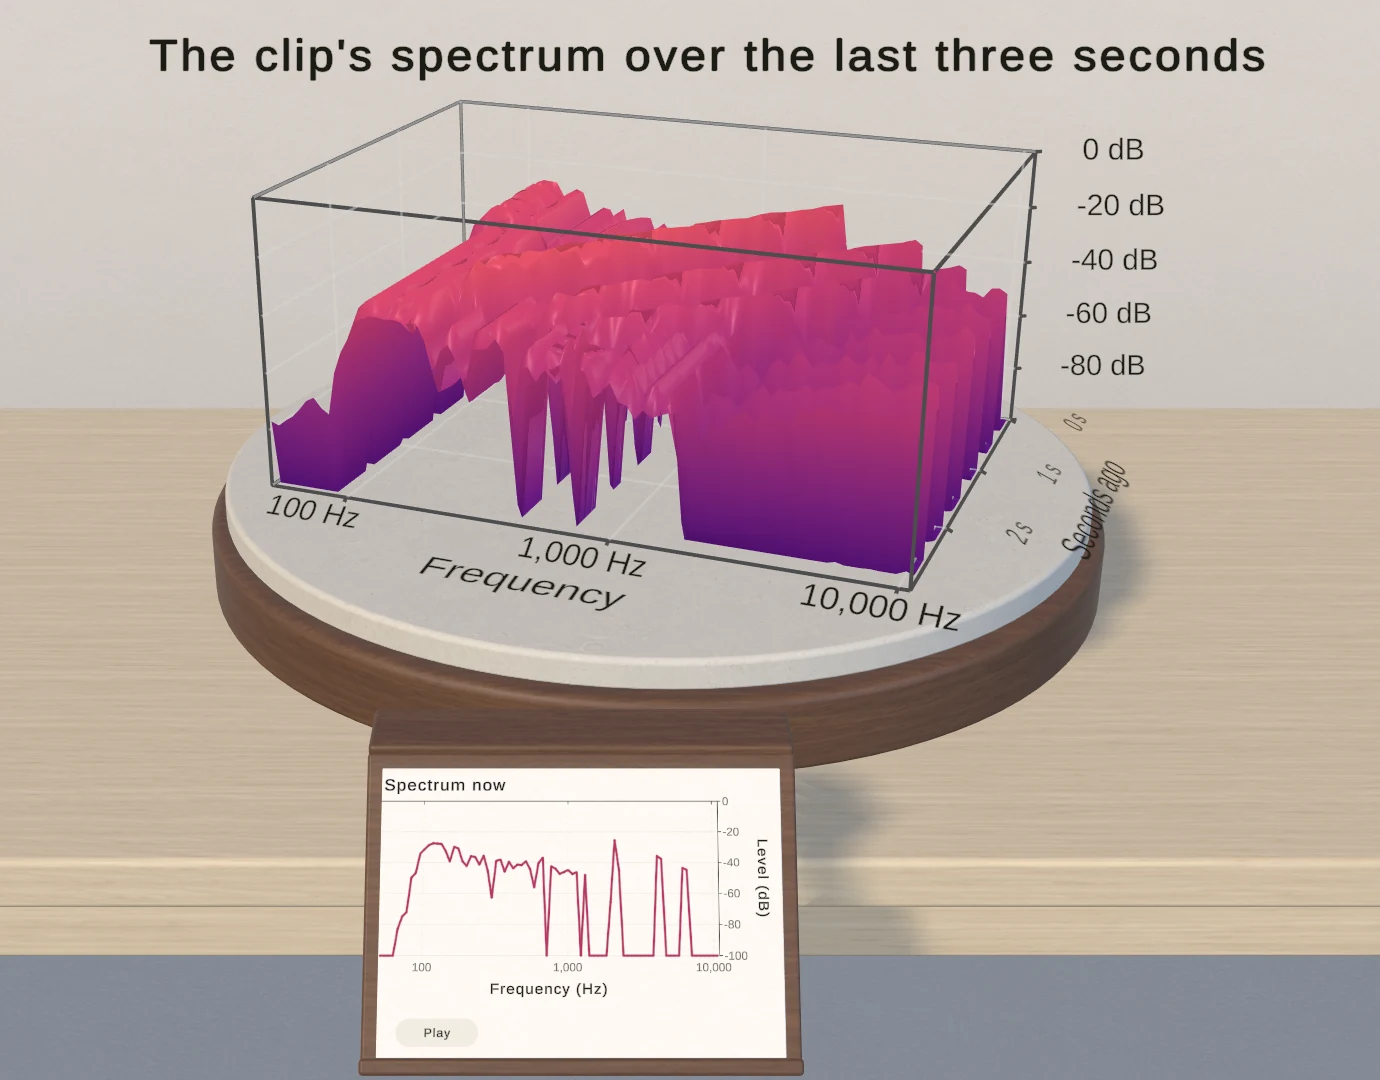 The Sound Spectrogram example writes each new spectrum into its surface in place.
The Sound Spectrogram example shows the live data path. A custom data source reads Unity’s FFT of an AudioSource, folds it into log-spaced bands in decibels and overwrites one slice of its frame at a time. The waterfall scrolls on a log frequency axis without compiling the chart again and keeps its colors fixed from the floor to 0 dB.
Surfaces, the native mark Unity needed most
Of the four native marks, SurfacePlot fills the clearest gap in Unity, which ships no surface plot of its own. Chart Guru 3D draws it from a C# delegate, from a function stored as text in a saved chart, or from an imported Swift closure, and it adds what measured data needs: surfaces from grids of rows such as terrain or yield curves, holes for missing values, and fixed color ranges that keep their meaning while values stream in. The surface plot guide covers those details, and the 3D scatter plot guide covers points, rules and planes.
A note on visionOS
Swift Charts 3D is at home on visionOS, so it is fair to ask whether Chart Guru 3D is too. The honest answer is that it has not been validated there. Its shaders carry stereo eye data for Single Pass Instanced XR, and its validation targets are Unity 2022.3 with URP 14 and HDRP 14 and Unity 6 with URP 17 and HDRP 17, plus the Built-in Render Pipeline on both. If visionOS is your target, build a small test scene and check it on a device before you depend on it.
Where to go next
- Import Swift Charts 3D code into Unity for the importer in detail.
- Why Chart Guru follows Swift Charts conventions for the reasoning behind the vocabulary.
- The Chart Guru 3D manual for setup and every 3D host.
Chart Guru 3D is included with Chart Guru for Unity, with no separate purchase. It is available as Chart Guru on the Unity Asset Store.
Frequently asked questions
Do I need to know Swift to use Chart Guru 3D?
No. The Swift names give the C# API a small, proven vocabulary, written in PascalCase, and most charts are built in the Chart Designer or in C#. The Swift import is there for teams that already have Swift Charts code.
Has Chart Guru 3D been validated on visionOS?
Not yet. Its shaders carry stereo data for Single Pass Instanced XR, and its validation targets are Unity 2022.3 and Unity 6 with the Built-in Render Pipeline, URP and HDRP. If visionOS is your target, test on a device before you commit to it.