What you can do with Chart Guru 3D
What Chart Guru 3D does in Unity: lift 2D charts into 3D, plot surfaces and terrain, build 3D scatter plots, put charts in a game world and import Swift Charts 3D.

Lift a 2D chart into 3D in Unity
Compatible charts switch from 2D to 3D with an animated lift: the flat chart turns from the front view into its 3D pose while its marks gain depth. The Chart Designer, the inspectors and the runtime API share the same lift.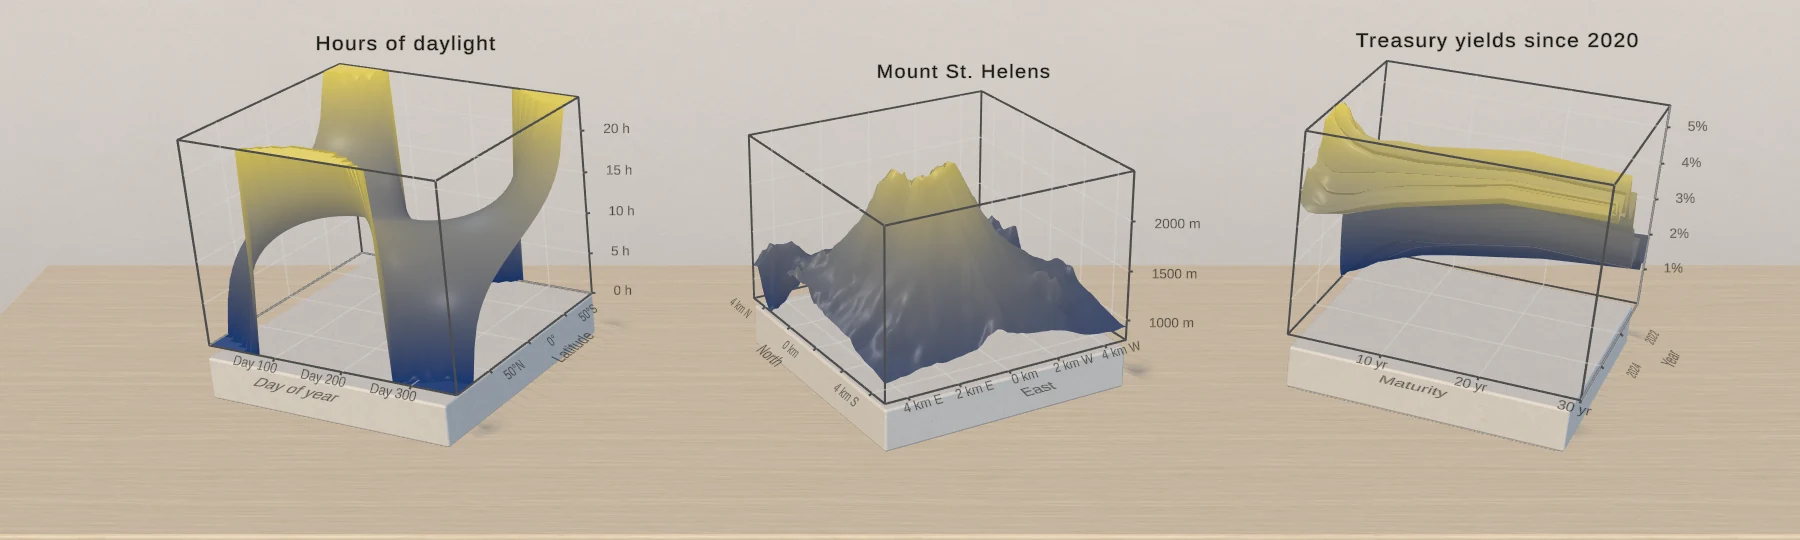
Surface plots and terrain data in Unity
Chart Guru 3D draws a surface from a function or from a grid of measured rows, colors it by height or slope with viridis, magma, cividis or turbo, and leaves holes where values are missing instead of dropping the surface.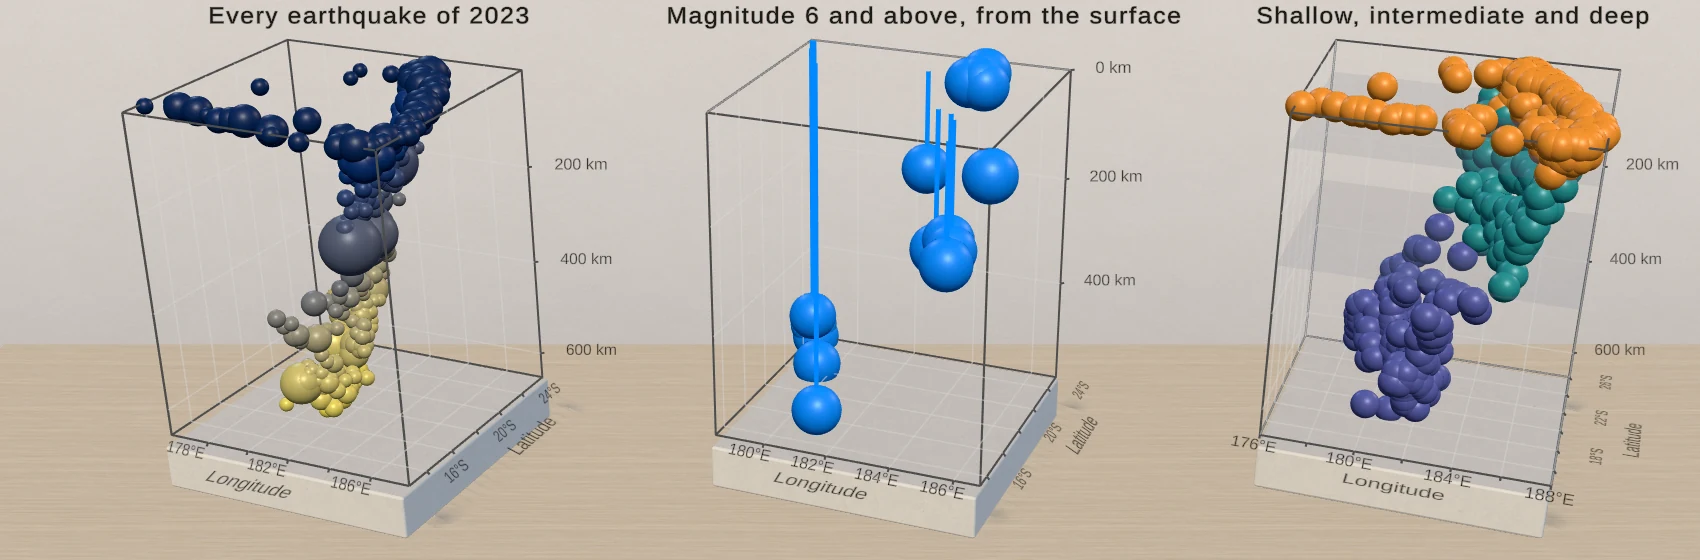
3D scatter plots and point clouds in Unity
PointMark3D places a symbol at three values. Size and color the points from data columns, add rules and planes for context, and let users orbit, hover and select, with a linked 2D chart where a flat view reads better.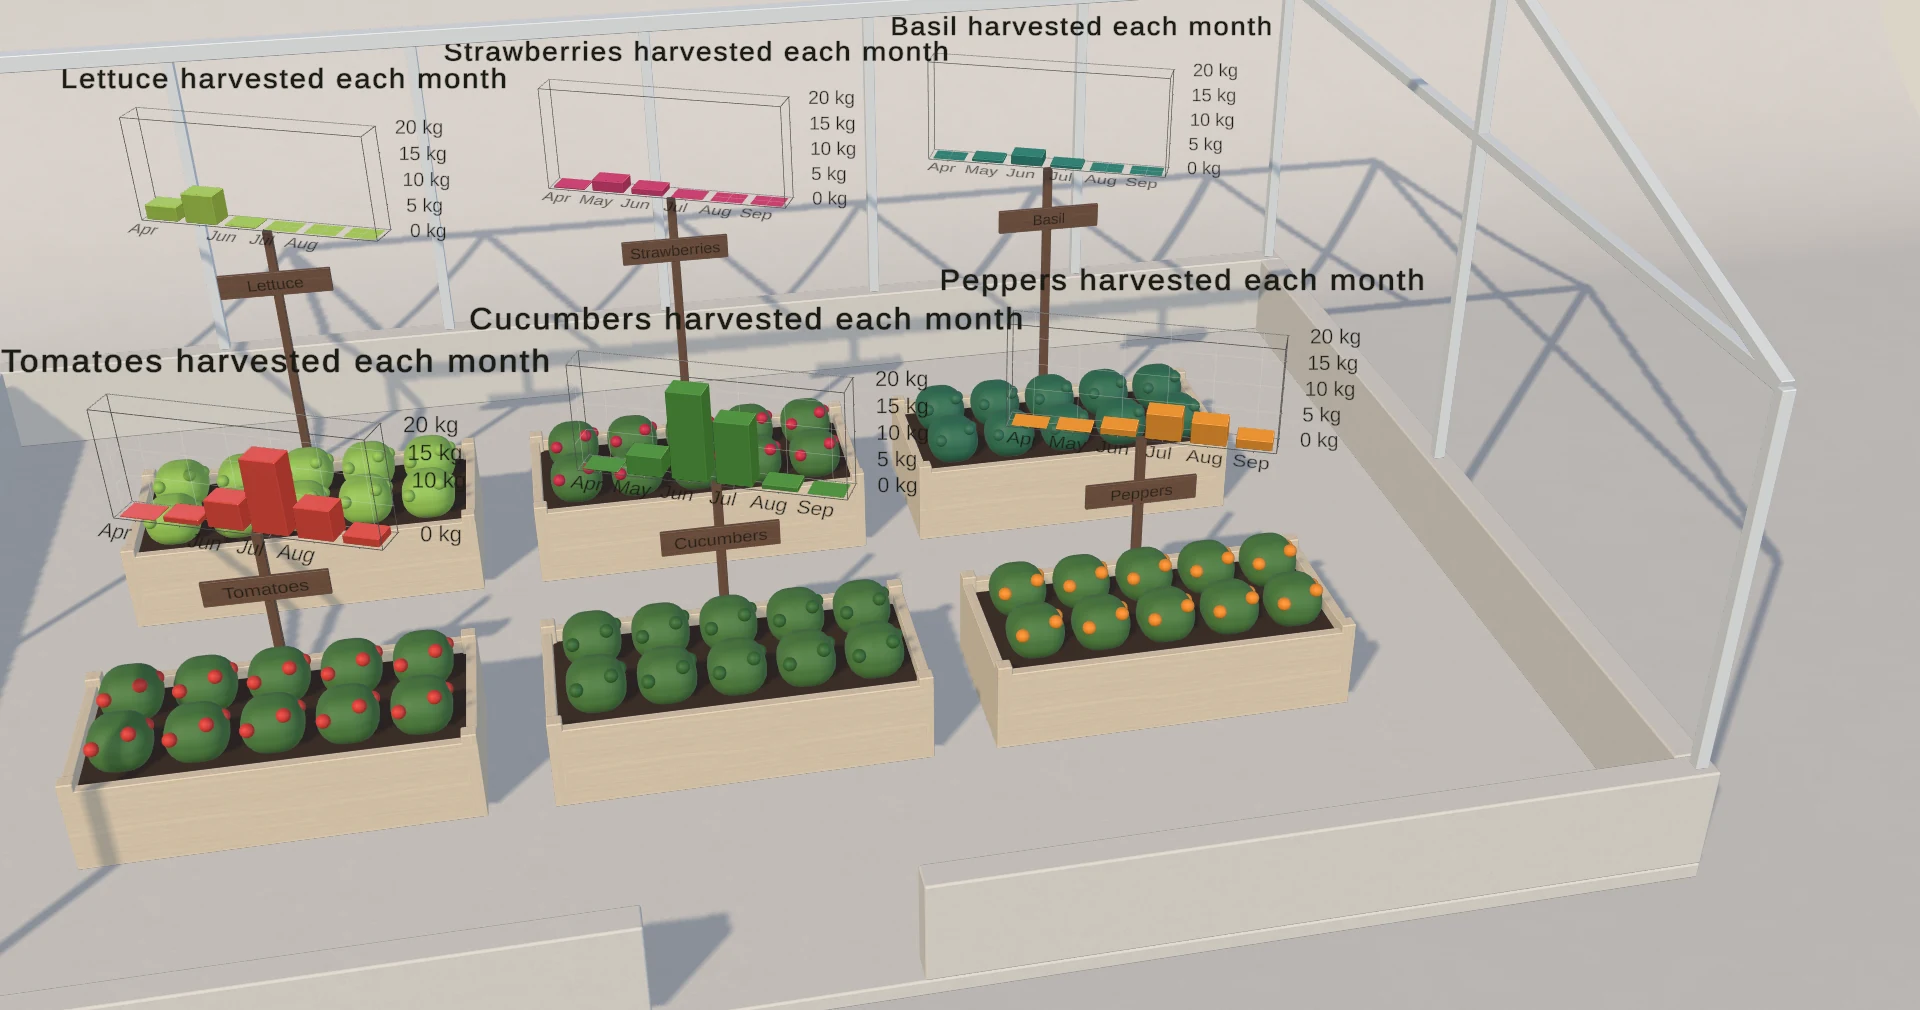
Charts on objects in your Unity game world
A Chart 3D is a GameObject in your level: it follows its transform, every camera sees its own side, labels face the camera and pointer input needs no colliders. The greenhouse example puts a harvest chart beside every raised bed.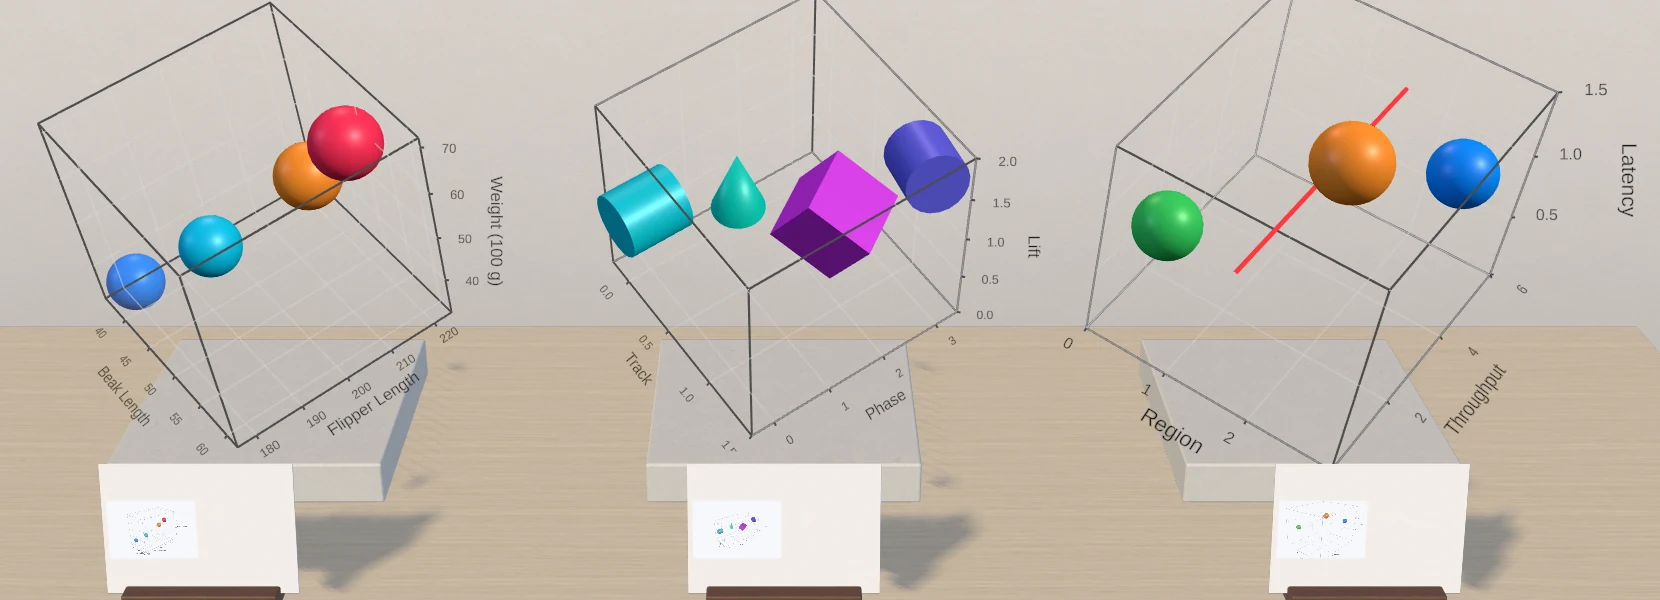
Import Swift Charts 3D code into Unity
Chart3D arrived with iOS, macOS and visionOS 26. Chart Guru 3D imports its marks, poses, projections and scales into a saved Unity chart, names every construct it skips, and exports back to Swift with its own extensions identified.Start with the chart you already have
Chart Guru 3D is included with Chart Guru, so there is nothing extra to buy or import. It draws the same chart definitions, data sources and themes as the 2D charts, you design it in the same Chart Designer and inspectors, and its C# builder has the same shape with a Z value added. Most projects start with a flat chart and add depth where the third value carries information.
- If you have 2D charts already, start with lifting a 2D chart into 3D: an animated switch that keeps the data, settings and styling.
- If your data is a grid or a function of two variables, start with surface plots and terrain data.
- If each record has three measurements, start with 3D scatter plots and point clouds.
- If the chart belongs on an object in your level, start with charts on objects in your game world.
- If you have Swift Charts 3D code, start with importing Swift Charts 3D code.
For background, Swift Charts 3D in Unity: what carries over maps Apple’s Chart3D concepts to Chart Guru 3D and lists what Unity adds. For 2D jobs such as UI Toolkit dashboards, real-time graphs and trading screens, see the Chart Guru use cases.
The data behind these guides
The scenes on these pages ship with Chart Guru 3D and plot real public data: USGS earthquake catalogs for Tonga and Mount St. Helens, USGS elevation data, U.S. Treasury yield curves, Palmer penguin measurements, EIA grid data for Texas, NOAA’s Mauna Loa carbon dioxide record and hours of daylight computed with NOAA’s solar equations.
Requirements in one paragraph
Chart Guru 3D runs in Unity 2022.3 or newer and needs Chart Guru 1.4 or newer; the combined package installs both together. It renders in the Built-in Render Pipeline, URP and HDRP with its own shader programs for each, and its validation targets are Unity 2022.3 with URP 14 and HDRP 14 and Unity 6 with URP 17 and HDRP 17, plus the Built-in pipeline on both. The Chart Guru 3D manual covers setup, every 3D host and the render pipeline details.