Charts on objects in your Unity game world
Place Chart Guru 3D charts on objects in a Unity scene: GameObjects that follow their transform, camera-facing labels, pointer input without colliders and live data.
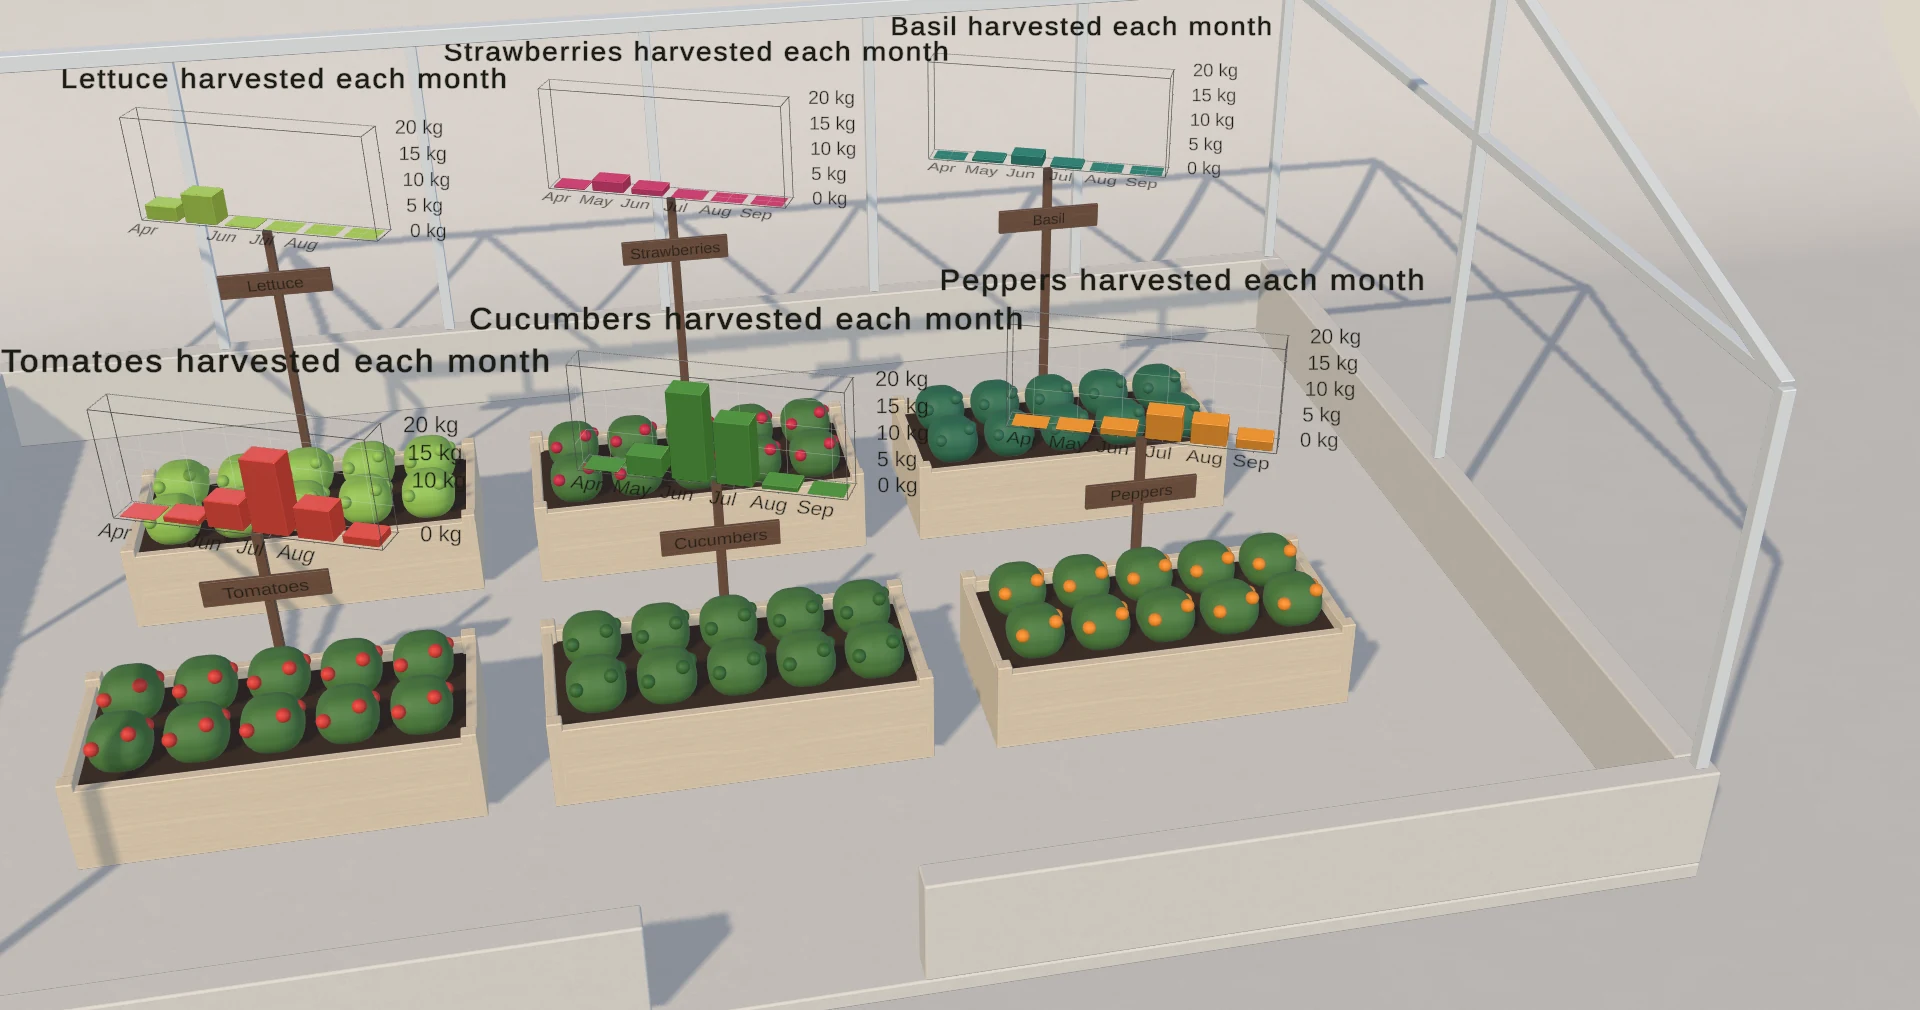
A chart on a HUD reports to the player. A chart on an object in the level is part of the place: a harvest chart beside a garden bed, a pressure curve on a machine, a leaderboard on a lobby wall. Chart Guru 3D makes such charts ordinary scene objects that you place, parent and move like anything else.
A chart is a GameObject
A Chart 3D (Chart3DComponent) stands in world space and follows its transform, so you can move it, scale it or parent it to something that moves. GameObject > Chart Guru > 3D > Bar Chart, Point Chart or Surface Chart places a chart with saved data at the Scene view pivot or under the selected object, adds an EventSystem and a Chart Raycaster when they are missing, and frames and selects it as one Undo step.
The chart’s pose turns a hidden content child about the plot center, so turning a chart never touches your transform and never rebuilds its marks. Without a camera rig, every camera sees the chart from where it stands, the Scene view and second cameras included: each picks its own axis walls, ticks and label sides, and moving cameras cause no rebuilds or allocations. Plot Size sets the chart’s size in world units, and 3D text scales with the plot, so labels keep their share on a small tabletop chart and on a large wall chart alike.
Labels that read from where the player stands
X and Z tick labels and titles rest on the floor plane beyond the plot’s front and side edges, so a chart can stand on a table or a shelf. They lie flat when seen from above and lean toward lower cameras. Y labels face the camera, the chart’s title and subtitle face each camera outside the axes and legend, and an axis seen end-on hides its labels. If the text is too small or too large, change the theme’s Label Scale instead of font sizes, and all 3D text resizes together.
A soft contact shadow plane under the plot catches the main light’s shadows on URP and the Built-in Render Pipeline. HDRP hides it.
Pointer input without colliders
A Chart Raycaster on the camera lets the EventSystem reach world charts for hover, tooltips, selection and orbit, and the charts need no colliders. It works next to a Physics Raycaster or on its own, and results are ordered by distance, so a nearer collider still blocks a chart behind it. Because input arrives through the EventSystem, it works with the Input System and with the legacy Input Manager.
In a game you often want a chart that reads but does not spin. Turn off Orbit on the Behavior tab, or Definition.Spatial.RotationEnabled in code, so drags no longer turn it. Hover shows a tooltip, and a tap reports the mark and its X, Y and Z values to the host’s selection events.
Charts on props, screens and UI
The same chart can appear in several places:
| Host | Where it draws | Input |
|---|---|---|
| Chart 3D | In the scene as a GameObject | Through a Chart Raycaster |
| Chart 3D Image | On a Canvas, through its own camera | Orbit, zoom, hover and tap |
| Chart 3D Texture | Into a RawImage, such as one on a world-space Canvas on a prop | None |
Chart3DElement | In UI Toolkit, including a world-space PanelRenderer on Unity 6.5 or newer | Orbit, zoom, hover and tap |
| Capture | A texture or PNG, by default 1600 by 1000 pixels supersampled twice | None |
Image and Texture can host their own chart or mirror a Chart 3D in the scene, and every output renders only when its chart, view or size changes, so a still chart costs nothing per frame. A Chart 3D Texture’s Texture property returns the render texture it draws into. The Charts in UI and Textures scene puts a captured chart, a Chart 3D Texture and a Chart 3D Image on paper cards.
Flat charts belong in the world too. A Chart Graphic on a world-space Canvas draws any 2D chart in the scene and also receives pointer events without colliders; charts in VR and world space covers that path.
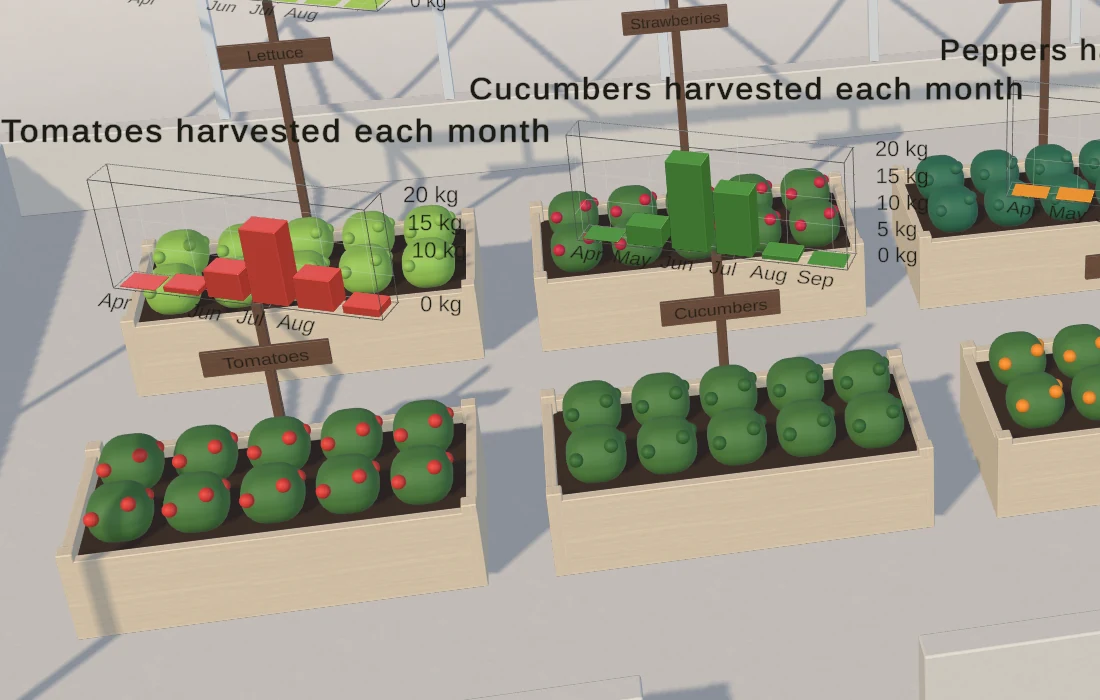 A Chart Guru chart placed on an object in a 3D scene.
Live values without rebuilds
Game data changes constantly, and a chart that recompiles on every change wastes frames. Keep the frame’s shape, meaning the same columns, rows and categories, and Chart Guru writes the new values into the existing marks: bar heights, point positions and sizes, line and area values, surface heights and rule and rectangle extents, without compiling again and without allocating once warm.
ChartDataFrame frame = new ChartDataFrame( ChartDataColumns.Category("Month", months), ChartDataColumns.Numeric("Harvest (kg)", harvest));bedChart.SetData(frame, shapeChanged: false);Pies, donuts, radars, candlesticks, heat-map surfaces, date values and frames that add or remove marks compile again, and a frame published as a shape change rebuilds once and plays the chart’s data animation if it has one. Fix the Y domain when ticks should not jump. A custom ChartDataSource can also overwrite its published columns and call PublishValueChange() once per frame; values that arrive on other threads go into a RingBufferChartDataSource instead.
The greenhouse example
The Charts in a Game World example is a small greenhouse level seen from a fixed game camera. Six raised beds grow tomatoes, peppers, cucumbers, strawberries, basil and lettuce, and each bed has a small 3D bar chart of its harvest from April to September on a stake beside it. A screen-space HUD, drawn by a 2D chart, ranks the beds by season harvest.
The numbers come from a stated crop model. Each bed is a custom ChartDataSource, CropBed, whose cumulative harvest follows a logistic curve in the hours of daylight since planting, read from the Daylight Hours data at the greenhouse’s latitude of 50 degrees north. The example calls the model a demonstration, not an agronomic forecast. A second source, HarvestRanking, ranks the beds and ranks them again whenever a bed publishes new numbers. Change a bed’s planting day in the Inspector, and its chart and the ranking follow.
The pattern carries over to any game system that owns its numbers, such as an economy, a factory or a weather simulation: make the system a data source, point the charts at it, and the charts follow its changes.
Rendering notes
Chart Guru 3D ships its own shader programs for the Built-in Render Pipeline, URP and HDRP. Turning a chart writes no material state, so chart meshes stay compatible with the SRP Batcher and the GPU Resident Drawer, and the shaders support Single Pass Instanced XR.
Limits
- A Chart 3D Texture takes no input; use a Chart 3D Image for interactive Canvas UI.
- HDRP draws no contact shadow plane.
- Charts render forward only and contribute nothing to global illumination or baked lighting.
- Zoom is runtime state and is never saved; save a view as a pose.
Chart Guru 3D is included with Chart Guru for Unity, so the same package draws your HUD charts and the charts in your level. It is available as Chart Guru on the Unity Asset Store.
Frequently asked questions
Do 3D charts need colliders for hover and clicks?
No. A Chart Raycaster on the camera lets the EventSystem cast pointer rays against every enabled world chart, so charts need no colliders. Its results are ordered by distance together with the camera's other raycasters, so a nearer collider still blocks a chart behind it.
Can a chart in the level show live game data?
Yes. Bind a data source, or call SetData with a frame of the same shape and shapeChanged set to false. Bar heights, point positions, line and area values, surface heights and rule extents are then written into the existing marks without compiling the chart again and without allocating once warm.
