Lift a 2D chart into 3D in Unity
Chart Guru 3D lifts a 2D chart into 3D in Unity with an animated transition that keeps its data, settings and styling, from the Designer, the Inspector or PlayLift.

A dashboard usually starts flat. Then someone wants to see the third variable, and the usual answer is a second chart, built again in another system. Chart Guru 3D turns the chart you already have into its 3D form instead: the flat drawing turns from the front view into a 3D pose while its marks gain depth, and the data, bindings and styling come along. That animated switch is the lift, and it works the same way in the Chart Designer, in the Inspector and at runtime.
What the lift does
A lift runs between two states of one chart. At 0 the chart is its 2D drawing, seen from the front and facing the viewer. At 1 it stands at full depth in its own pose. In between, the view turns from the front pose to the chart’s pose, and the marks move from where they are drawn through a keyed transition, the same one that data changes use: paired marks move and resize, new marks grow from their base and removed marks shrink away. Pies and radar charts shrink to the plot’s height as they flatten, and a lifted pie stands on its contact shadow however tall the plot is.
The transition builds its target once and then plays from the drawn geometry, so a lift does not rebuild the chart on every frame.
Lift a chart in the Chart Designer
Open Tools > Chart Guru > Chart Designer and flip the 2D | 3D switch. The preview lifts the chart into 3D with eased camera and depth motion, and before a switch back to 2D it flattens the chart first. This animation plays independently of the chart’s data animation settings, so it runs even for a chart that animates nothing else. New documents use perspective projection in 3D.
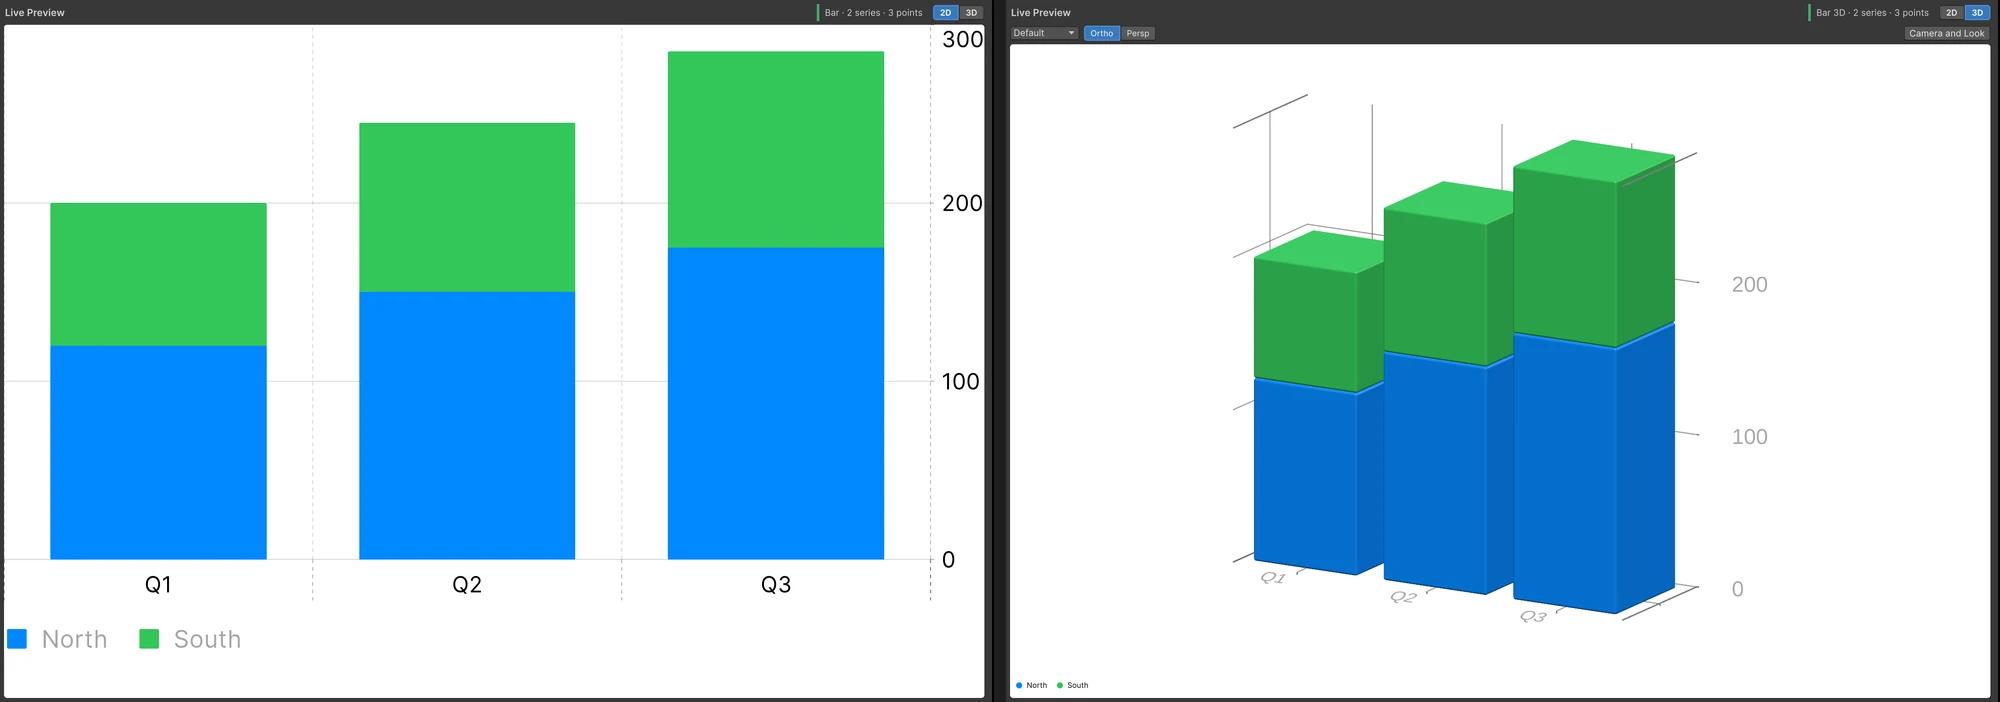 One chart in the Chart Designer, before and after the 2D | 3D switch.
The switch is one Undo step. When the chart family changes with the dimension, such as a bubble chart becoming Scatter 3D, the Designer says so, and switching straight back restores the bubble chart instead of a plain scatter chart. In 3D, the Transitions section offers Lift from 2D, which replays the lift in the preview without changing the chart.
Convert a scene chart in the Inspector
A 2D chart on a world-space Canvas converts in place. Select it and click Convert to 3D Chart under Rendering on the Output tab. As one Undo step, Chart Guru replaces it with a Chart 3D that keeps its chart, data asset, data source, name, parent and place, and sizes the 3D plot to the Canvas chart’s size in the world. The new chart then lifts out of its flat drawing. Convert to 2D Chart on the 3D chart goes back.
When a conversion cannot work, the button is disabled and the Inspector explains why:
| Situation | What the Inspector says |
|---|---|
| The chart is on a screen-space Canvas | Only world-space Canvas charts convert; show a 3D chart in screen-space UI with a Chart 3D Image |
| The chart is part of a prefab | Unpack the prefab first, because converting replaces the GameObject |
| The chart is a candlestick chart | Candlesticks have no 3D chart type; code lifts candles with CandleStickMark.Z |
| The 3D chart uses a 3D chart asset | A Canvas chart cannot show that asset; use a 2D chart asset or an inline chart |
Lift a chart at runtime
Every 3D host has the same two members. Lift runs from 0, flat, to 1, full depth, and setting it shows the new state at once. PlayLift(lift, animation, completed) animates to a value with the chart’s own animation unless you pass another, and calls completed when the lift ends. Without an animation, or while the host is inactive, the change shows at once.
| Host | Where it draws | Lift members |
|---|---|---|
Chart 3D (Chart3DComponent) | In the scene, as a GameObject | Lift, PlayLift, IsLifting |
Chart 3D Image (Chart3DImage) | On a Canvas, with pointer input | Lift, PlayLift |
Chart 3D Texture (Chart3DTexture) | Into a RawImage | Lift, PlayLift |
Chart3DElement | In UI Toolkit | Lift, PlayLift |
A definition with a 2D chart type always draws flat in a 3D host. To lift it, change it to its 3D form and play the lift. The included AI skill shows the pattern:
chart3D.Definition.Retarget(chart3D.Definition.Type.Extrude());chart3D.Rebuild();chart3D.Lift = 0f;chart3D.PlayLift(1f, completed: () => Debug.Log("Lifted"));IsLifting lets a script wait for a running lift. The 2D to 3D scene in the Style and Motion track uses it in a small loop component on four charts: a point cloud of penguin bills with flippers in depth, Texas electricity by source in 2024 as a pie, mean monthly output stacked by source as bars, and Mauna Loa carbon dioxide by month for every fifth year as lines. Each rests in 3D for three seconds, flattens into its 2D chart, rests for two and lifts again, and start delays make neighboring charts take turns.
What carries over
The dimension switch changes the chart type, and the lift changes how the chart is drawn. Everything else is shared between 2D and 3D:
- Data. The same chart definition, data assets, data sources and runtime data drive both forms, with the same precedence, and
SetData(frame, shapeChanged)has the same signature on 2D and 3D hosts. - Settings. A type change transfers compatible channels and categories, and incompatible layers infer their bindings again. Settings that do not apply in the new dimension are hidden, not deleted.
- Styling. One
ChartThemestyles both forms, and its 3D Appearance block adds lights, materials, label scale and the shadow plane. Series colors pinned in the definition match in 2D and 3D, legends resolve their entries by the same rules, and axis ticks are spaced and formatted alike.
Every 2D type except the candlestick has one 3D form, which ChartTypeExtensions.Extrude returns, and the Designer, the conversion and the 3D hosts all use this mapping:
| 2D chart type | 3D form |
|---|---|
| Bar, Mini Bar | Bar 3D |
| Line, Sparkline | Line 3D |
| Area | Area 3D |
| Point, Indicator | Point 3D |
| Scatter, Bubble | Scatter 3D |
| Pie, Mini Pie | Pie 3D |
| Donut, Mini Donut | Donut 3D |
| Radar | Radar 3D |
| Heat Map | Surface 3D |
| Candlestick | None; draws flat in 3D hosts |
ChartTypeExtensions.Flatten goes the other way and covers the 3D-only types as well: Stacked Area 3D flattens to an area chart, Rule 3D to a line chart, and Rectangle 3D and Surface 3D to a heat map.
The API extends the same way
Chart Guru’s C# API makes the same move as the lift. A 3D chart uses the same builder shape as a 2D chart, and each mark takes one more value, just as Swift Charts 3D adds z: to its marks:
// 2D: x and yChart flat = Chart.Create()    .Add(new PointMark(PlottableValue.Value("Flipper (mm)", 190f), PlottableValue.Value("Mass (g)", 3700f)))    .Build();host.SetChart(flat);
// 3D: the same shape with zChart deep = Chart3D.Create()    .Add(new PointMark3D(PlottableValue.Value("Flipper (mm)", 190f), PlottableValue.Value("Mass (g)", 3700f), PlottableValue.Value("Bill (mm)", 38.8f)))    .Build();chart3D.SetChart(deep);
Existing 2D marks lift with one modifier: .Z(z) turns a PointMark, BarMark, LineMark or AreaMark into its 3D mark and keeps its style, and CandleStickMark.Z returns a wick rule and a body box.
3D definitions in 2D hosts
The mapping also works in reverse. Give a 2D host, such as a Chart Graphic on a Canvas or a ChartGuruElement in UI Toolkit, a 3D chart definition, and it draws the flat form: the main layers take the flat type’s mark, and surfaces sampled from data become heat-map cells. The inspector explains the conversion. The rendering paths documentation lists which host draws what.
Keep both views with linked selection
Sometimes both forms belong on screen at once: the 3D chart for the overall shape, the 2D chart for precise reading. ChartSelectionLink with ChartSelectionMatch.StableIdentity selects the same rows in every linked chart, flat or spatial, matching marks by accessibility identifier or by value, so a 2D chart of a 3D chart’s X and Y columns finds the same records.
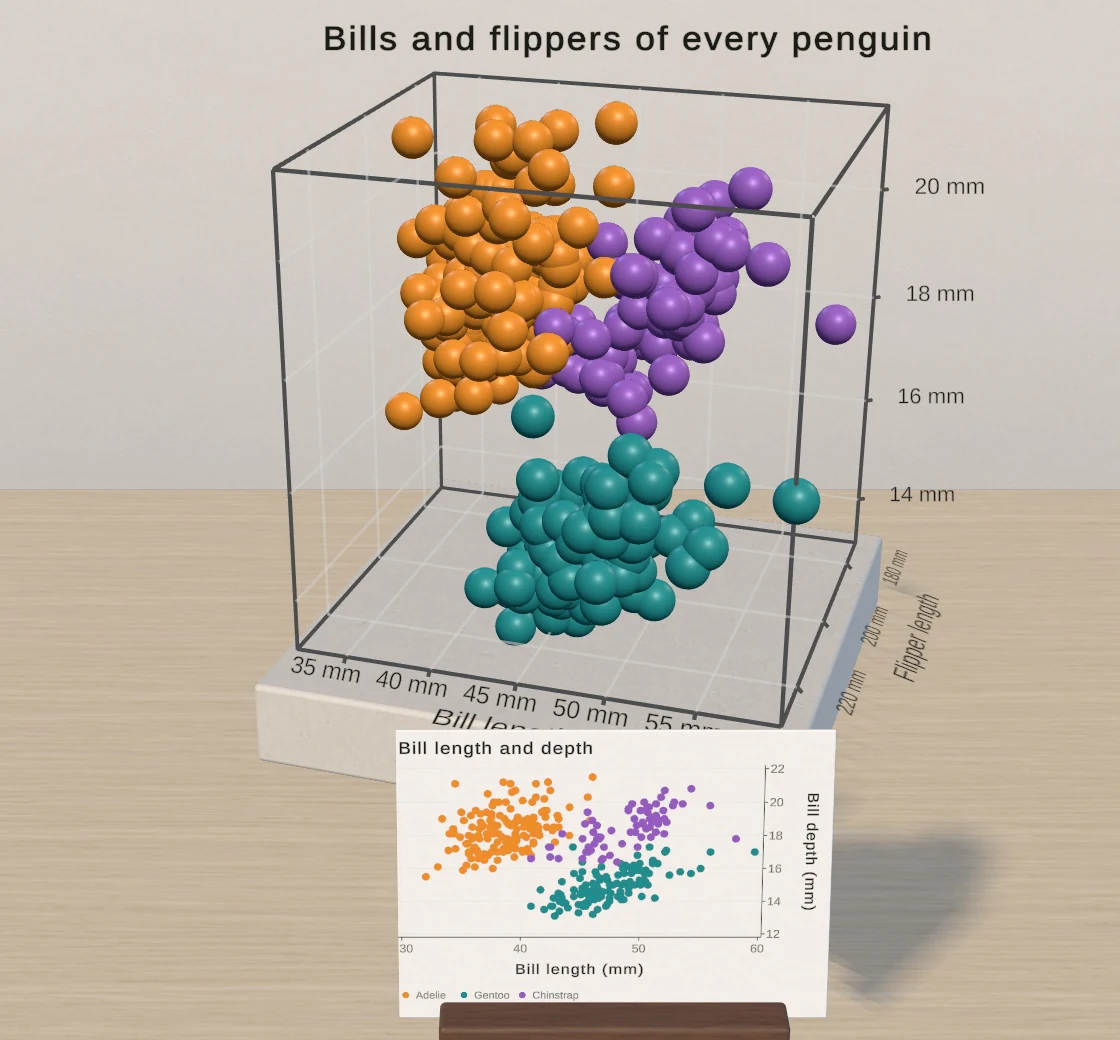 The Linked 2D and 3D scene: 342 Palmer penguins in a 3D cloud and a 2D bill chart. Select a bird in either chart and the other follows.
Limits
- Candlestick charts have no 3D chart type and draw flat in 3D hosts.
- Convert to 3D Chart works on charts on a world-space Canvas. In screen-space UI, show a 3D chart through a Chart 3D Image.
- A lift needs an animation to move; without one, the chart changes at once.
Chart Guru 3D is included with Chart Guru, so any project on Chart Guru 1.4 can lift its charts into 3D without a second purchase. It is available as Chart Guru on the Unity Asset Store.
Frequently asked questions
Which 2D chart types can lift into 3D?
Every 2D type except the candlestick has a 3D form. Bars, lines, areas, points, scatter and bubble charts, pies, donuts, radars and heat maps map to 3D types, and the compact types map to their family: a sparkline becomes Line 3D, mini bars Bar 3D, mini pies and donuts their 3D slices and an indicator a 3D point. Candlestick charts draw flat in 3D hosts, and code can lift candles with CandleStickMark.Z.
Does switching to 3D change the chart's data or settings?
The data, bindings, theme and colors stay. The chart type changes to its 3D form, compatible channels and categories carry over, and settings that only apply in one dimension are hidden rather than deleted, so they return when you switch back. In the Designer and the inspectors the switch is one Undo step.
Can I play the lift at runtime?
Yes. Chart 3D in the scene, Chart 3D Image and Chart 3D Texture on a Canvas and Chart3DElement in UI Toolkit all have Lift and PlayLift. PlayLift(1f) animates a flat chart into 3D with the chart's animation, PlayLift(0f) flattens it, and Chart 3D reports IsLifting while a lift plays.
3D bar, scatter and surface charts for Unity, included with Chart Guru.
Keep reading
 Use case
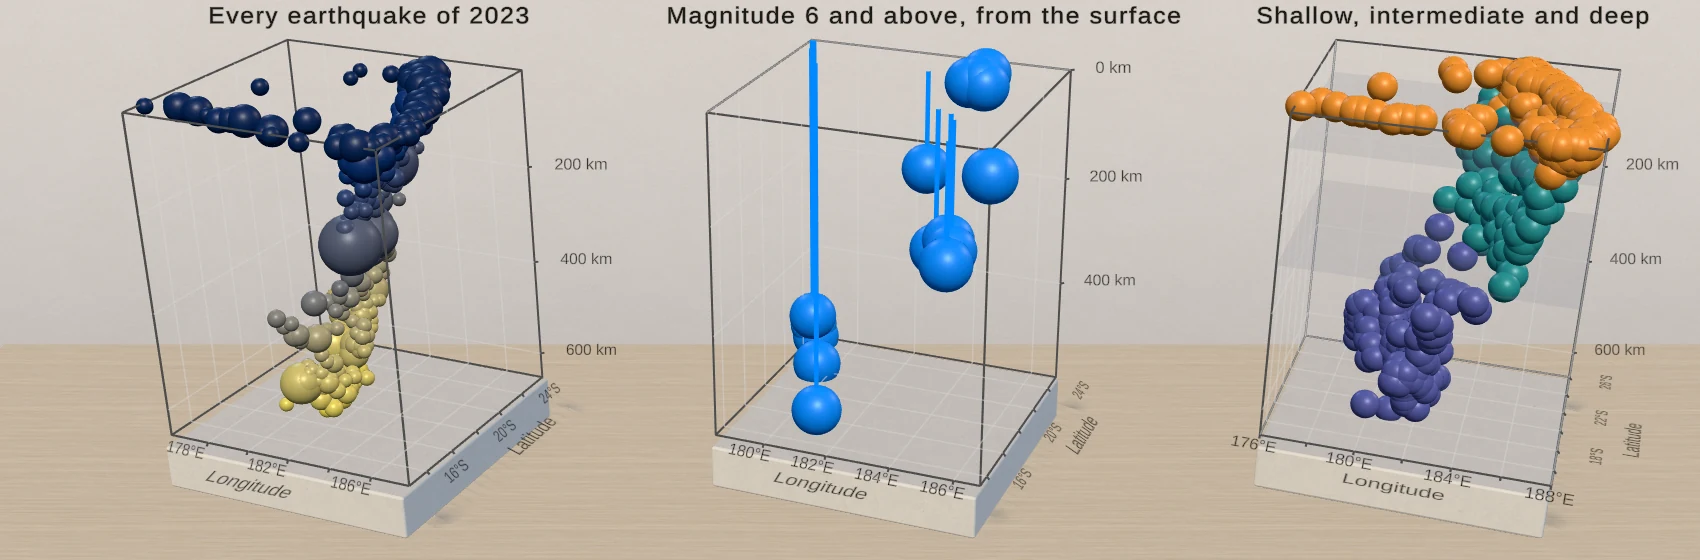
3D scatter plots and point clouds in Unity
PointMark3D places a symbol at three values. Size and color the points from data columns, add rules and planes for context, and let users orbit, hover and select, with a linked 2D chart where a flat view reads better.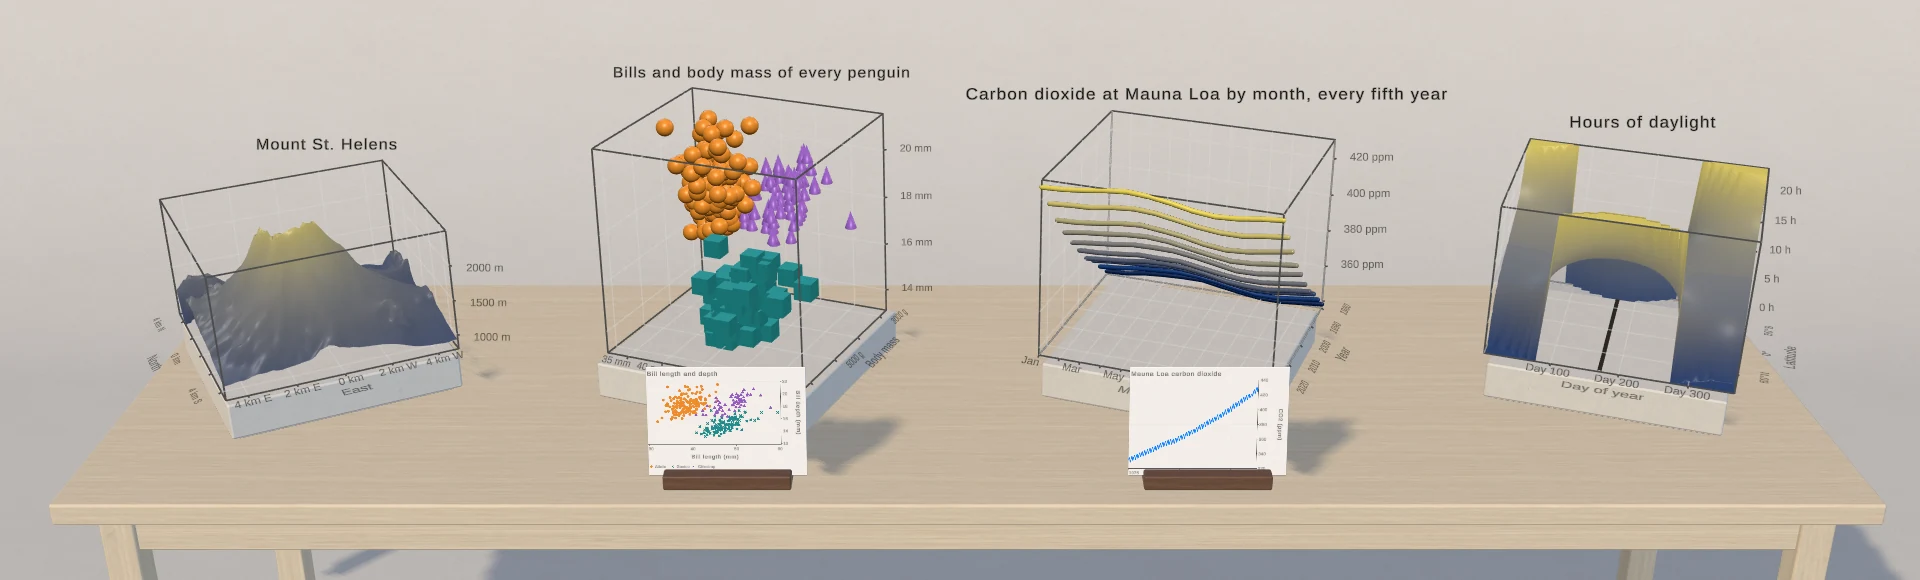 Article