Import Swift Charts 3D code into Unity
Paste Swift Charts 3D code into Unity and Chart Guru 3D builds the chart: PointMark, RuleMark and RectangleMark with z, SurfacePlot, poses, projection and scales.
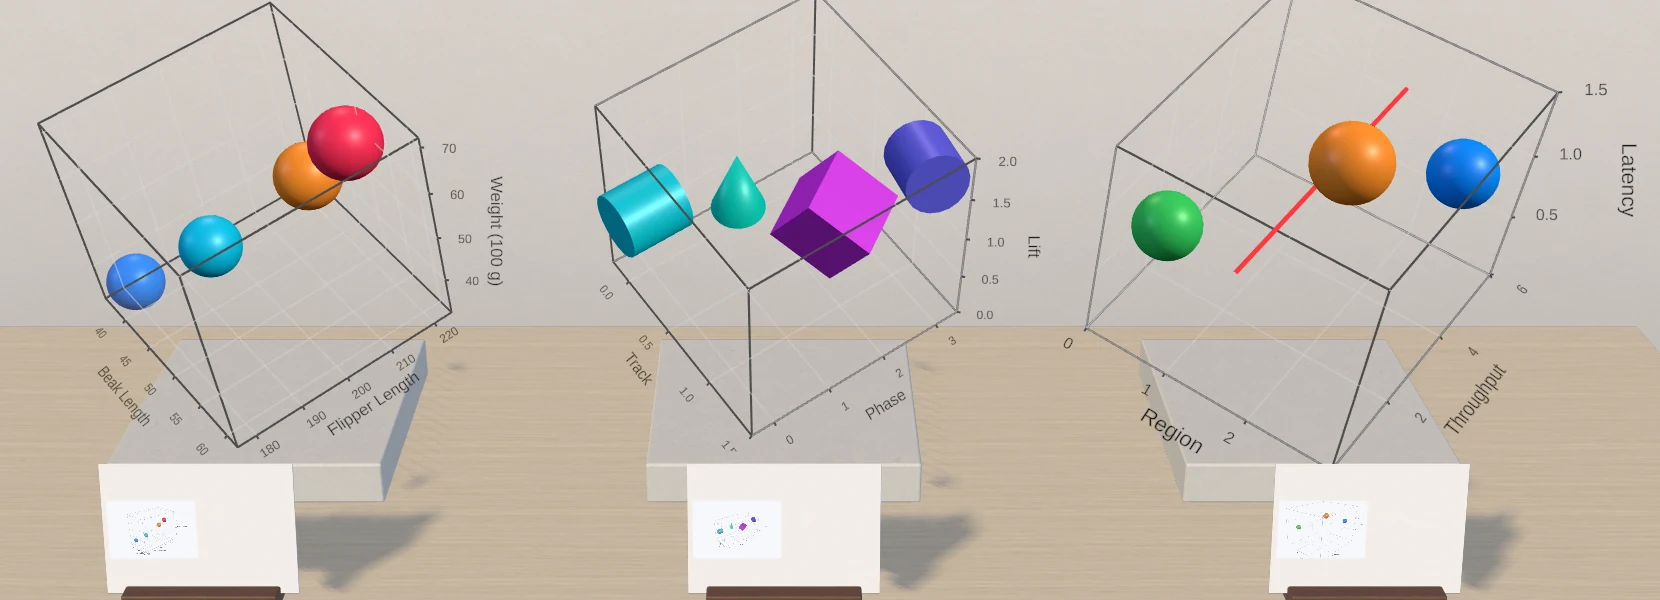
Chart3D { ... } declaration, select a 3D chart in Unity and click Paste Swift Charts. Chart Guru 3D builds a saved chart definition from the marks, data, modifiers, pose and projection, lists anything it skipped or read differently, and can copy the chart back out as Swift or as C#.What Chart3D is
Apple introduced Swift Charts 3D at WWDC25 with iOS 26, macOS 26 and visionOS 26. Its Chart3D container gives PointMark, RuleMark and RectangleMark a z value and adds SurfacePlot for surfaces y = f(x, z). A pose of azimuth and inclination with seven presets, an orthographic, perspective or automatic camera projection, and height-based or normal-based surface styles complete the set. Chart Guru 3D implements the same concepts in Unity, with the same names in PascalCase C#.
Import in four steps
- Copy the
Chart3D { ... }declaration, including the data arrays and functions it uses. - Select a 3D chart and click Paste Swift Charts under Export on the Output tab, or on the Data tab while the chart shows preview data. In the Chart Designer’s 3D mode, use Paste Swift in the code panel.
- Read the report of what the import skipped or changed, and fix those parts in the Inspector.
- Compare the chart with the native render at the same pose and projection.
The import replaces the host’s inline definition as one Undo step and stops using an assigned chart asset. Any 3D host can receive it: a Chart 3D in the scene, or a Chart 3D Image, Chart 3D Texture or Chart3DElement with its own content.
An example from the sample corpus
This is one of the 27 Swift files that ship with the Swift Charts 3D Import scene, shortened to the function and the chart:
private let sinc: @Sendable (Double, Double) -> Double = { x, z in    let radius = sqrt(x * x + z * z)    return radius < 0.0001 ? 1.0 : sin(radius * 3.0) / (radius * 3.0)}
Chart3D {    SurfacePlot(x: "X", y: "Amplitude", z: "Z", function: sinc)        .foregroundStyle(.heightBased(yRange: -0.35...1.0))}.chartXScale(domain: -3...3).chartYScale(domain: -0.4...1.1).chartZScale(domain: -3...3).chart3DPose(Chart3DPose(azimuth: .degrees(44), inclination: .degrees(31))).chart3DCameraProjection(.perspective)
Every line has a counterpart. The declared sinc closure stays within the expression subset, with let, sqrt, sin and a ternary, so it imports into the layer’s surface function as one line of Swift and evaluates at runtime, IL2CPP included, without the editor. .heightBased(yRange:) becomes a height-based style whose colors span -0.35 to 1.0 without clipping the geometry. The scales become X, Y and Z domains, the pose becomes azimuth 44 and inclination 31, and the projection becomes perspective.
What the import reads
| Swift Charts 3D | Imports as |
|---|---|
PointMark(x:y:z:) | A point layer (PointMark3D in C#) with sizes, colors, symbols, rotations, roughness and metalness |
RuleMark, one range at two values | A rule layer (RuleMark3D) with its range |
RectangleMark, two ranges at one value | A plane layer (RectangleMark3D) with its ranges |
SurfacePlot | A surface layer (SurfacePlotMark) with its function, style, gradient and height range |
ForEach, Chart3D(data), Chart3D(data, id:) | One mark per element of an array the source declares |
if and else on a Boolean constant | The branch the constant chooses |
.chart3DPose, .chart3DCameraProjection | Presets, degrees, radians and $pose bindings to declared state; all three projections |
.chartXScale, .chartYScale, .chartZScale | Domains, ranges and types, including log scales and dates written as Date(timeIntervalSince1970:) |
AxisMarks(values:), .chartZAxis(.hidden), axis labels | Axis values, hidden axes and axis titles |
.foregroundStyle(by:), .chartForegroundStyleScale | A keyed color column and its colors |
Surface closures can be trailing, inline or shorthand, or name a closure or function the source declares. They may use number literals, their two parameters, arithmetic, comparisons, &&, ||, !, ternaries, let bindings, .pi, .nan, .infinity, and sin, cos, tan, asin, acos, atan, atan2, exp, log, log10, sqrt, pow, abs, min, max, floor and ceil.
What it reports instead of guessing
The import names each construct it skips or reads differently, with its position, so nothing changes silently:
- Marks outside Apple’s
Chart3DAPI, such as a made-upBarMark3DorScatterMark3D, and 2D marks fail with errors. Rebuild those parts with Chart Guru’s own 3D marks after the import. - Modifiers outside the API, such as
.chartTypeor.cornerRadius, are ignored with warnings. - Content that needs runtime state, such as
if let, is left out with a warning, and chart modifiers without a reader are reported once per name, including the visionOS modifier.chart3DRenderingStyle. .chartZSelectionis noted, because a Swift binding has no counterpart in a saved definition; C# reads the selection throughChart.OnZSelectionChanged.
Importer details that matter for parity
- Sphere sizes. Swift Charts 3D sizes a sphere by its radius and Chart Guru by its diameter, as in its 2D charts, so the import doubles a sphere’s
symbolSizeand the export halves it. Unsized points draw at 0.03 of the plot, the Chart3D default. Do not copy Swift sizes into C# by hand. - The first scale modifier wins. As natively, the first
.chartXScale,.chartYScaleor.chartZScalefor an axis applies as a whole, so put its domain, range and type into that one call. Chart Guru’s own C# scale setters compose independently. - Ranges are plot units. Explicit scale ranges use the plot units of Swift Charts, in which the automatic range spans -0.5 to 0.5, so they scale with the host’s plot size.
- Function surface boundaries. Undefined boundaries are refined and closed with walls to the Y domain, as natively:
NaNand negative infinity reach the lower bound, positive infinity the upper bound, and undefined interiors stay empty..Boundary(SurfaceBoundaryMode.Open)gives an open surface without walls.
Differences kept on purpose
Native captures of the corpus on the iOS 27 simulator show where Chart3D and Chart Guru differ. Chart Guru keeps these differences deliberately:
| Native Swift Charts 3D | Chart Guru 3D |
|---|---|
Ignores chartForegroundStyleScale and draws keyed marks in default colors | Applies the scale; the import notes the difference |
| Labels a log scale in decades but places marks linearly | Draws a logarithmic scale |
Stops with an assertion failure for a RuleMark without a range | Imports the rule with a warning |
Stops for a RectangleMark with ranges on all three axes | Rejects the box with an error; boxes are a Chart Guru extension |
Not matched yet: animated pose changes and the highlight and range form of chartZSelection.
Export back to Swift or C#
Copy Swift, on the Output tab, on 3D Gallery cards and in the Designer’s code panel, writes Chart3D { ... } with one mark per data row, Swift defaults left out and half-open ranges with the lower bound first. It then reads its own code back and lists every setting that does not return. Chart Guru extensions, such as 3D bars, lines, areas, pies and radars, boxes spanning three axes, diagonal rules and rules without a range, are reported instead of written. A gallery template earns the Swift Charts badge only when the export keeps everything that matters for its marks and data.
Copy C# writes Chart3D.Create() builder code from the definition, with surface functions as Mathf lambdas. Show its chart with host.SetChart(MyChart.Build()). The definition stays the editable source of truth; generated code is a snapshot.
The Swift Charts 3D Import sample
The Swift Charts 3D Import scene shows three samples of the corpus at a time. Each live chart is imported from its Swift source and saved with the scene, and the paper card in front of it holds the native Swift Charts 3D render, kept at its original dimensions with uncompressed colors so import settings do not distort the comparison. The Inspector pages through all 27 files, imports the shown samples again and copies a sample’s Swift or the C# the importer writes.
The corpus covers every mark, both surface style families, symbols, rotation, materials, every pose form and projection, axis marks, hidden axes, keyed styles, Z selection, log scales, closure and declared-function surfaces, data initializers, ForEach and conditionals. Even its bar, line, area, pie and donut samples are pure Chart3D: bars as RectangleMark planes, lines as RuleMark segments, and areas, pies and donuts as SurfacePlot functions. Unity tests check that every sample imports, compiles, generates C# and survives a Swift export and import with an equal definition. Copy a sample before you edit it, so the scene keeps comparing against its native renders.
Limits
- The import reads chart code, not apps. Data that your app computes at runtime cannot be evaluated from source text, and the import reports it instead of inventing values.
- Text rasterization and material highlights are engine-specific, so text and specular highlights will not match pixel for pixel.
- The visionOS rendering style modifier is not supported.
The 2D workflow is the same: see pasting Swift Charts code into Unity. Chart Guru 3D is included with Chart Guru, and the import comes with it: Chart Guru on the Unity Asset Store.
Frequently asked questions
Does the import run Swift or need a Mac?
No. The importer reads Swift source text inside the Unity Editor; it never runs Swift or opens Xcode projects. The parser is an editor tool, and players use the saved chart definition or the generated C#, so nothing from Swift ships in a build.
Will the imported chart look exactly like the native render?
Data, pose, projection and scale semantics are the target, and the sample scene shows each import beside its native render. Text rasterization and material highlights differ between engines, and a few behaviors differ on purpose, such as Chart Guru applying chartForegroundStyleScale, which native Chart3D ignores.