How to make a line graph in Unity
Draw a line graph in Unity with LineRenderer, a custom UI mesh, UI Toolkit Painter2D or Chart Guru, with working code and a comparison of axes, interaction and live data.
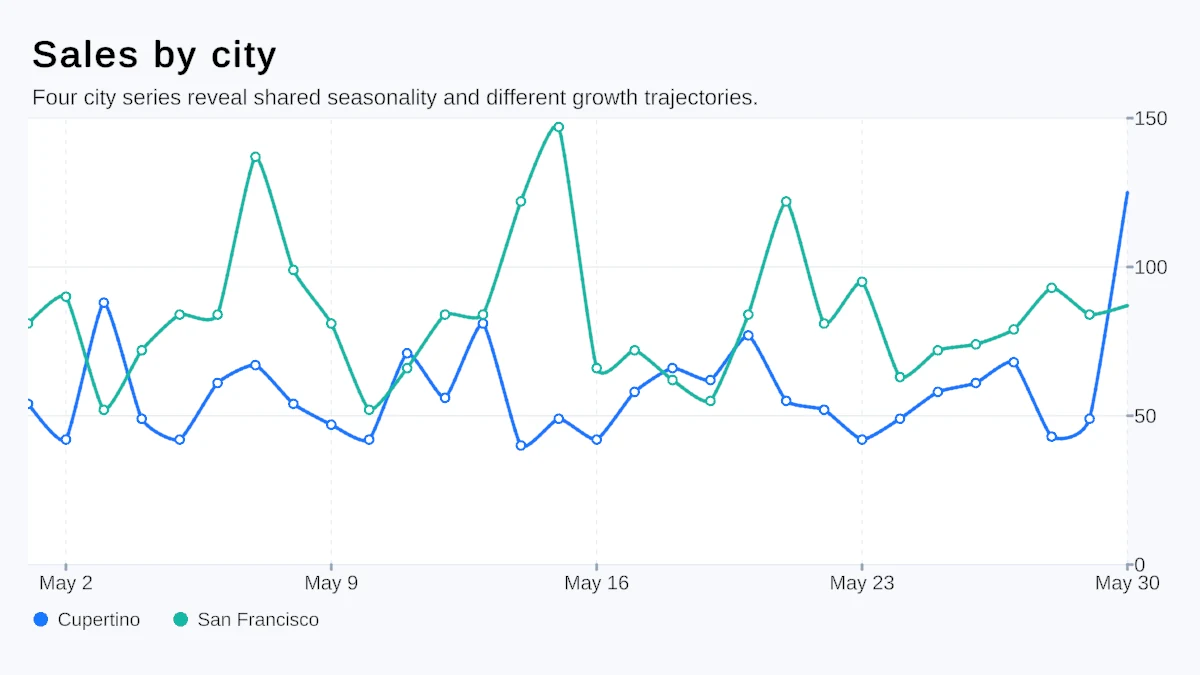
Unity ships no line chart. There is no chart element in UI Toolkit and no chart component in uGUI, so every line graph in a Unity project is either drawn by hand or comes from a library. This article walks through four approaches with code you can paste into a project: a LineRenderer in world space, a custom uGUI mesh or the free UILineRenderer, UI Toolkit’s Painter2D, and Chart Guru. A comparison table at the end sums up what each one gives you, and when hand-rolled code is the better choice.
Line graphs, node graphs and function plots
Search for a graph in a Unity context and you mostly find node editors. Shader Graph, VFX Graph and Graph Toolkit, Unity’s framework for building node-based editor tools, are graphs in the computer science sense: nodes and connections that describe logic. They do not plot data.
Function plots are closer, but they do a different job. Catlike Coding’s well-known Building a Graph tutorial, for example, places cubes along a mathematical function to visualize the math itself, without axes, ticks or labels.
A line graph, or line chart, shows measured values along an ordered axis: revenue per month, frame time per frame, pressure per second. It needs a value axis with readable ticks and labels, often several series with a legend, and in an app usually hover tooltips and live updates. That is what this article is about.
1. LineRenderer in world space
LineRenderer is Unity’s built-in component for drawing a line through points in 3D space. For a graph that lives in the scene, such as a readout floating above a machine, it is the quickest start:
using UnityEngine;
[RequireComponent(typeof(LineRenderer))]public class WorldLineGraph : MonoBehaviour{    [SerializeField] float[] values = { 3f, 7f, 5f, 9f, 6f, 11f };    [SerializeField] Vector2 size = new Vector2(4f, 2f); // width and height in world units
    void Start()    {        LineRenderer line = GetComponent<LineRenderer>();        line.useWorldSpace = false; // points move with this transform        line.widthMultiplier = 0.05f;
        float max = Mathf.Max(values);        Vector3[] points = new Vector3[values.Length];        for (int i = 0; i < values.Length; i++)            points[i] = new Vector3(size.x * i / (values.Length - 1), size.y * values[i] / max, 0f);
        line.positionCount = points.Length;        line.SetPositions(points);    }}
The trouble starts when the graph belongs in your UI. A LineRenderer is drawn by a camera in world units, while a Screen Space Overlay Canvas is drawn on top of everything after the cameras have rendered. The line cannot sit between two UI elements, does not follow RectTransform anchors or layout groups, and ignores Mask and RectMask2D. On a Screen Space Camera or World Space Canvas you can place it in front of the UI, but you manage sorting and the conversion between pixels and world units yourself. Third-party drawing assets can share the limitation: the Shapes asset, for example, states on its store page that it has no UI support in overlay mode (checked November 2026).
2. A custom UI mesh, or UILineRenderer
For a line inside a Canvas, the common answer is a Graphic that builds its own mesh. Derive from MaskableGraphic, override OnPopulateMesh and emit one quad per segment:
using UnityEngine;using UnityEngine.UI;
public class UILineGraph : MaskableGraphic{    [SerializeField] float[] values = { 3f, 7f, 5f, 9f, 6f, 11f };    [SerializeField] float thickness = 3f;
    public void SetValues(float[] newValues)    {        values = newValues;        SetVerticesDirty(); // rebuild the mesh on the next Canvas update    }
    protected override void OnPopulateMesh(VertexHelper vh)    {        vh.Clear();        if (values == null || values.Length < 2) return;
        Rect r = rectTransform.rect;        float max = Mathf.Max(values);        for (int i = 0; i < values.Length - 1; i++)        {            Vector2 a = Point(r, i, max), b = Point(r, i + 1, max);            Vector2 n = new Vector2(a.y - b.y, b.x - a.x).normalized * (thickness * 0.5f);
            int v = vh.currentVertCount;            vh.AddVert(a - n, color, Vector4.zero);            vh.AddVert(a + n, color, Vector4.zero);            vh.AddVert(b + n, color, Vector4.zero);            vh.AddVert(b - n, color, Vector4.zero);            vh.AddTriangle(v, v + 1, v + 2);            vh.AddTriangle(v + 2, v + 3, v);        }    }
    Vector2 Point(Rect r, int i, float max) =>        new Vector2(r.xMin + r.width * i / (values.Length - 1), r.yMin + r.height * values[i] / max);}
This works in every Canvas mode, including Screen Space Overlay, follows its RectTransform and respects masks. Call SetValues with new data and the mesh rebuilds on the next Canvas update. It also shows where the work grows: separate quads leave notches at the joints, so smooth joins, caps and clean edges need more geometry.
If you would rather not write mesh code, the free Unity UI Extensions package (BSD-3-Clause) includes UILineRenderer with bevel or miter joins and optional Bezier smoothing. Version 3.0 targets Unity 6, and Unity 2022 projects stay on 2.3.2 (checked November 2026). With RelativeSize on, points from (0, 0) to (1, 1) span the RectTransform:
// line is a UILineRenderer (namespace UnityEngine.UI.Extensions)line.RelativeSize = true; // (0, 0) is the bottom left of the rect, (1, 1) the top rightline.LineThickness = 3f;line.Points = new[]{ new Vector2(0f, 0.27f), new Vector2(0.2f, 0.64f), new Vector2(0.4f, 0.45f), new Vector2(0.6f, 0.82f), new Vector2(0.8f, 0.55f), new Vector2(1f, 1f)};3. Painter2D in UI Toolkit
Since Unity 2022.1, UI Toolkit has a vector drawing API. A VisualElement registers a generateVisualContent callback and draws paths with Painter2D, with configurable line width, joins and caps:
using UnityEngine;using UnityEngine.UIElements;
public class LineGraphElement : VisualElement{    float[] m_Values = { 3f, 7f, 5f, 9f, 6f, 11f };
    public LineGraphElement()    {        generateVisualContent += Draw;    }
    public void SetValues(float[] values)    {        m_Values = values;        MarkDirtyRepaint(); // generateVisualContent runs again    }
    void Draw(MeshGenerationContext ctx)    {        if (m_Values == null || m_Values.Length < 2) return;        Rect r = contentRect;        float max = Mathf.Max(m_Values);
        Painter2D painter = ctx.painter2D;        painter.strokeColor = new Color(0.16f, 0.5f, 0.92f);        painter.lineWidth = 2f;        painter.lineJoin = LineJoin.Round;        painter.BeginPath();        for (int i = 0; i < m_Values.Length; i++)        {            // UI Toolkit's y axis points down, so larger values get a smaller y            var p = new Vector2(r.xMin + r.width * i / (m_Values.Length - 1), r.yMax - r.height * m_Values[i] / max);            if (i == 0) painter.MoveTo(p); else painter.LineTo(p);        }        painter.Stroke();    }}
Give the element a size, for example style.flexGrow = 1 or a height in USS, and add it to a UIDocument’s root or to an editor window; the same element works in both. Unity’s manual documents Painter2D and has a pie chart tutorial, but there is no line chart control, so axes, labels and hover handling are yours to add: labels as Label children positioned in the same coordinate space, interaction through pointer events and your own hit math.
What the hand-rolled versions leave out
All three approaches draw a line. None of them draws a chart yet. Before a graph is ready to ship, most projects add:
- A value axis with readable ticks, such as 0, 5, 10 instead of 0, 3.7, 7.4, and a range that follows the data.
- Axis labels that do not collide when the panel shrinks, and dates printed sensibly on time axes.
- Several series with consistent colors and a legend.
- Hover tooltips, selection and scrolling through a long series.
- Updates at frame rate without allocating garbage every frame.
- A text description for people who cannot see the chart.
Each item is a small project. Together they are the reason chart libraries exist.
4. Chart Guru
Chart Guru draws charts in a uGUI Canvas through ChartGraphic, in every Canvas mode including Screen Space Overlay, in UI Toolkit through ChartGuruElement, and on world-space Canvases. Its API follows Apple’s Swift Charts: you add marks built from plottable values and configure the chart with modifiers. This is a complete line chart with axis titles, formatted ticks and tooltips that pin on click:
using ChartGuru;using UnityEngine;
public sealed class RevenueLineChart : MonoBehaviour{    [SerializeField] private ChartGraphic _graphic;
    private static readonly string[] Months = { "Jan", "Feb", "Mar", "Apr", "May", "Jun" };    private static readonly float[] Revenue = { 42f, 48f, 45f, 53f, 58f, 61f };
    private void Start()    {        ChartBuilder builder = Chart.Create()            .ChartTitle("Monthly revenue")            .ChartXAxis(axis => axis.Label("Month"))            .ChartYAxis(axis => axis.Label("Revenue").TickFormat(value => "$" + value.ToString("0") + "k"))            .ChartTooltip(ChartTooltipPreset.Automatic)            .ChartTooltipInteraction(ChartTooltipInteraction.HoverAndPin);
        for (int i = 0; i < Revenue.Length; i++)            builder.Add(new LineMark(i, Revenue[i]) { CategoryLabel = Months[i] });
        _graphic.SetChart(builder.Build());    }}
Nice tick values and label collision handling come from the chart’s defaults, and a second series styled through ForegroundStyle with PlottableValue.Value("Series", "Forecast") gets its own color and a legend entry without further setup. You can also build the same chart without code: GameObject > UI > Chart Guru > Line Chart adds a Canvas chart, and its Inspector edits data, marks, axes, labels, style, behavior and output in tabs with a live preview. In UI Toolkit, one UXML element is enough:
<UXML xmlns="UnityEngine.UIElements" xmlns:cg="ChartGuru"> <cg:ChartGuruElement name="sales-chart" chart-type="Line" style="flex-grow: 1;" /></UXML>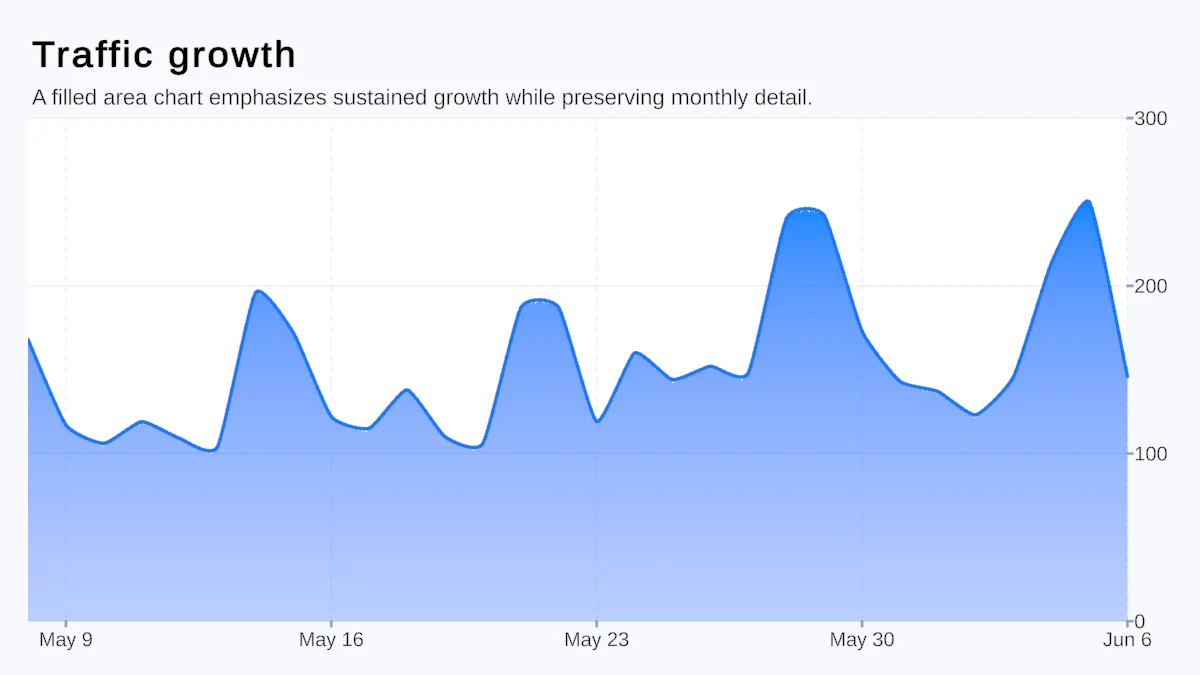 A smooth line with a gradient area fill, rendered by Chart Guru.
Lines support linear, monotone, Catmull-Rom, cardinal, natural and three step interpolations, plus point symbols, gradients and area fills. For live data, call chart.SetValues(values) while the number of points stays the same, or let a saved chart read from a RingBufferChartDataSource:
// On a Line chart created from the GameObject menuRingBufferChartDataSource buffer = gameObject.AddComponent<RingBufferChartDataSource>();buffer.Capacity = 300;buffer.SeriesName = "Frame time (ms)";
// In Update, or from any thread with your own valuesbuffer.Push(Time.unscaledDeltaTime * 1000f);
Push is thread-safe, the buffer publishes at most once per frame, and once it is full it updates the chart in place without allocating. For long series, ChartScrollableAxes set to ScrollableAxes.Horizontal, together with ChartXVisibleDomain(length), shows a window that users drag through. The article on real-time graph performance goes deeper.
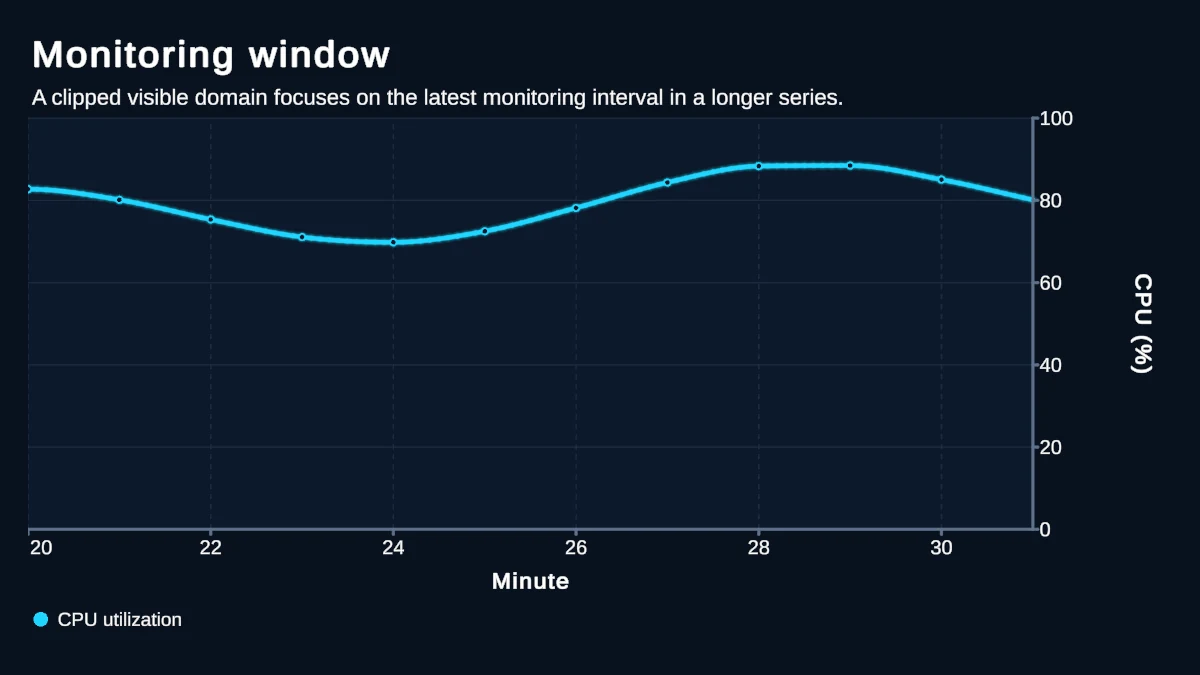 A visible domain shows one window of a longer series; users scroll to see the rest.
If you already have Swift Charts code from an iOS or macOS app, paste it into the Chart Designer or a chart Inspector to get the same chart and generated C#. The Swift paste use case shows the workflow.
Comparison
| LineRenderer | Custom mesh or UILineRenderer | Painter2D | Chart Guru | |
|---|---|---|---|---|
| Effort for one line | A few lines of code | A screen of code, or a free package | A screen of code | A few lines, or none in the Inspector |
| Axes, ticks and labels | Build them yourself | Build them yourself | Build them yourself | Built in, including time and log axes |
| Interaction | Your own raycasts and math | Your own pointer events and math | Your own pointer events and math | Tooltips, selection, zoom, scrolling, brushing |
| Live updates | SetPositions per change | Mesh rebuild after SetVerticesDirty | Full redraw after MarkDirtyRepaint | In-place updates, ring buffer, data sources |
| UI systems | World space; Canvas only with workarounds | uGUI, every Canvas mode | UI Toolkit, runtime and editor | uGUI, UI Toolkit, world space, plus 3D |
| Cost | Built in | Free | Built in | US$29 (November 2026) |
When hand-rolled code is the right call
A chart library is not always worth it. If your graph is one simple line, such as a health trend in a HUD, a debug value over the last few seconds or a decorative curve in a menu, the code above is enough and you avoid a dependency. Painter2D is a good default in UI Toolkit, and a custom Graphic or UILineRenderer in uGUI. If all you need is a frame rate graph, the free Graphy asset already draws one.
The balance tips once the graph needs axes people actually read, more than one series, tooltips, a scrolling window, or data from a file or a server. Each of those is a small project in the hand-rolled versions and a modifier or an Inspector field in a library. Chart Guru costs US$29 on the Asset Store (November 2026), runs in Unity 2022.3 or newer with the Built-in Render Pipeline, URP and HDRP, and includes Chart Guru 3D and Mock Magic for generated test data.
Frequently asked questions
Does Unity have a built-in line chart?
No. As of November 2026, neither uGUI nor UI Toolkit includes a chart control. Unity's manual has a tutorial that draws a pie chart with the Painter2D vector API, and the Profiler's charts are internal editor code. Line graphs come from your own code or a chart library.
Can I use a LineRenderer on a Screen Space Overlay Canvas?
Not inside it. An overlay Canvas is drawn on top of everything after the cameras have rendered, while a LineRenderer is drawn by a camera in world units. Use a Graphic that builds its own mesh, the UILineRenderer from Unity UI Extensions, or a chart library such as Chart Guru, whose ChartGraphic works in every Canvas mode.
How do I draw a line graph in UI Toolkit?
Subclass VisualElement, register a generateVisualContent callback and draw the points with Painter2D's MoveTo, LineTo and Stroke, then call MarkDirtyRepaint when the data changes. Chart Guru's ChartGuruElement gives you a full chart with axes, labels and tooltips as one UXML element.
How do I update a Unity line graph in real time without stutter?
Keep the number of points fixed and write new values into existing storage instead of rebuilding objects or allocating new arrays. In Chart Guru, use SetValues on charts you build in code, or a RingBufferChartDataSource, which accepts samples from any thread, publishes once per frame and updates in place once full.
Easy, reliable charts for Unity, from sparklines to multi-series 3D.
Keep reading
 Article
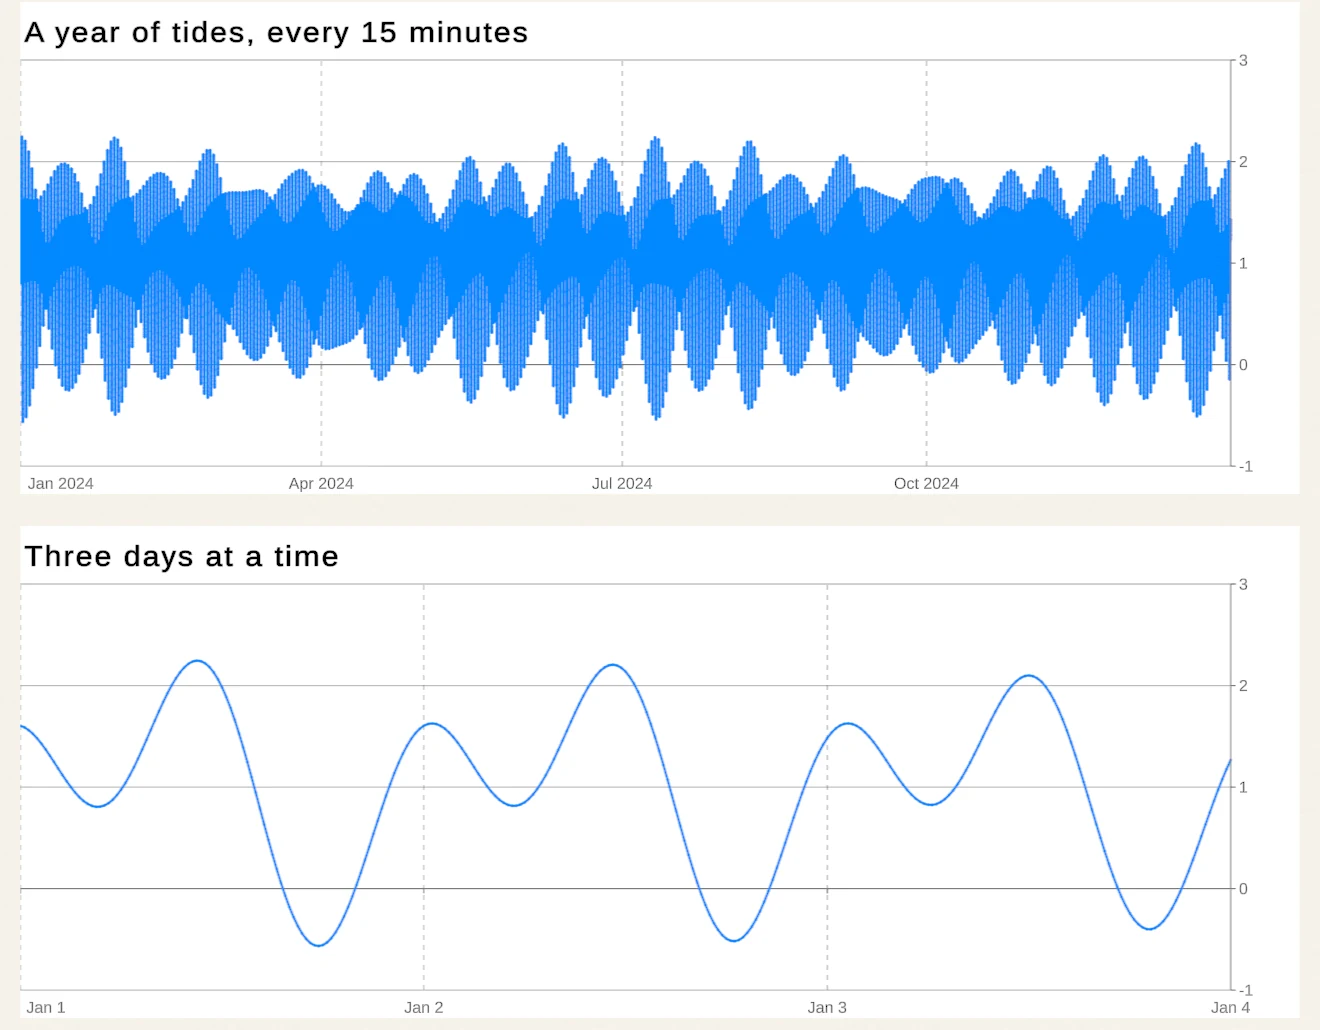
Real-time graphs in Unity without GC spikes
Texture redraws, per-point objects and per-frame allocations make live graphs stutter. How Chart Guru for Unity streams data through a thread-safe ring buffer and in-place updates, what its performance guidance recommends, and what a 35,136-point lesson shows. Use case
Charts in UI Toolkit and UI Builder
Unity ships no chart control for UI Toolkit, only a Painter2D pie chart tutorial. Chart Guru adds ChartGuruElement for UXML, UI Builder, runtime panels and editor windows, with data binding, tooltips and live updates. Use case