Is Unity good for data visualization?
An honest look at Unity for data visualization: where a game engine beats BI tools, web chart libraries and notebooks, where it does not, and what charts in Unity need.
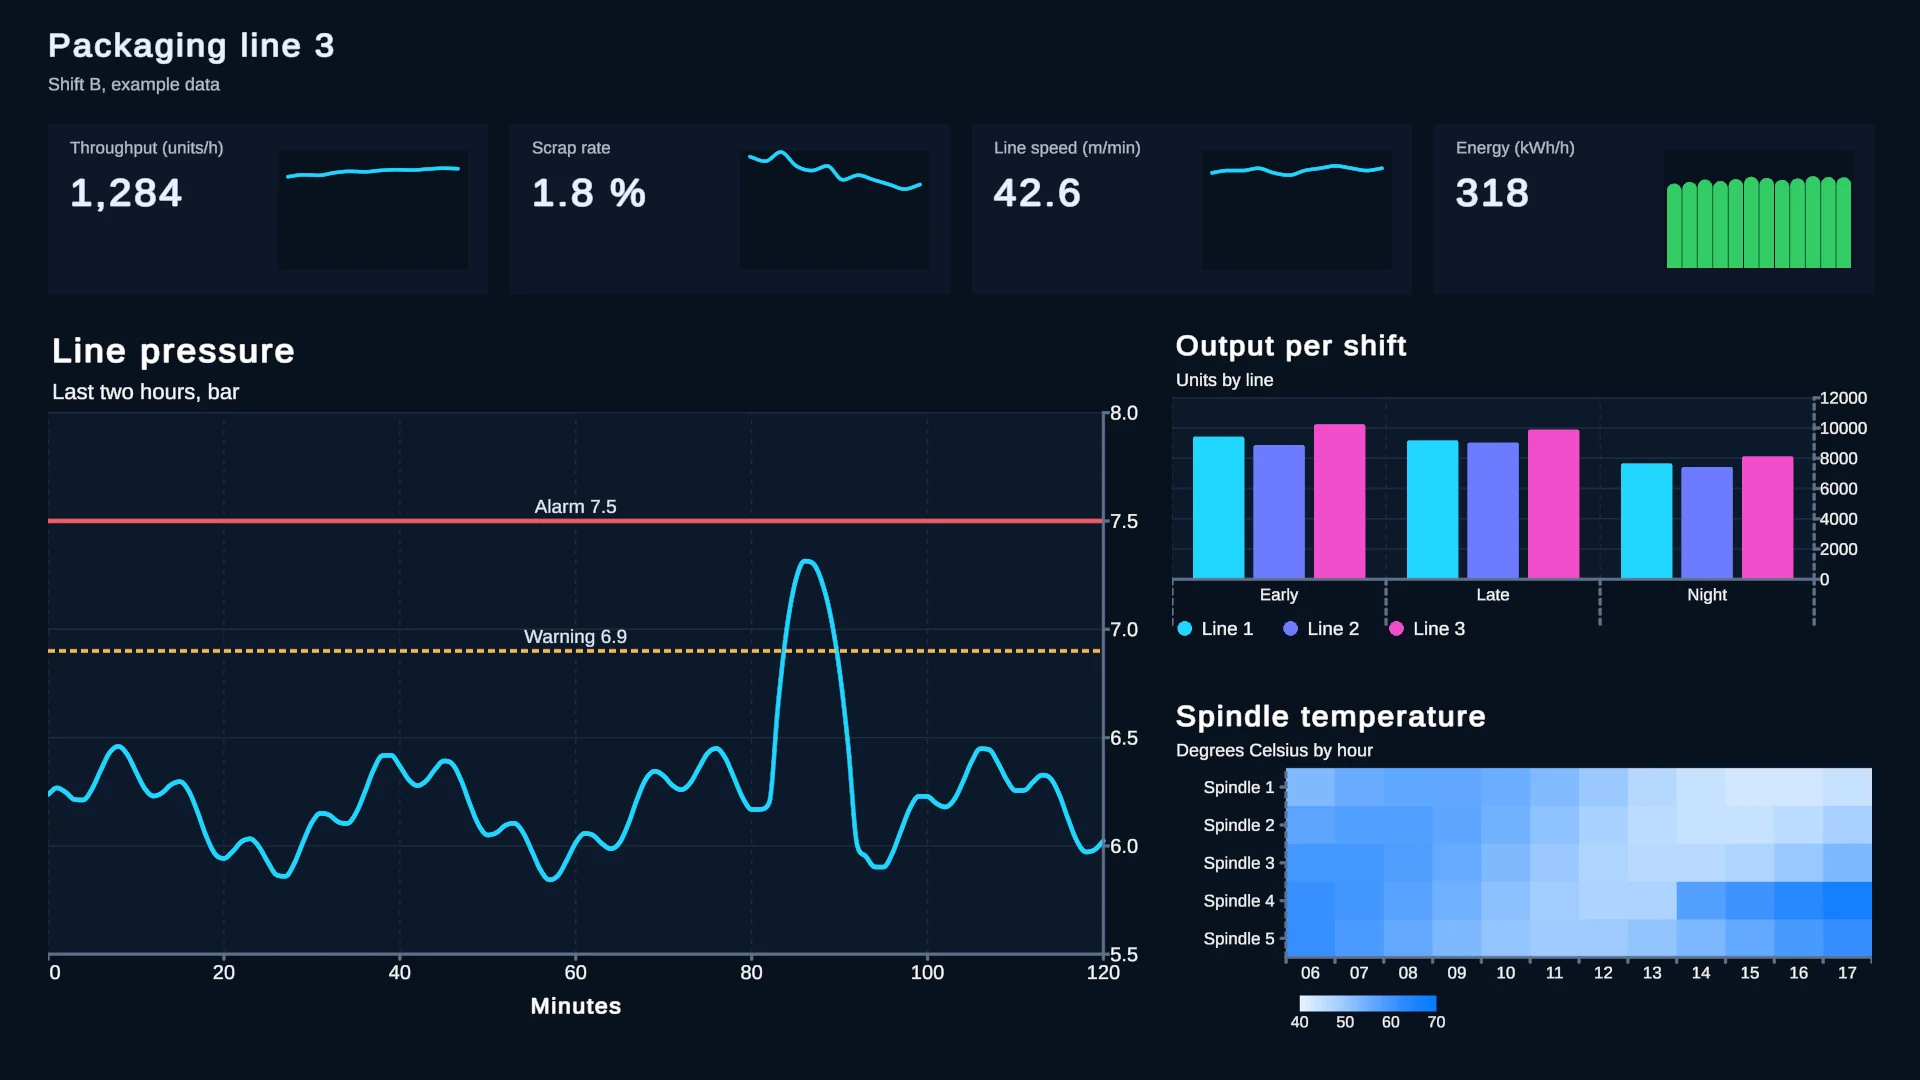
Asking whether Unity is good for data visualization is like asking whether a truck is good for transport: it depends on what you move. Data visualization covers very different jobs, such as a monthly report for management, a web dashboard for customers, an exploratory analysis of a messy dataset, a trend chart on the control screen of a machine and a debrief chart inside a VR training app. Unity is excellent at some of these and the wrong tool for others. This article sorts them honestly, then covers what you need when Unity is the right choice.
Where Unity is a strong fit
Data that lives in a 3D context
Charts are most useful next to the thing they measure. In a digital twin, a trend chart belongs on the machine whose temperature it plots; in a simulation, a population chart belongs beside the world that produces it; in a game, harvest numbers belong on the field. Unity places a chart in the scene like any other object, and it renders, lights and navigates 3D data itself: terrain, point clouds and surfaces that people orbit and select.
Real-time interaction
Unity is built to update at frame rate. Sensor streams, simulation output, telemetry and market feeds can drive charts every frame, and interactions such as hovering, selecting, zooming and linking a chart to a 3D view live in the same app instead of a separate tool.
One app on many platforms
Unity builds for desktop, mobile, consoles, the web and XR headsets from one project. When a visualization is part of an app that has to run on a tablet in a factory hall, on a headset in a training center and on a desktop in the office, one Unity project covers all three. A Unity app also draws its charts without a server, so offline use comes naturally.
Where other tools are the better choice
Reports and business intelligence
If the output is a report that managers read, use a business intelligence tool such as Power BI, Tableau or Looker Studio. These tools connect to databases and warehouses, refresh on a schedule, handle sharing and permissions, and let analysts build new views without a developer. Rebuilding that in Unity is a lot of work for no gain.
Web dashboards
If the dashboard lives on a website or an intranet, build it with a web chart library such as Chart.js, Apache ECharts, D3 or Plotly. They are free, open source and familiar to web developers. A Unity web build carries the engine runtime, which is a heavy download for a page that only shows charts.
Heavy tabular analysis
Cleaning, joining and exploring large tables belongs in a notebook or an analysis environment: Python with pandas in Jupyter, R, or a SQL client. Unity is not an analysis tool. Chart Guru’s data frames can filter, sort, aggregate and facet the data an app presents, but they do not replace an analysis stack.
A hybrid: web charts inside Unity
If you already have web dashboards and need them inside a Unity app, a WebView asset can render web pages into Unity. Vuplex 3D WebView, for example, lists US$179.99 per platform package on the Asset Store (checked November 2026). The trade-offs are a browser engine in your build, a page that renders into a texture rather than into Unity’s own UI, and input that goes through the web view.
What you need to build it in Unity
Charts, because Unity has none
As of November 2026, Unity has no public chart control. The UI Toolkit element reference lists no chart, graph or plot element, uGUI has none either, the manual’s pie chart is a tutorial rather than a component, and the charts in Unity’s Profiler window are internal editor code. You either draw charts yourself, as shown in the articles on line graphs and pie charts, or use a library.
Data plumbing
Unity gives you UnityWebRequest and JSON parsing; everything between a file or an endpoint and a chart is up to you. Real data brings decimal commas, thousands separators, placeholders such as N/A, time zones and partial failures. Whatever draws your charts should parse those predictably, refresh without blocking the frame and keep credentials out of saved assets.
Accessibility
In a 2023 Unity forum discussion about building an entire business app in Unity, the concerns included weak accessibility, battery drain from constant redraws and immature UI Toolkit charts, and most replies recommended native or web UI. Charts are a hard case for accessibility: a picture of a line tells a screen reader nothing. You need a text description, a way to move through the data points and an alternative such as an audio graph or a data export. The article on accessible charts covers the details.
Performance and power
Games redraw continuously, which drains batteries on mobile devices and is wasteful for a dashboard that changes once a second. Unity can render less often with OnDemandRendering.renderFrameInterval or a lower Application.targetFrameRate while it keeps processing input. Charts should also update without allocating memory every frame, so that the garbage collector does not cause hitches; the article on real-time graph performance explains how.
Where Chart Guru fits in
Chart Guru covers the chart side of that list in Unity 2022.3 or newer, with the Built-in Render Pipeline, URP and HDRP:
- Charts in every Unity UI: uGUI Canvases in any mode, UI Toolkit documents built in UXML and UI Builder, world-space Canvases, editor windows and custom inspectors, plus 3D charts through the included Chart Guru 3D module. Its 28 chart types range from label-free sparklines and indicators to multi-series dashboards, candlesticks and surface plots.
- Data sources for CSV, JSON, Google Sheets, HTTP endpoints and Yahoo Finance candles, a thread-safe ring buffer for pushed samples, and generated test data from the included Mock Magic. CSV parsing has a Number Culture setting, handles thousands separators, decimal commas and NA placeholders, and reads dates without a time zone as UTC. Web sources poll with backoff, cancel cleanly and keep runtime credential headers out of saved assets.
- Accessibility: chart descriptions, accessible navigation, Unity 6 native accessibility support, audio graphs and semantic CSV and JSON export.
- Performance: steady updates are tested not to allocate managed memory after warm-up, and chart meshes support Single Pass Instanced XR rendering.
The use cases show concrete setups:
- Charts for digital twins and HMIs: trend lines, threshold rules and KPI indicators for operations screens.
- VR and world-space charts: charts on objects in the scene that receive pointer events without colliders.
- Real-time graphs for sensor, telemetry and simulation streams.
- CSV, JSON and Google Sheets for charts that follow files and shared sheets.
- UI Toolkit charts for app-style dashboards, game stats screens for players and editor window charts for tools.
- In 3D: surface plots, 3D scatter plots and charts in a game world.
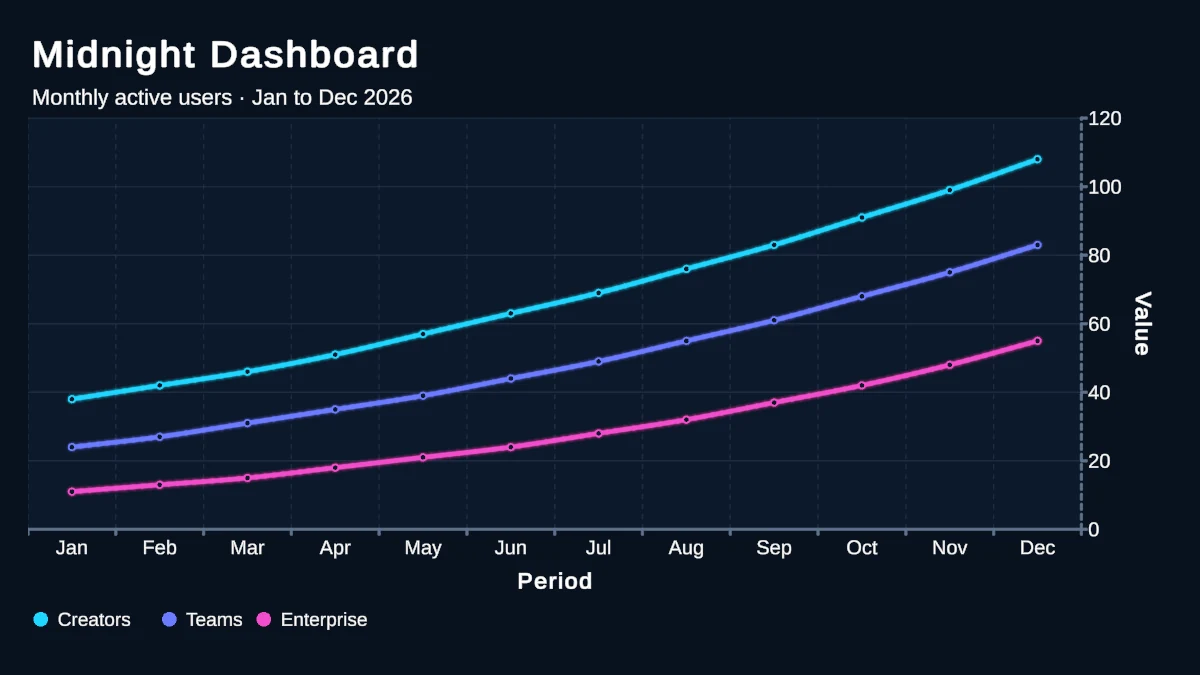 One dataset in a dark dashboard theme; themes are reusable assets that every chart can share.
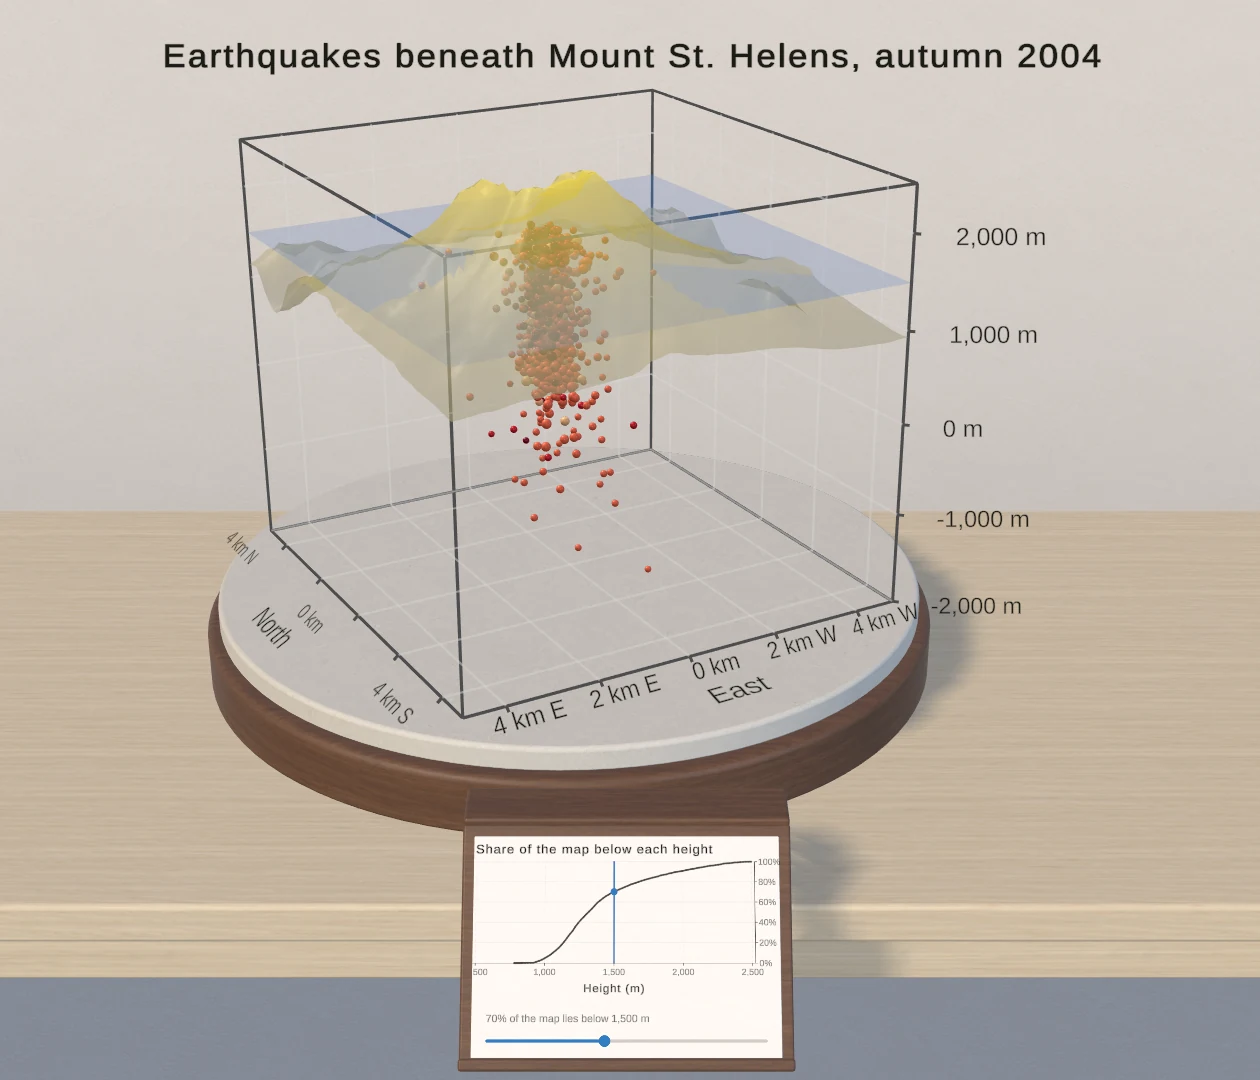 The Terrain Survey sample combines a terrain surface, earthquake points and a movable level, with a card that plots how much of the map lies below the level.
A quick decision guide
| Your job | Better fit |
|---|---|
| A monthly KPI report for management | A BI tool |
| A public or intranet dashboard in a browser | A web chart library |
| Exploring and cleaning a large dataset | A notebook or analysis environment |
| Trend charts on a digital twin or an HMI screen | Unity |
| Charts inside a game, a simulation or an XR app | Unity |
| Live 3D views of spatial or scientific data | Unity |
| An existing web dashboard inside a Unity app | Unity with a WebView asset |
If your job sits in the lower half of the table, the Chart Guru product page and the gallery show what the charts look like in practice. Chart Guru costs US$29 on the Asset Store (November 2026) and includes Chart Guru 3D.
Frequently asked questions
Does Unity have built-in charts?
No. As of November 2026, neither uGUI nor UI Toolkit includes a chart control. Unity's manual has a tutorial that draws a pie chart with the Painter2D vector API, and the Profiler's charts are internal editor code. Charts come from your own code or from a library.
Is Unity good for 3D data visualization?
Yes, when the third dimension carries meaning, such as terrain, spatial sensor data or point clouds that people orbit and select. Unity renders, lights and navigates 3D scenes natively, and Chart Guru 3D adds surface plots, 3D scatter plots, bars, lines and pies that you can orbit, select and stream into.
Can a Unity app show live data from a server?
Yes. Unity can request web data with UnityWebRequest, and Chart Guru adds chart-ready sources for CSV, JSON, Google Sheets and HTTP endpoints with polling, cancellation and backoff, plus a thread-safe ring buffer for samples that your own connection code pushes.
Easy, reliable charts for Unity, from sparklines to multi-series 3D.
Keep reading
Use caseCharts for digital twins, HMIs and control rooms in Unity
Unity's industrial samples bind live values but draw no charts. Chart Guru adds trends with threshold rules, alarm and shift timelines, KPI sparklines, heat maps and world-space charts, fed by your own MQTT or OPC UA client.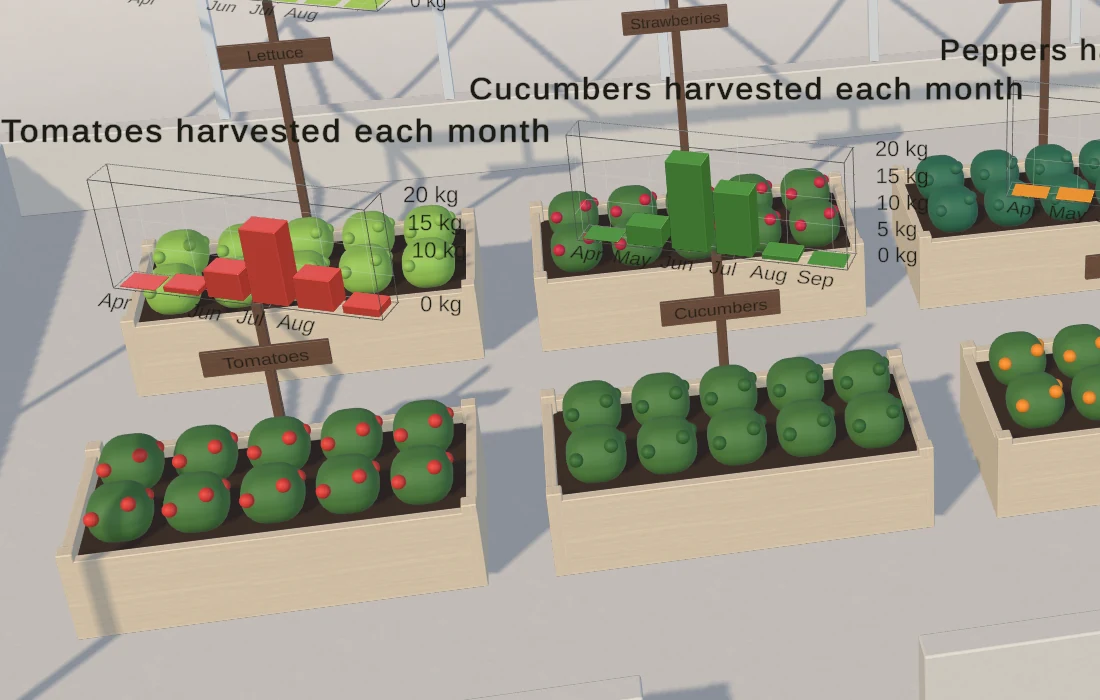 Use case