How to make a pie chart in Unity
Build a pie or donut chart in Unity with filled Images, UI Toolkit Painter2D arcs, a custom mesh or Chart Guru, with clickable slices, labels and leader lines.
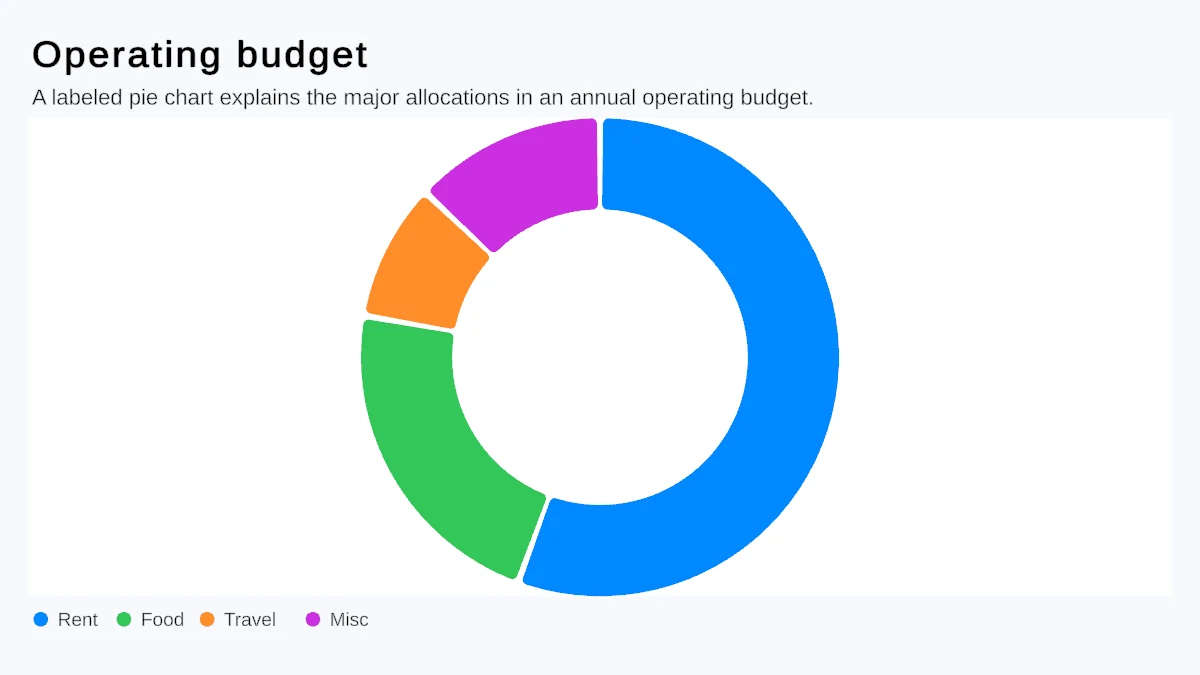
A pie chart is what people ask for when they want to show parts of a whole, and Unity does not ship one. Neither uGUI nor UI Toolkit has a chart control; the closest thing in Unity’s documentation is a manual page that draws a two-slice pie with UI Toolkit’s vector API. This article shows three ways to build a pie or donut chart yourself, with code for the parts that usually go wrong: start angles, the donut hole and clickable slices. Then it shows what Chart Guru does for you.
A donut is a pie with an inner radius, so every approach below covers both. One design rule applies to all of them: pies work best with a few slices and clear labels. With many categories, or values that are close to each other, a sorted bar chart is easier to read.
1. Filled Images in uGUI
The quickest uGUI pie uses one Image per slice. With the image type set to Filled and the Radial 360 fill method, fillAmount controls how much of the circle a slice covers. The catch is that every slice starts filling at the same origin, so you rotate each image to the angle where the previous slices end:
using UnityEngine;using UnityEngine.UI;
public class ImagePieChart : MonoBehaviour{    [SerializeField] Image slicePrefab; // circle sprite, anchors and pivot in the center    [SerializeField] float[] values = { 45f, 25f, 20f, 10f };    [SerializeField] Color[] colors = { Color.cyan, Color.yellow, Color.magenta, Color.green };
    void Start()    {        float total = 0f;        foreach (float v in values) total += v;
        float startAngle = 0f; // degrees, clockwise from 12 o'clock        for (int i = 0; i < values.Length; i++)        {            Image slice = Instantiate(slicePrefab, transform);            slice.type = Image.Type.Filled;            slice.fillMethod = Image.FillMethod.Radial360;            slice.fillOrigin = (int)Image.Origin360.Top;            slice.fillClockwise = true;            slice.fillAmount = values[i] / total;            slice.color = colors[i % colors.Length];            slice.raycastTarget = false;            // A negative Z rotation turns clockwise, so this slice starts where the last one ended            slice.rectTransform.localEulerAngles = new Vector3(0f, 0f, -startAngle);            startAngle += 360f * values[i] / total;        }    }}
The slice prefab needs a circle sprite, because a filled Image without a sprite draws a plain rectangle, and its anchors and pivot belong in the center so that the rotation turns it around the middle of the pie. For a donut, use a ring sprite or put a circle in the background color on top. Labels are TextMeshPro objects that you position yourself at each slice’s middle angle, and small slices need leader lines so that their labels do not overlap.
2. Painter2D arcs in UI Toolkit
Unity’s manual page “Create a pie chart in the Editor and runtime UI” draws its slices with Painter2D arcs in a generateVisualContent callback. Generalized to any number of slices, it looks like this:
using UnityEngine;using UnityEngine.UIElements;
public class PieChartElement : VisualElement{    float[] m_Values = { 45f, 25f, 20f, 10f };    Color[] m_Colors = { Color.cyan, Color.yellow, Color.magenta, Color.green };
    public PieChartElement()    {        generateVisualContent += Draw;    }
    void Draw(MeshGenerationContext ctx)    {        Rect r = contentRect;        float radius = Mathf.Min(r.width, r.height) * 0.5f;        float total = 0f;        foreach (float v in m_Values) total += v;        if (total <= 0f || radius <= 0f) return;
        Painter2D painter = ctx.painter2D;        float angle = -90f; // 0 is 3 o'clock, so -90 starts at 12 o'clock        for (int i = 0; i < m_Values.Length; i++)        {            float sweep = 360f * m_Values[i] / total;            painter.fillColor = m_Colors[i % m_Colors.Length];            painter.BeginPath();            painter.MoveTo(r.center);            painter.Arc(r.center, radius, Angle.Degrees(angle), Angle.Degrees(angle + sweep));            painter.ClosePath();            painter.Fill();            angle += sweep;        }    }}
Angle 0 points to three o’clock, and because UI Toolkit’s y axis points down, increasing angles run clockwise. For a donut, skip MoveTo and ClosePath, set lineWidth to the ring thickness and lineCap to LineCap.Butt, and call Stroke on an arc at the ring’s middle radius instead of filling a wedge. Call MarkDirtyRepaint after the values change. The element works in runtime panels and in editor windows alike.
3. A custom mesh in uGUI
When you want full control in uGUI, such as per-slice gradients, exploded slices or a pie inside a mask, build the geometry yourself. A MaskableGraphic emits one triangle fan per slice:
using UnityEngine;using UnityEngine.UI;
public class MeshPieChart : MaskableGraphic{    [SerializeField] float[] values = { 45f, 25f, 20f, 10f };    [SerializeField] Color[] colors = { Color.cyan, Color.yellow, Color.magenta, Color.green };
    protected override void OnPopulateMesh(VertexHelper vh)    {        vh.Clear();        float total = 0f;        foreach (float v in values) total += v;        if (total <= 0f) return;
        Rect r = rectTransform.rect;        float radius = Mathf.Min(r.width, r.height) * 0.5f;        float start = 0f; // radians, clockwise from 12 o'clock        for (int i = 0; i < values.Length; i++)        {            float sweep = 2f * Mathf.PI * values[i] / total;            int steps = Mathf.Max(2, Mathf.CeilToInt(64f * values[i] / total));            Color32 c = colors[i % colors.Length];            int hub = vh.currentVertCount;            vh.AddVert(r.center, c, Vector4.zero);            for (int s = 0; s <= steps; s++)            {                float a = start + sweep * s / steps;                vh.AddVert(r.center + new Vector2(Mathf.Sin(a), Mathf.Cos(a)) * radius, c, Vector4.zero);                if (s > 0) vh.AddTriangle(hub, hub + s, hub + s + 1);            }            start += sweep;        }    }}
This draws in every Canvas mode and follows its RectTransform; call SetVerticesDirty after changing the values. A donut needs an inner arc as well: emit pairs of inner and outer vertices and connect each step with two triangles.
Making slices clickable
Here is the common trap. Filled Images and custom meshes receive raycasts on their whole rectangle, so overlapping slice images all claim the same click, and the alpha hit test of an Image reads the sprite’s pixels, not its fill amount. The robust fix is geometry: put one handler on the pie’s root, together with a raycast target such as a background circle, convert the pointer position to local space and look up the slice by angle.
using UnityEngine;using UnityEngine.EventSystems;
public class PieClickHandler : MonoBehaviour, IPointerClickHandler{    [SerializeField] float[] values = { 45f, 25f, 20f, 10f };
    public void OnPointerClick(PointerEventData eventData)    {        RectTransform rt = (RectTransform)transform; // pivot in the center of the pie        RectTransformUtility.ScreenPointToLocalPointInRectangle(rt, eventData.position, eventData.pressEventCamera, out Vector2 p);        if (p.magnitude > Mathf.Min(rt.rect.width, rt.rect.height) * 0.5f) return; // outside the circle
        float angle = (Mathf.Atan2(p.x, p.y) * Mathf.Rad2Deg + 360f) % 360f; // clockwise from 12 o'clock        float total = 0f;        foreach (float v in values) total += v;        float end = 0f;        for (int i = 0; i < values.Length; i++)        {            end += 360f * values[i] / total;            if (angle < end) { Debug.Log($"Slice {i} clicked"); return; }        }    }}
For the Painter2D element, register a ClickEvent callback and use the same math with UI Toolkit’s downward y axis: Mathf.Atan2(d.x, -d.y), where d is the pointer’s local position minus the center, gives the angle clockwise from twelve o’clock. Hover highlights follow the same pattern with pointer move events and a redraw.
Pie and donut charts with Chart Guru
Chart Guru draws pies and donuts from SectorMark, the same mark Swift Charts uses, in a uGUI Canvas, in UI Toolkit and on world-space Canvases. This builds a donut with data labels, a legend and a click handler:
using ChartGuru;using UnityEngine;
public sealed class TrafficSourcesDonut : MonoBehaviour{ [SerializeField] private ChartGraphic _graphic;
private static readonly string[] Channels = { "Organic", "Search", "Partners", "Campaigns", "Direct" }; private static readonly float[] Share = { 34f, 26f, 17f, 14f, 9f };
private void Start() { ChartBuilder builder = Chart.Create() .ChartType(ChartType.Donut) .ChartTitle("Traffic sources") .ChartPieLabelMode(PieLabelMode.CenteredAuto) // small slices get leader lines .ShowDataLabels() .ChartLegend(LegendPosition.Bottom);
for (int i = 0; i < Channels.Length; i++) { SectorMark slice = new SectorMark(Share[i]).InnerRadius(0.6f); slice.CategoryLabel = Channels[i]; slice.ForegroundStyle(PlottableValue.Value("Channel", Channels[i])); builder.Add(slice); }
_graphic.SetChart(builder.Build()); _graphic.OnDataPointClicked += (index, point) => Debug.Log($"{Channels[index]}: {point.Y}%"); }}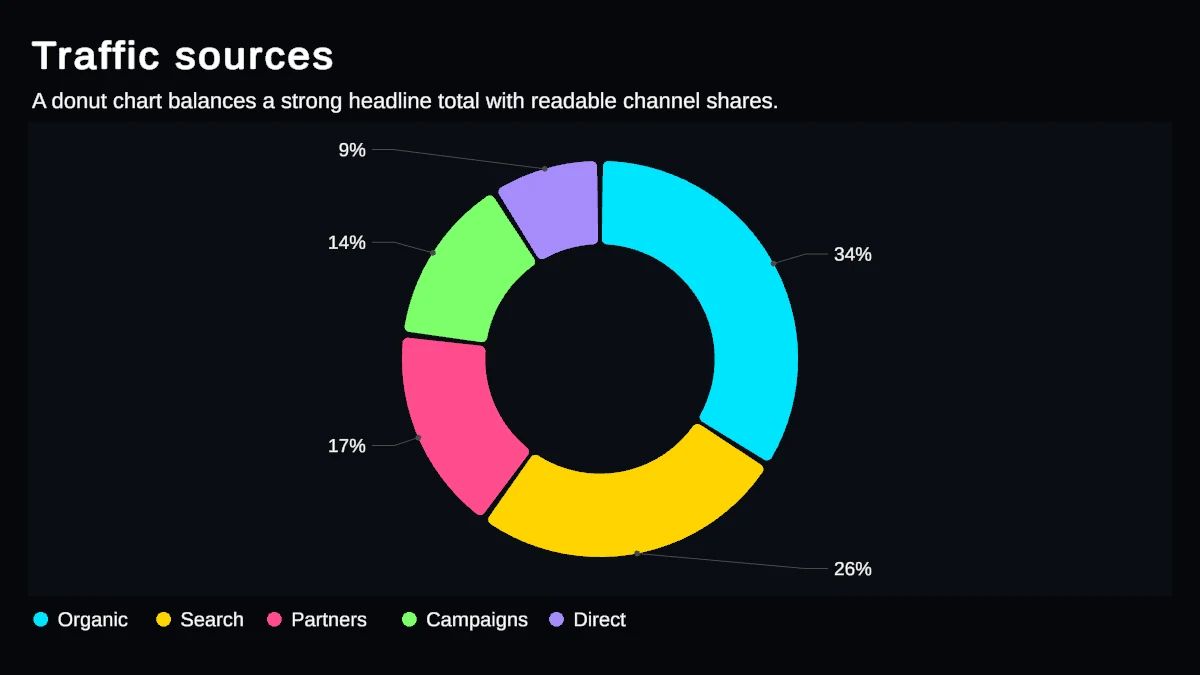 Leader lines keep the labels of small slices readable.
The parts that take the most time in the hand-rolled versions are built in:
- Labels and leader lines:
PieLabelMode.Centeredputs labels inside the slices,CenteredAutoswitches small slices to leader lines, andLeaderLinesplaces every label outside the pie. - Clicks and selection: slices and their hit regions are both sized by the value’s magnitude, so a click reports the slice under the pointer.
OnDataPointClickedreports its index, and on the builderChartAngleSelection, the counterpart of Swift Charts’chartAngleSelectionmodifier, reports the selection as a value, or null when it clears. - Tooltips: hovering a slice shows its value, and a click or tap pins the tooltip.
- Concentric donuts: when sectors belong to several series, a donut draws one ring per series, for example one ring per quarter.
- Mini pies and donuts: the compact MiniPie and MiniDonut types draw small pies with minimal padding for table cells, HUDs and KPI tiles, as described in the sparklines and KPIs use case.
- Motion: data changes animate, and a saved chart with an animation morphs between any two 2D chart types, from bars to a pie and back.
- 3D and Swift: Chart Guru 3D, included with Chart Guru, adds Pie3D and Donut3D, and Swift Charts code with
SectorMark(angle:innerRadius:)pastes into the Chart Designer as a Chart Guru donut.
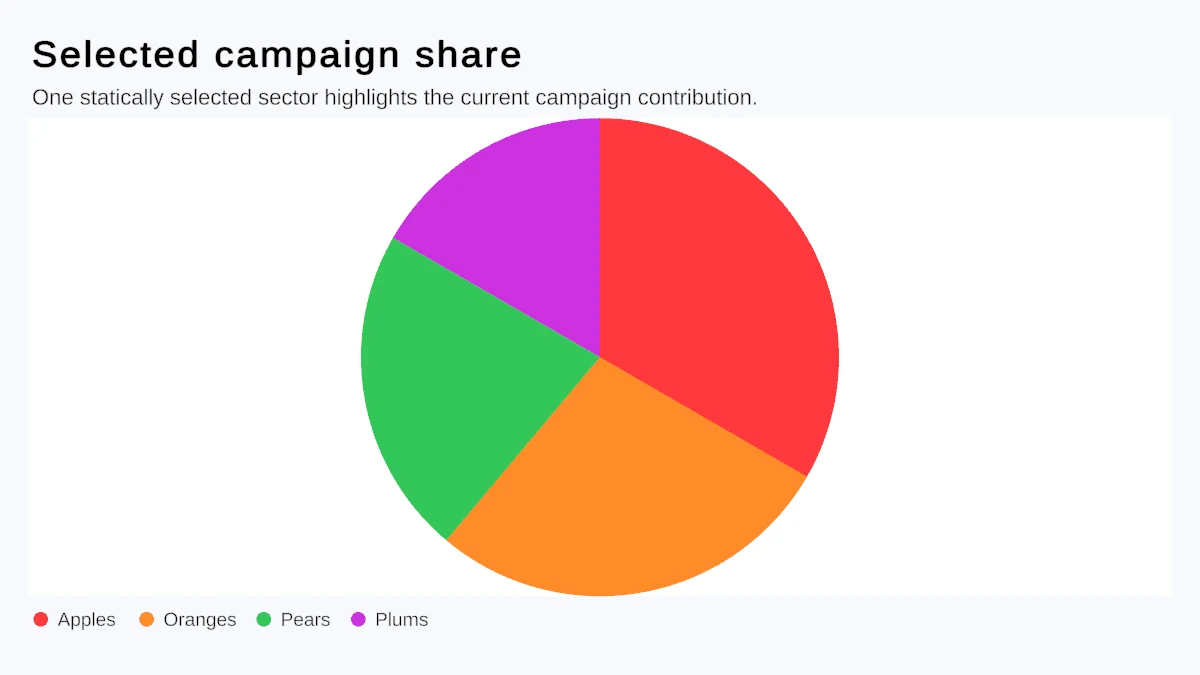 Pies and donuts come from the same SectorMark, with or without an inner radius.
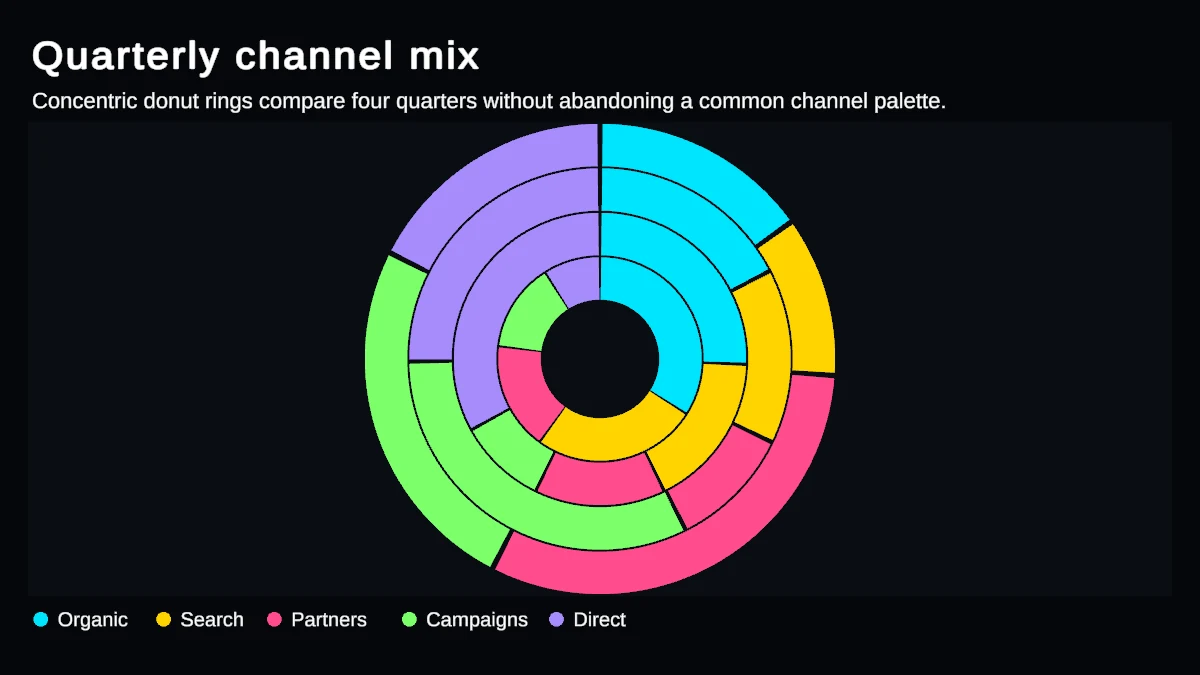 Several series become concentric rings, here one per quarter with a shared channel palette.
Comparison
| Filled Images | Painter2D | Custom mesh | Chart Guru | |
|---|---|---|---|---|
| UI system | uGUI | UI Toolkit | uGUI | uGUI, UI Toolkit, world space, 3D |
| Start angles | Rotate each Image | Arc start and end angles | Your own math | Automatic |
| Donut | Ring sprite or a covering circle | Stroked arcs | Inner and outer vertices | InnerRadius or the Donut type |
| Labels | TextMeshPro objects you place | Label elements you place | Objects you place | Built in, with leader lines for small slices |
| Clickable slices | Angle math on the root | Angle math in a ClickEvent | Angle math | Slice hit testing, click and selection events |
| Animation | Tween fillAmount yourself | Redraw with new values | Rebuild the mesh | Animated data changes and type morphs |
Which approach to pick
For a static pie with three slices on a HUD, filled Images are hard to beat: no code beyond the loop above and nothing to install. In UI Toolkit, the Painter2D element is the natural choice, and a custom mesh pays off when you need effects that sprites cannot give you.
Once the pie needs labels that stay readable, clickable slices, a legend, live data or the same chart in UI Toolkit and uGUI, the hand-rolled versions turn into a small project each. That is the point where Chart Guru, US$29 on the Asset Store (November 2026), saves time. For line graphs, the line graph tutorial compares the same kinds of approaches.
Frequently asked questions
How do I make a pie chart with Image fill in Unity?
Use one Image per slice with a circle sprite. Set its type to Filled with the Radial 360 method, origin Top and clockwise fill, set fillAmount to the slice's share of the total, and rotate the Image by the angle where the previous slices end.
How do I make pie chart slices clickable in Unity?
Filled Images and custom meshes receive clicks on their whole rectangle, so convert the pointer position to the pie's local space, compute the angle with Mathf.Atan2 and find the slice whose angle range contains it. Chart Guru hit-tests the drawn slices itself and reports the clicked slice through OnDataPointClicked.
How do I make a donut chart in Unity?
With Image fill, use a ring sprite or cover the center with a circle in the background color. With Painter2D, stroke each arc with a wide line instead of filling a wedge. In Chart Guru, give each SectorMark an inner radius, for example InnerRadius(0.6f), or choose the Donut chart type in the Inspector.
Easy, reliable charts for Unity, from sparklines to multi-series 3D.
Keep reading
 Article
How to make a line graph in Unity
Unity ships no line chart control. Four ways to draw one, from a world-space LineRenderer to a chart library with axes, tooltips and live data, with code for each and an honest look at when hand-rolled code is enough.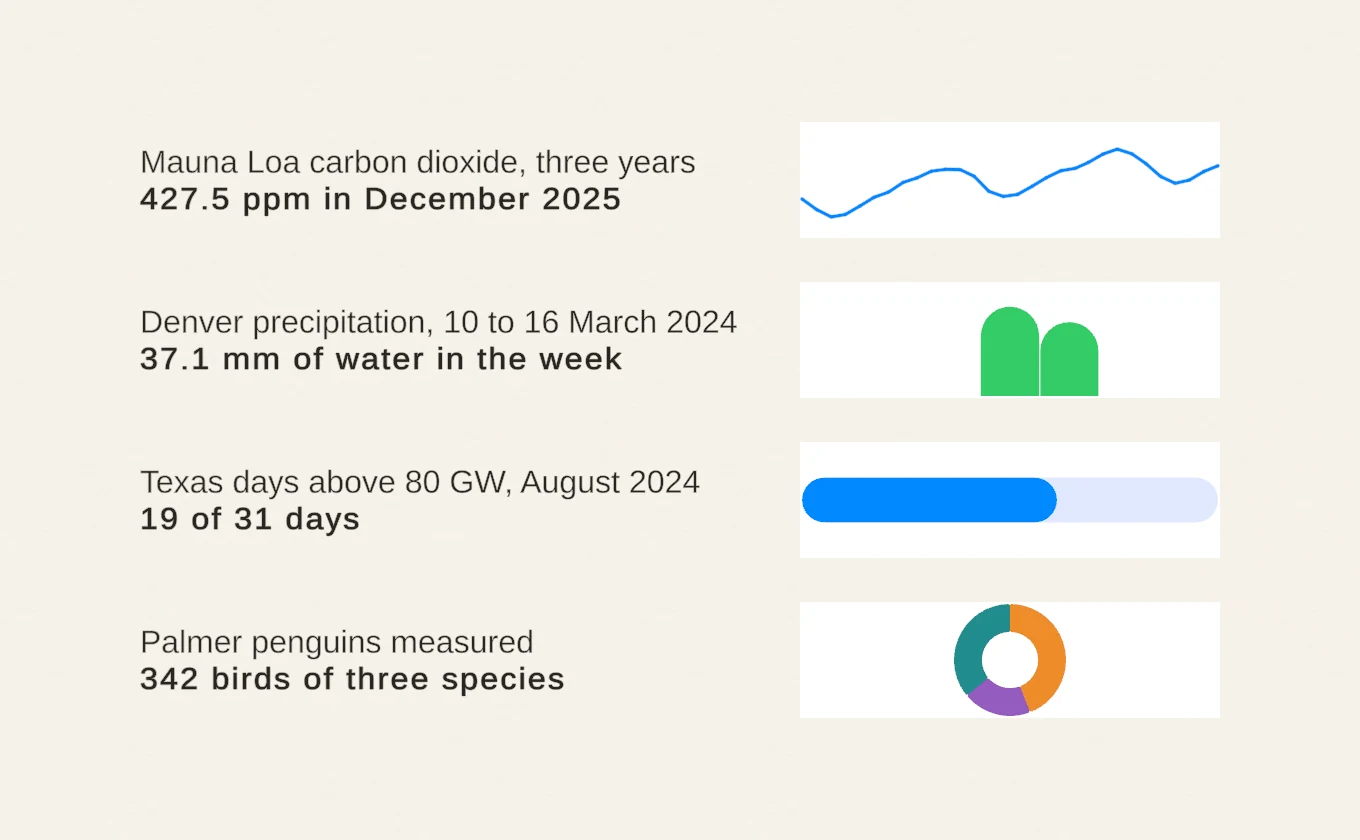 Use case
Sparklines and KPI charts for compact UI
Chart Guru's compact chart types for Unity drop axes and padding, so a trend, a split or a progress value fits into a table cell, a HUD or a KPI card. They share the API, data sources and live updates with full charts. Use case