Porting Swift Charts to Unity: The Making of Chart Guru
How a Unity charting tool became a Swift Charts-inspired authoring system: Swift parsing, C# generation, the Designer, visual verification, SDF shaders and 3D charts.
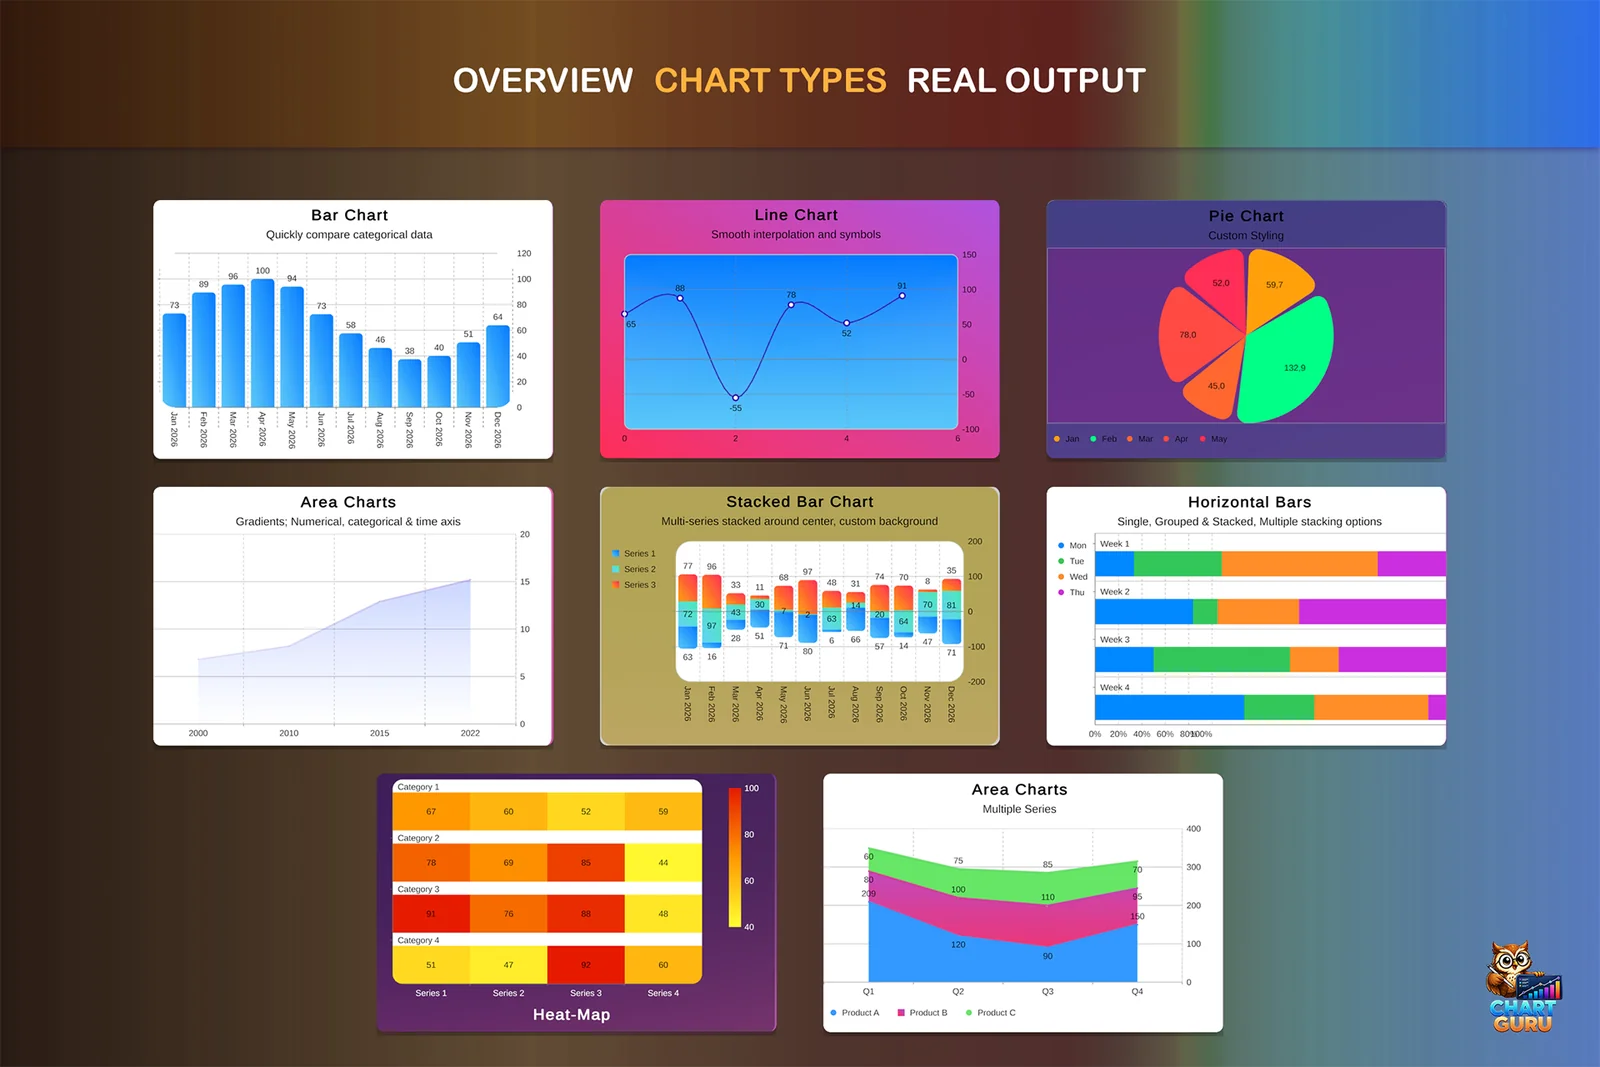
How a Unity charting tool became a Swift Charts-inspired authoring system with Designer workflows, Swift parsing, C# code generation, visual verification, layout debugging, SDF shaders, 3D charts, and Asset Store polish.
Chart Guru at release polish: the public-facing result of the importer, renderer, examples, documentation, and validation work.
Chart Guru did not start as a grand plan to port Swift Charts to Unity.
It started as a chart tool.
That sounds small until you try to do it properly. A chart is not just a line, a bar, or a pie slice. A chart is data shaping, scales, axes, labels, legends, layout, defaults, interaction, animation, editor tooling, runtime performance, documentation, and hundreds of tiny visual decisions that users notice only when they are wrong.
The first visible charting work could draw something, but drawing something was never going to be enough. The real product had to make a Unity developer feel like they could describe data visually without fighting the system. Once that became the goal, Swift Charts became the north star.
Not because Chart Guru should literally run Swift inside Unity. The goal was more practical: bring the clarity and expressive structure of Swift Charts into Unity, while still producing idiomatic C#, Unity-friendly data flows, editor tooling, and runtime output that can ship inside games, dashboards, simulations, and tools.
That decision changed the whole project.
It turned Chart Guru from a chart renderer into a translation and authoring system.
The First Mistake: Thinking Charts Were Mostly Rendering
The obvious work came first: marks, colors, grids, labels, chart types, and a surface that could render into Unity. That phase is satisfying. You create a bar chart, then a line chart, then a pie chart, and the project looks like it is moving quickly.
Then the hard parts start.
Labels need to sit somewhere. Legends need to explain series without stealing the chart. Axis ticks need to be readable. Domains need to be automatic until the user needs control. Multiple series need consistent grouping. Stacking has to work in standard, normalized, and centered modes. Data labels need to survive real values instead of hand-picked demo values.
The history of Chart Guru has a repeating pattern: a feature looked like a renderer feature, then became a layout feature, then became an API feature.
Axes were the clearest example. At first, an axis looks like a line and some labels. Then it becomes top and bottom placement, left and right placement, grid behavior, label style, scale domains, date units, multiple axes, gradients, and the interaction between every one of those choices. Swift Charts parity forced those details into the open. A partial axis system was not enough. Axes had to become explicit architecture.
That was one of the first important pivots. Chart Guru could not stay a collection of special cases. It needed a model that could survive the next chart type, the next modifier, and the next Swift sample.
Mock Magic: The Test Data Tool That Became Its Own Asset
One of the best side stories in Chart Guru is Mock Magic.
Mock Magic began as a practical need: Chart Guru needed varied data. Not three perfect rows in a demo scene, but many shapes of data: names, categories, dates, series, trends, outliers, live updates, and values that would make layout problems obvious.
Good chart examples require uncomfortable data. Labels get long. Series counts change. Values cluster. Dates compress. The chart has to keep working when the input stops being curated.
That need grew into a separate product. Mock Magic was initially infrastructure for testing charts, but the same capability was valuable beyond Chart Guru. Unity developers need realistic mock data for UI, prototypes, tools, and dashboards. The thing built to make Chart Guru harder to break became useful enough to stand on its own.
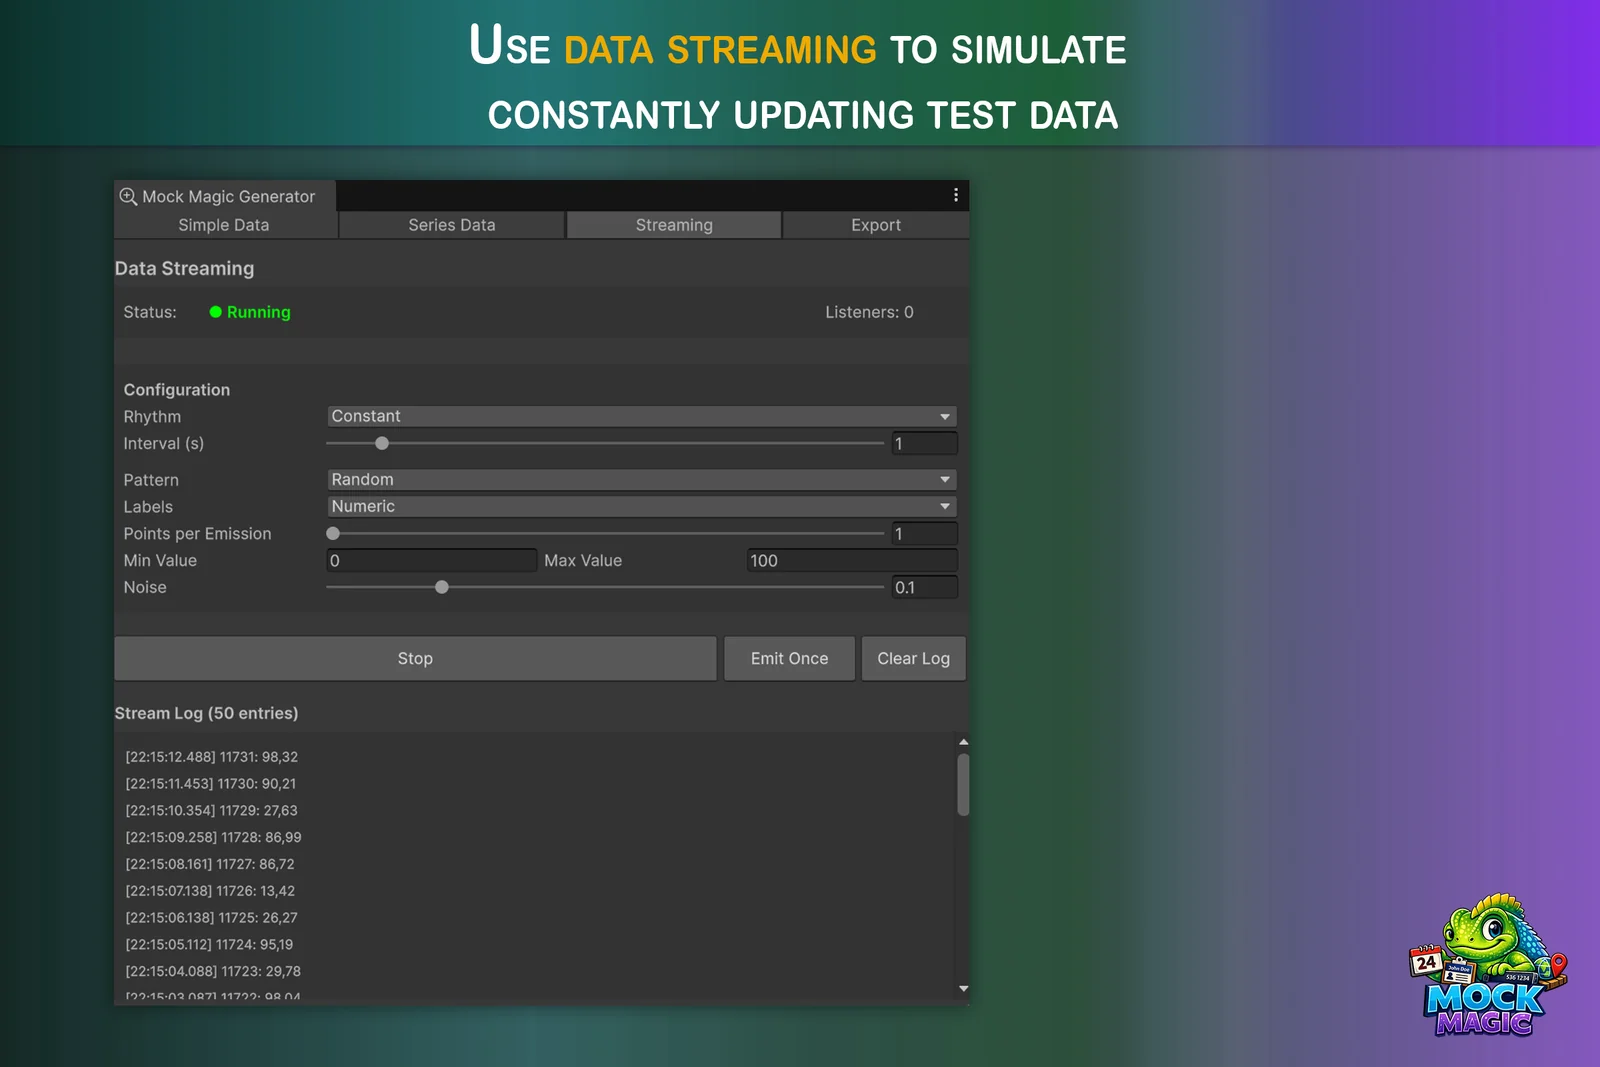
Mock Magic streaming turns static test data into live feeds for charts, dashboards, and monitoring-style UI.
The stream features made that connection especially clear. Chart Guru did not only need static sample arrays. It needed data that behaved like a running system: new values arriving over time, labels continuing across emissions, chart windows moving, dashboards updating, and listeners receiving fresh points without a hand-authored fixture for every test case.
Mock Magic grew into that role with a dedicated Streaming tab. Streams can run in Edit Mode or Play Mode. They can emit on constant, random, burst, or drip rhythms. They can control interval, value range, noise, series pattern, label preset, and points per emission. They expose a listener count, an emit-once command, and a timestamped stream log so a developer can see what is being produced before wiring it into a chart.
That mattered for Chart Guru because live data changes what a chart has to prove. A static screenshot can hide layout problems. A stream reveals whether labels continue correctly, whether rolling windows stay readable, whether updates allocate too much, and whether the chart behaves like a real runtime surface instead of a one-time render.
That is the kind of product evolution I like: not a detached idea, but a tool extracted from a real pressure point.
The API Pivot
The largest conceptual pivot was the API.
An early chart API can easily become mechanical: create chart, add series, set colors, assign labels, configure axes. It works, but it makes the user think about construction details instead of visual intent.
Swift Charts has a different feel. You describe marks. You bind values. You compose modifiers. The chart reads closer to a visual sentence than a list of setup calls.
Chart Guru moved toward that shape, but it had to do it in C#.
That created a useful tension. Swift input should remain Swift-shaped, because importing real Swift Charts snippets is part of the magic. But generated and hand-written Unity code should look like C#, not translated Swift with different punctuation.
The final direction was to accept Swift Charts syntax at the boundary and generate idiomatic Chart Guru C# from it. Swift can be pasted or imported. The parser reads mark families, literal data, loops, foreground styles, axes, legends, scrolling, annotations, gradients, and other supported constructs. The code generator then emits PascalCase C# using the Chart Guru fluent API.
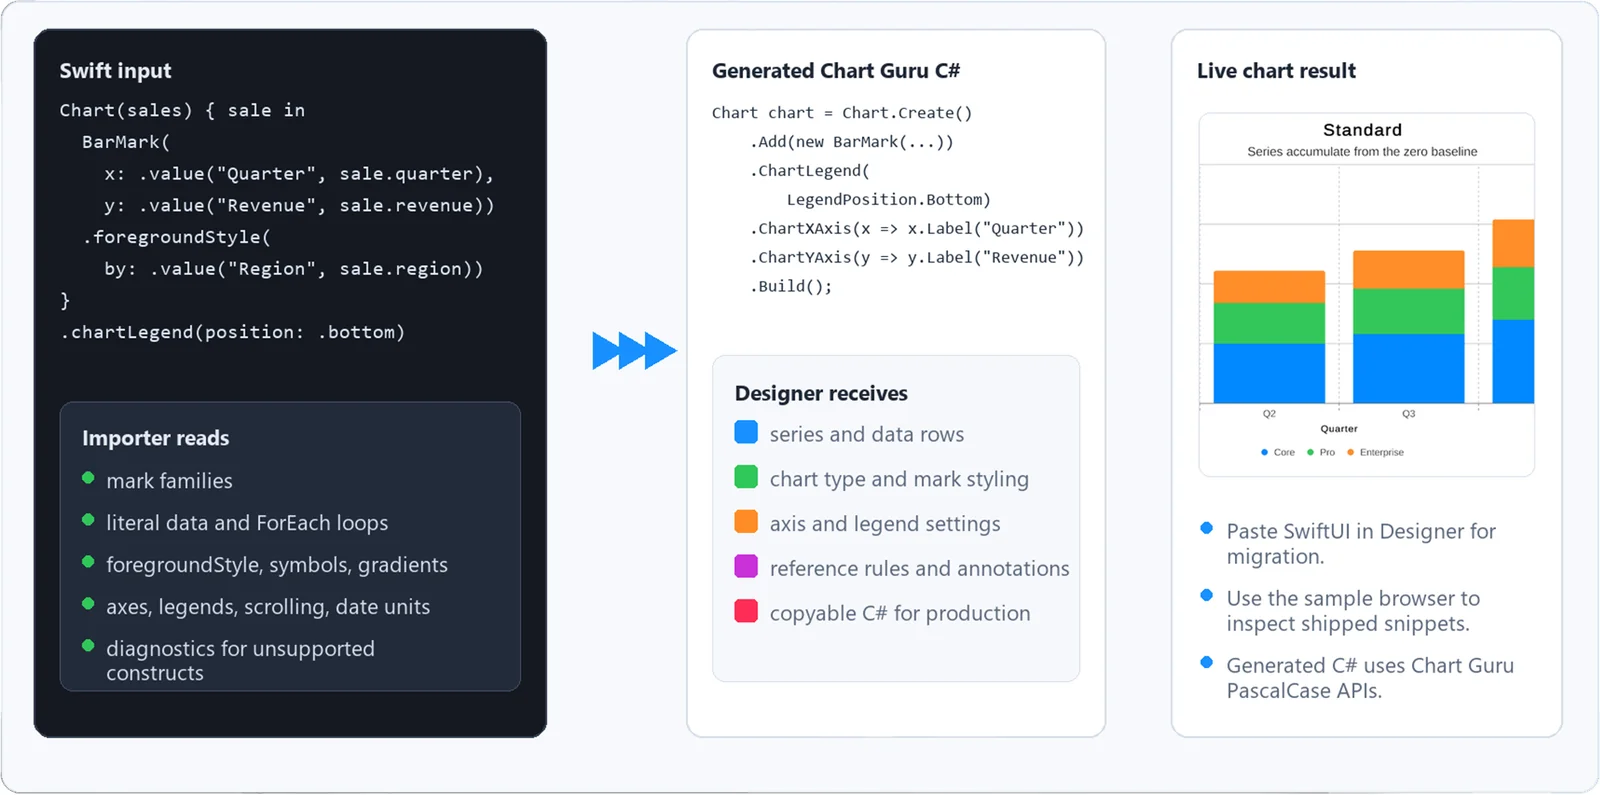
Swift input, generated Chart Guru C#, and a live Unity chart result in one workflow.
The point is not only that code is generated. The point is that the generated code is usable. It becomes a bridge between inspiration and production: Swift in, Chart Guru C# out, live Unity chart on the other side.
That is where Chart Guru starts to feel less like a chart package and more like a porting layer.
Swift In, Chart Guru C# Out
The importer became a full pipeline:
- Swift source enters as text.
- The parser identifies chart structure, data, marks, modifiers, scales, axes, legends, and unsupported constructs.
- The parsed representation is normalized into Chart Guru model state.
- The generator emits C# against the fluent API.
- The same model can be inspected, rendered, and verified inside Unity.
The Swift parser is intentionally chart-focused. It does not try to become a general Swift compiler. It preprocesses pasted Swift, removes comments and unsupported wrapper blocks, finds literal datasets, resolves marks, reads chart-level modifiers, extracts foreground style scales, gradients, enum raw values, rules, axes, legends, scrolling, and formatting hints, then normalizes all of that into a Chart Guru import definition.
That definition is the hinge.
Code generation is downstream from it. The generator does not depend on the Swift parser. It receives the normalized chart definition and decides what C# imports are needed, which data declarations to emit, how series metadata should be represented, when to use plottable values, which modifiers are meaningful, and which defaults should stay implicit.
This is why generated Chart Guru code can preserve the Swift sample’s intent without looking like awkward Swift translated character by character. Swift input can use .chartXAxis, .foregroundStyle, and .value. Generated C# emits Chart Guru’s PascalCase fluent API, with code that a Unity developer can read, edit, and keep.
The Designer: Visual Authoring on the Same Foundation
That shared definition also made the Chart Designer possible.
Swift Charts inspired the mental model, but Unity developers also expect editor tooling. They want to try chart types, edit data, change styles, preview the result, and create a chart in the scene without writing a full script first.
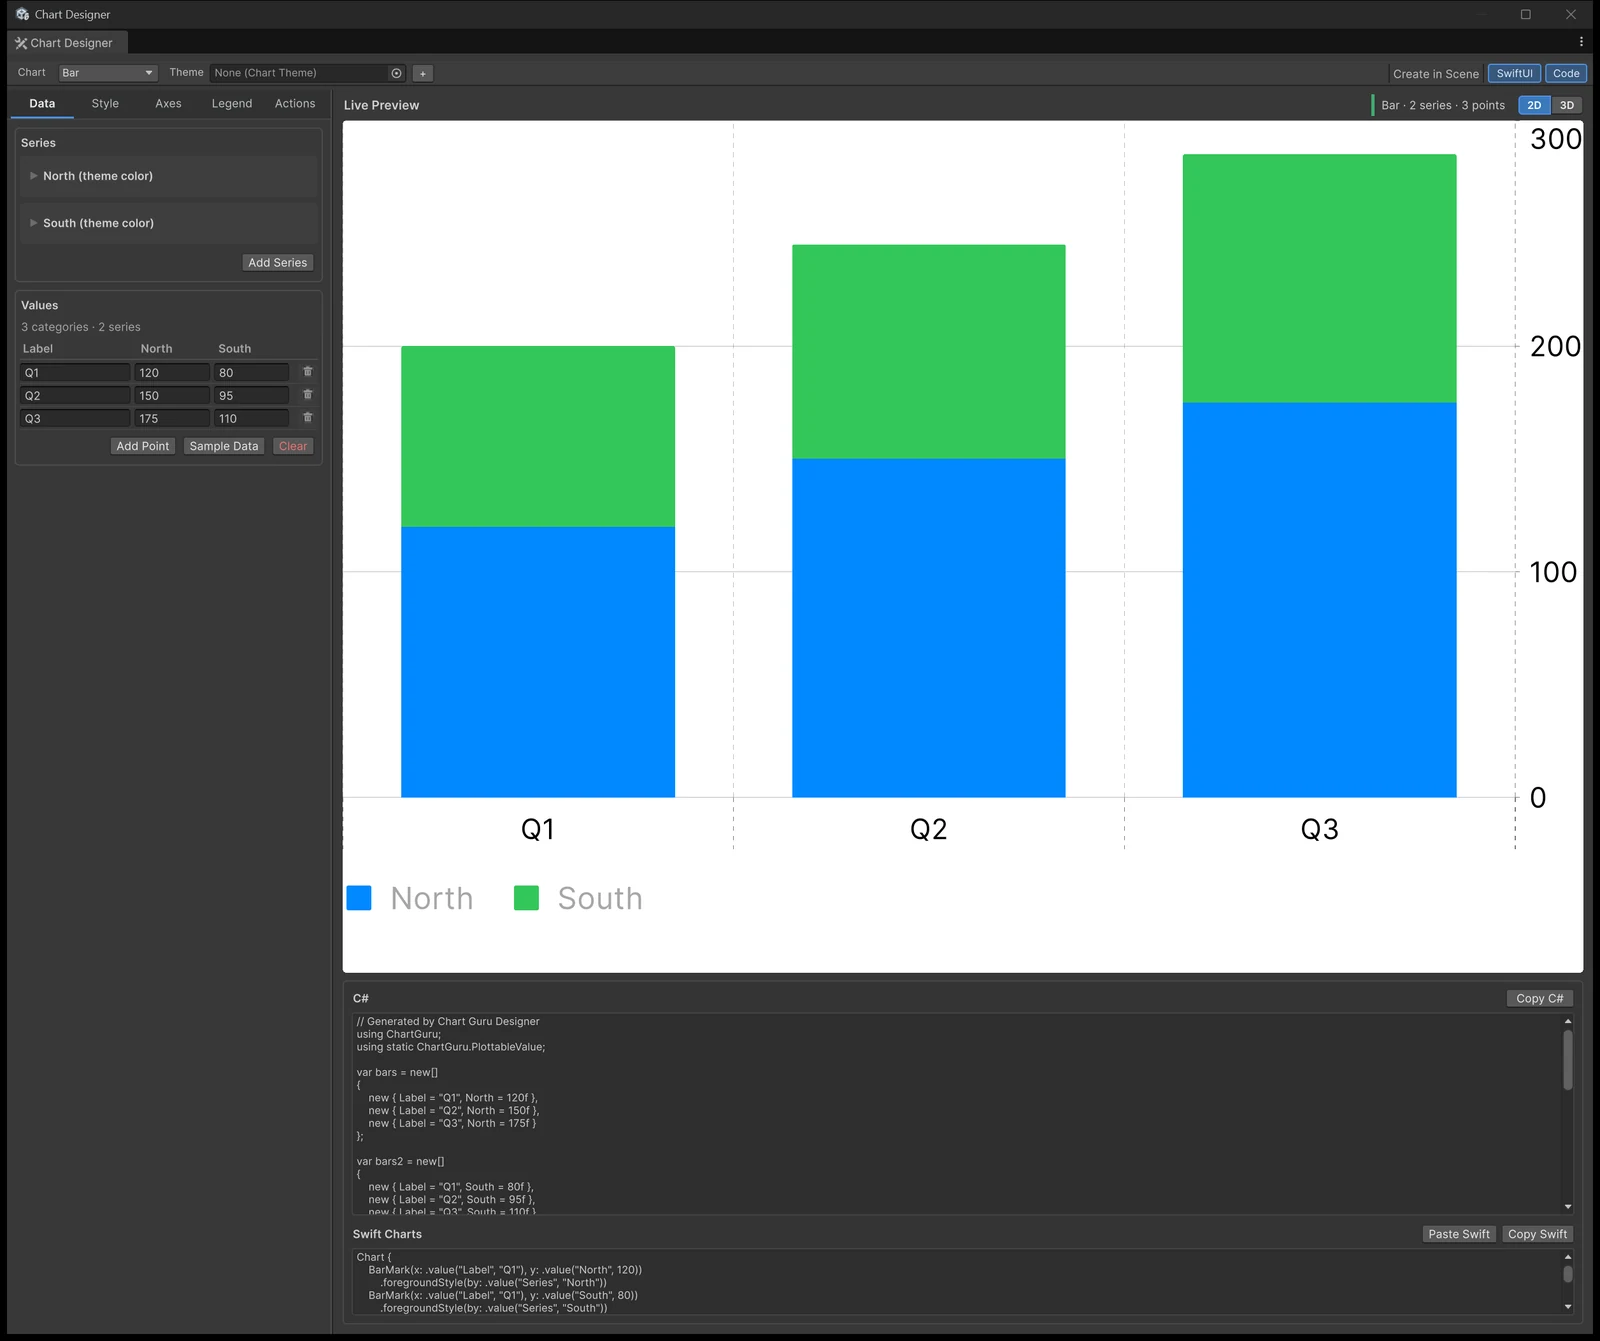
That could have become a separate visual editor with its own chart rules. It did not. The Designer is built around the same chart concepts as the fluent API and the importer: chart type, series, axes, legend, style, animation, plot area, data labels, and generated code.
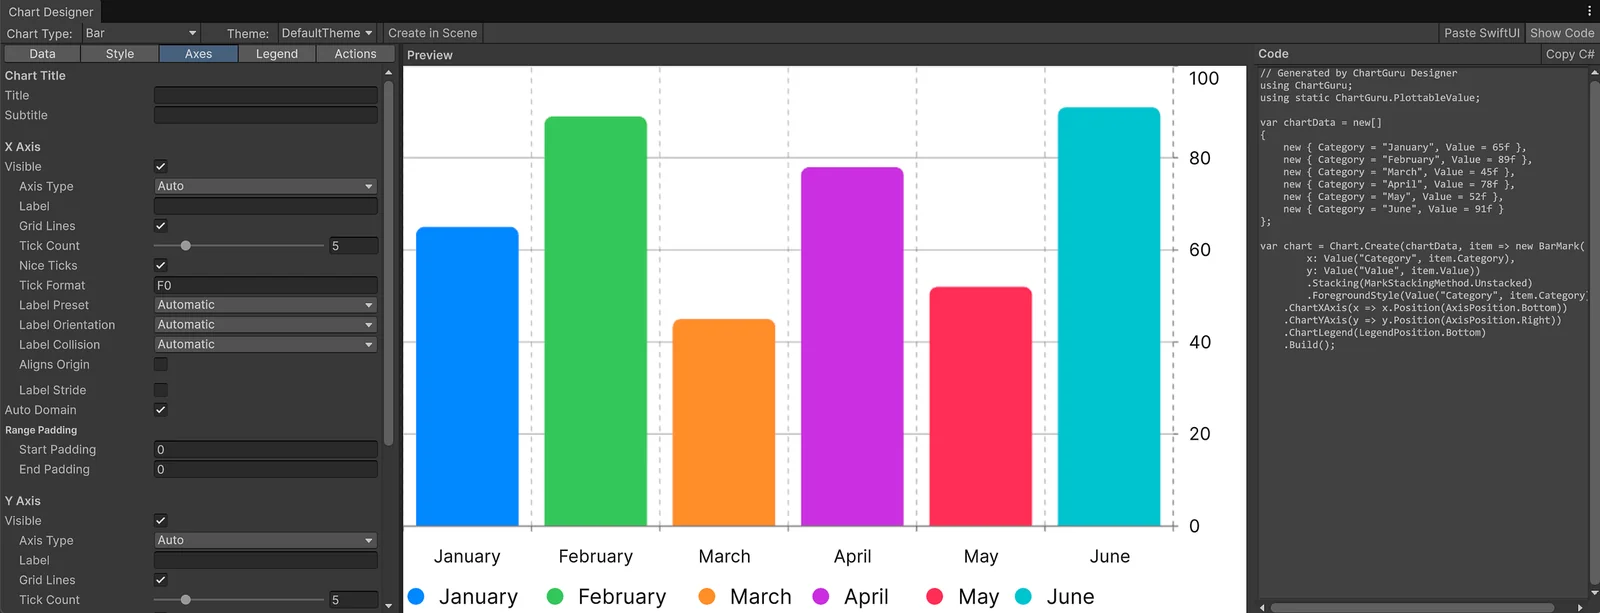
The Chart Designer turns the same chart model into a WYSIWYG authoring workflow with data editing, styling tabs, live preview, and scene creation.
This matters because visual authoring and generated code are not separate worlds. The Designer can build a chart definition from the visible controls, send that definition through the same C# generator, and show a live code representation of the chart. It can also receive imported Swift chart state and turn it into editable Designer state. [November 2026: since version 1.4, the Designer also switches compatible charts between 2D and 3D, supports Undo, and its Swift Charts panel lists the settings it cannot export.]
That is a subtle but important product choice. A user can start visually, inspect the generated C#, and move into code. Or they can paste Swift, see the generated C#, and then adjust the chart visually. The workflow stays reversible enough to teach the system instead of trapping the user inside one authoring mode.
The most important part is that this pipeline is visible. There are scenes and tools where the input, parsed state, generated code, and rendered chart can be inspected together. That matters because code generation can otherwise become a black box.
Chart Guru needed the opposite. It needed to show its work.
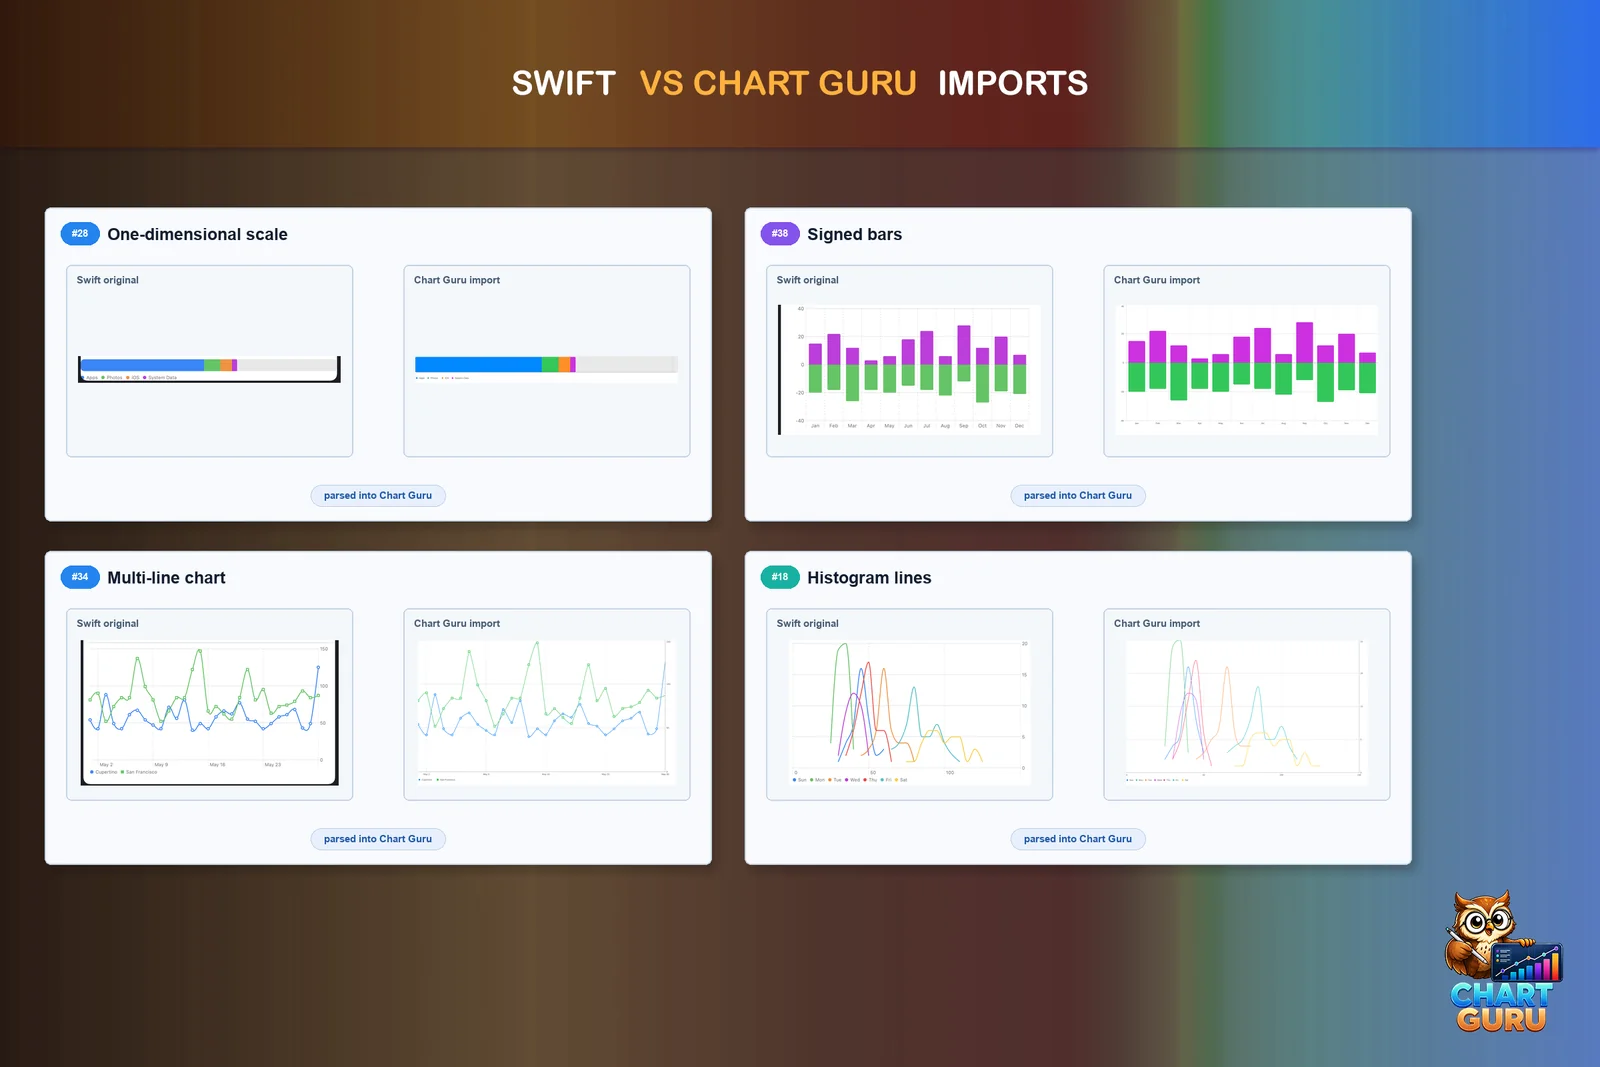
Polished Swift-vs-Chart-Guru comparisons from the store screenshot set.
The polished screenshots communicate the user-facing result: Swift examples can become Chart Guru charts. But the more interesting engineering artifact is the verification view behind that result.
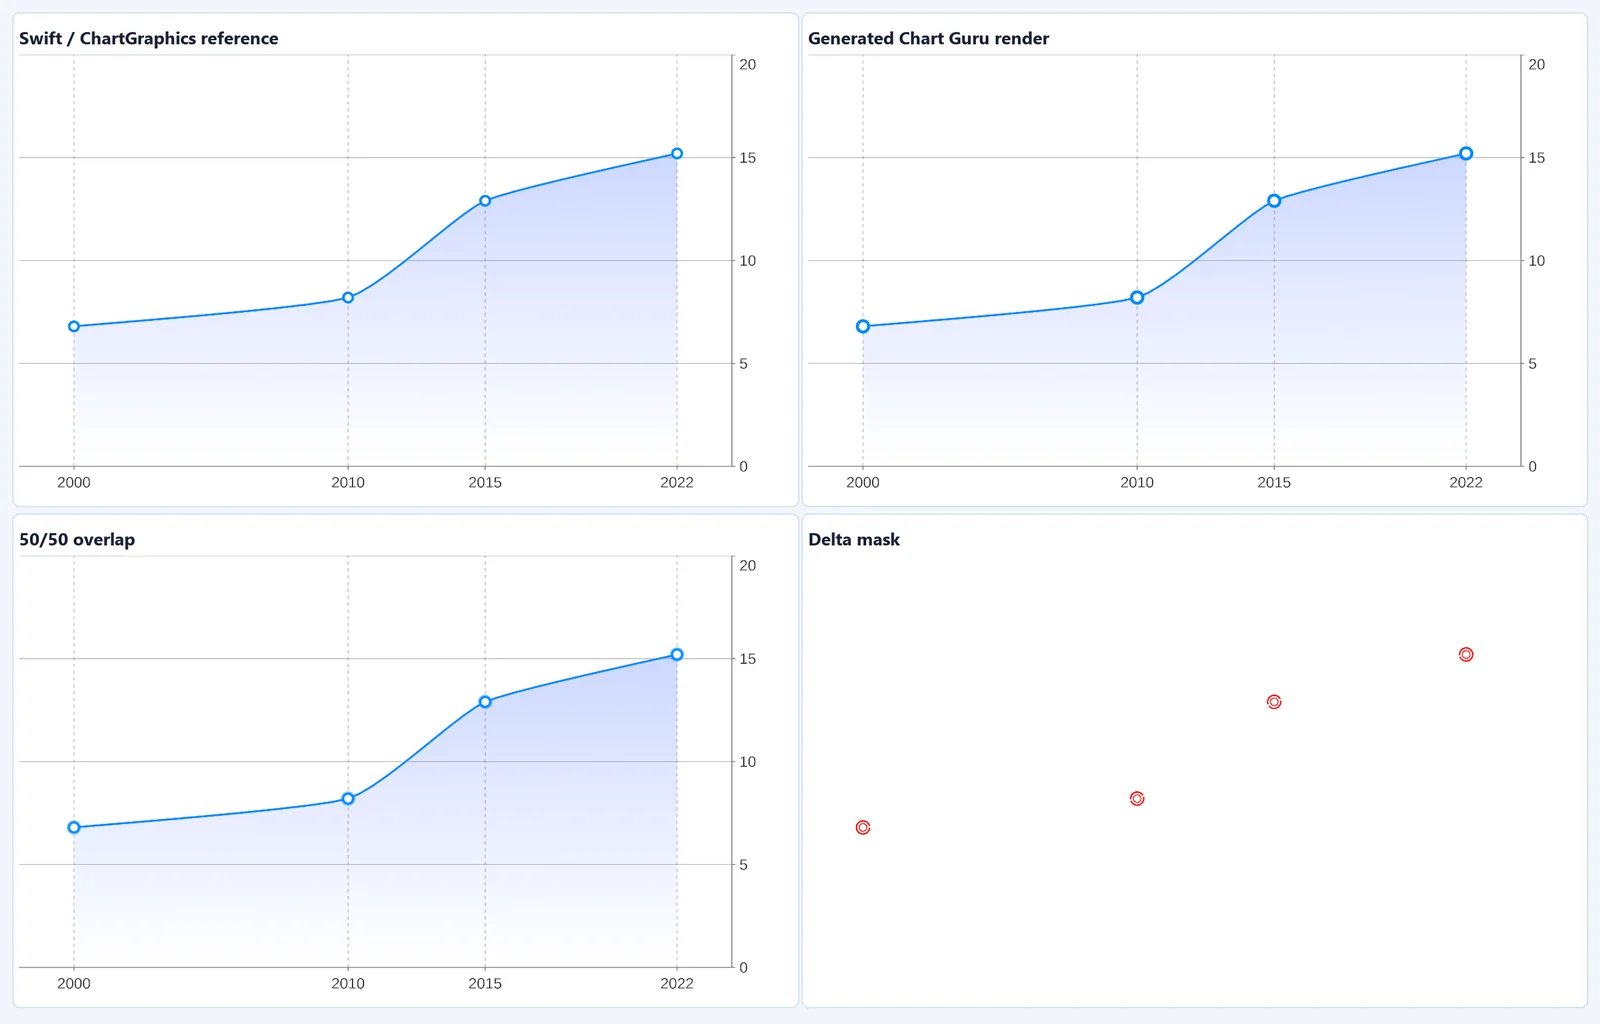
Internal visual QA composite: reference render, generated Chart Guru render, 50/50 overlap, and delta mask.
This is the kind of image I like most for the story because it shows the project thinking. The reference render, generated Chart Guru render, overlap, and delta mask are not marketing decoration. They are evidence. They show how parity was tested visually, where the remaining raster differences were, and why the pipeline could keep improving without guessing.
The current Visual QA run processed 40 Swift samples, produced 40 reference reviews, reported no failures, and isolated generated-output differences into one visual mismatch plus eight exact raster deltas. That is not a claim that every possible Swift Charts construct is solved forever. It is better than that: it is a mechanism for finding the truth.
Parity Is a Thousand Edge Cases
Swift Charts parity did not arrive as one feature.
It arrived as a long sequence of corrections.
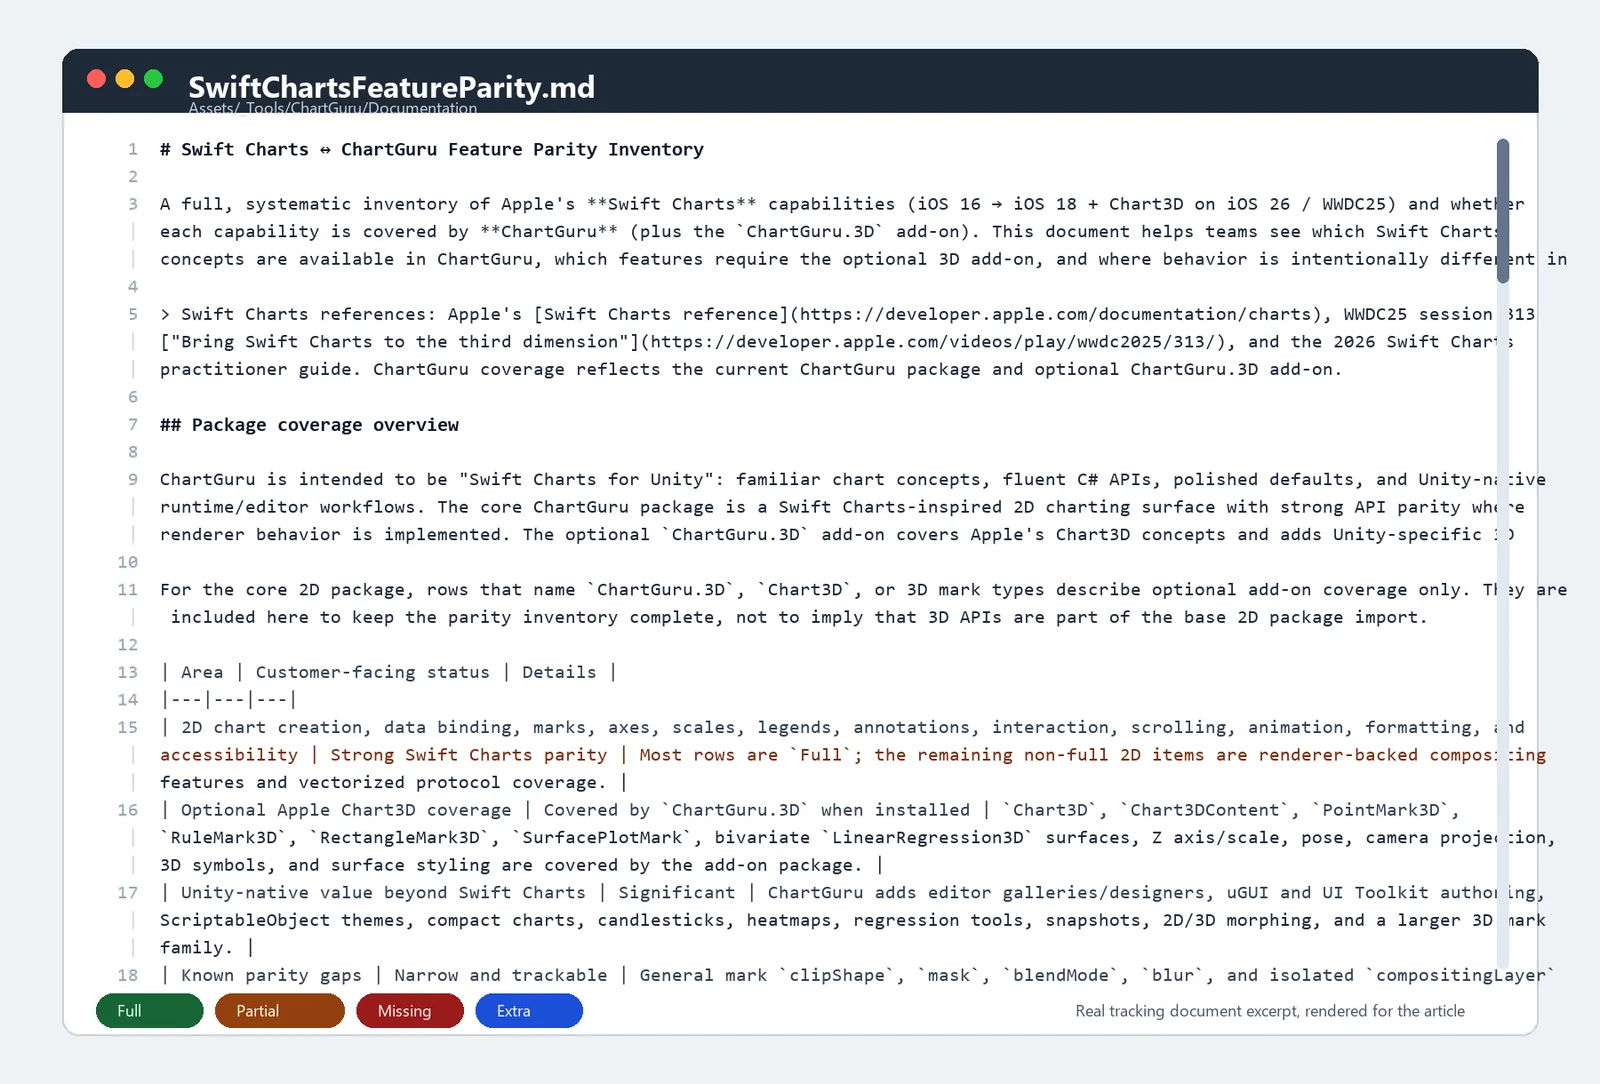
The real Swift Charts parity tracker: a large working document used to map Swift Charts concepts to Chart Guru coverage, known gaps, Unity-specific extras, and optional 3D add-on support.
The big parity document became one of the project’s most useful artifacts. It was not a marketing checklist. It was an engineering map.
Each row forced a question: is this Swift Charts concept supported, partially supported, missing, irrelevant to Unity, or intentionally exceeded by Chart Guru? The document tracked core chart creation, marks, axes, scales, legends, annotations, interactions, scrolling, animation, formatting, vectorized plots, 3D concepts, and Unity-native extras.
That made the work concrete. “Support Swift Charts” is too vague to build against. “This modifier is partial because renderer-backed isolated compositing is not implemented in every backend” is something you can prioritize, test, and explain.
A mark type gets added. Then a modifier changes how the mark is grouped. Then a foreground style has to bind by category. Then a legend needs to reflect the same grouping. Then the axis scale changes. Then the label style breaks at a smaller chart size. Then the generated C# is technically correct but not idiomatic. Then the sample scene reveals that two paths are agreeing on the same wrong interpretation.
That is the real history: not a straight line, but a narrowing loop.
Some pivots were about visual output: gradients, symbols, stacked bars, normalized stacks, area fills, heatmaps, function plots, vectorized plots, and trend lines.
Some were about layout: axis placement, multiple axes, labels, legends, annotations, padding, domains, scrollable ranges, and date handling.
Some were about authoring: editor windows, gallery scenes, UI Toolkit surfaces, import diagnostics, generated code, and examples that were useful enough to teach the product.
Some were about runtime credibility: reusable buffers, zero-allocation paths, stable layouts, large grids, live data, and charts that could update without rebuilding everything from scratch.
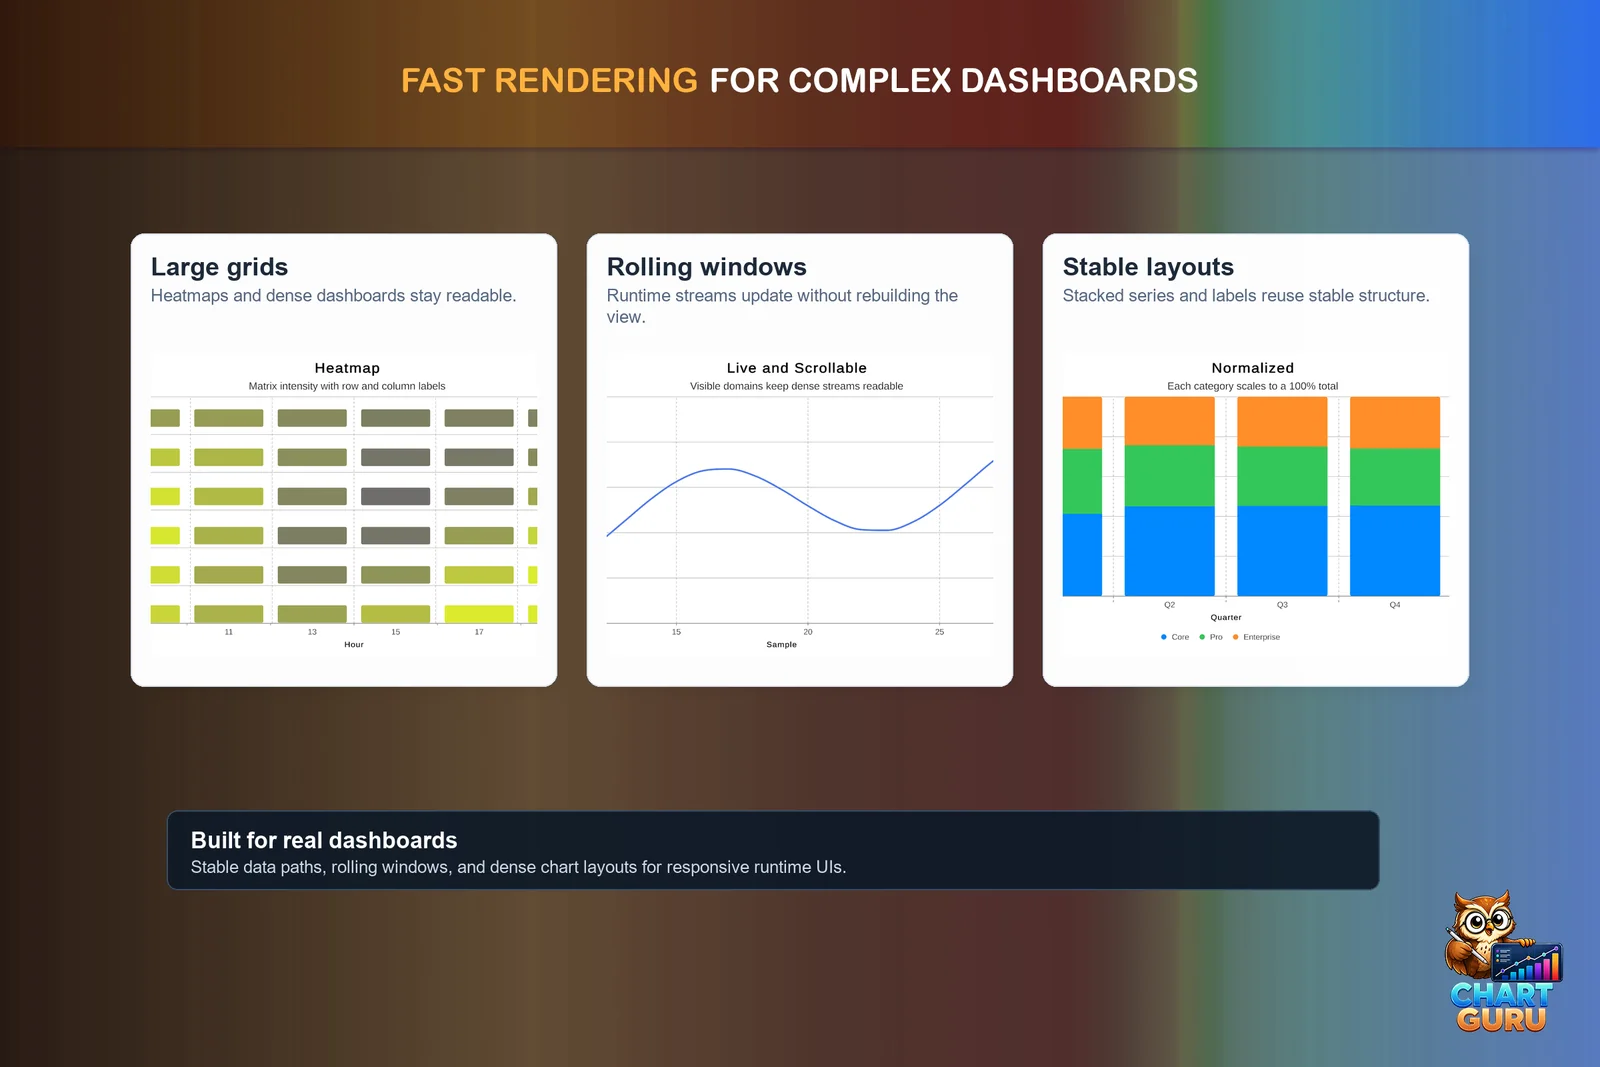
Runtime credibility became part of the product story: dense layouts, rolling windows, and stable chart structure.
The key realization was that parity could not be a checklist hidden in a document. It needed to be exercised by scenes, samples, tests, screenshots, and comparison images. Every new Swift sample became a small contract. Every generated C# output had to preserve intent. Every visual comparison turned a vague claim into something inspectable.
Layout Debugging: Making Invisible Space Visible
The layout debugger is the most concrete example of that discipline.
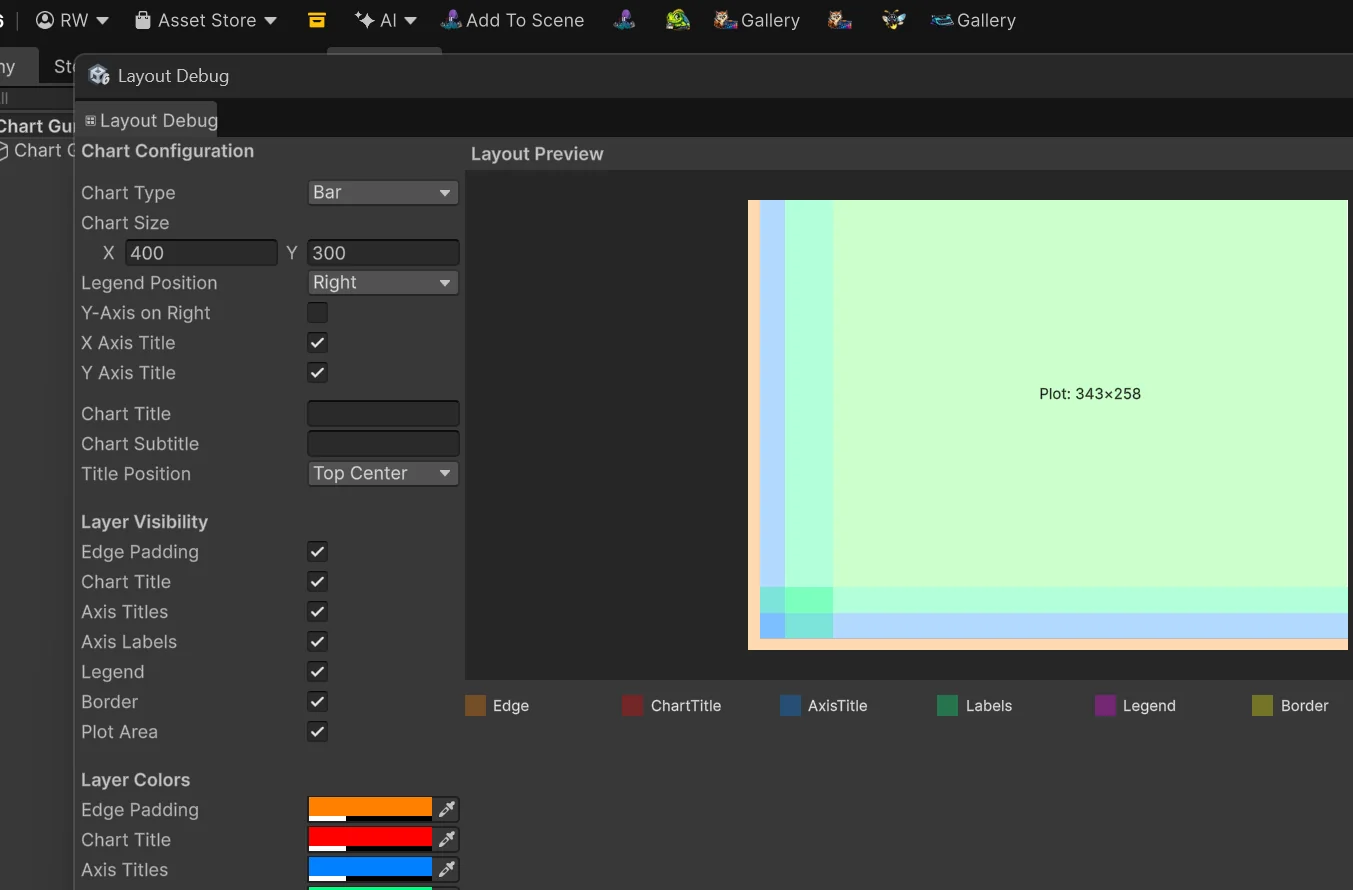
The layout debugger makes reserved chart space visible: edge padding, axis titles, labels, legend, border, and final plot area.
This debug window exists because chart layout is one of those problems that looks simple only from the outside. The user sees a plot area, labels, axes, a legend, a title, and maybe a border. The implementation sees layers of reserved space that all compete for the same rectangle.
The debugger color-codes those layers. Edge padding, chart title space, axis title bands, axis label bands, legend reservations, border space, and the final plot area are drawn as separate overlays. The metrics panel exposes the exact numbers used to calculate the final chart rectangle.
That mattered for Swift Charts parity. Axis work was not just “draw an axis on the left.” It was left, right, top, bottom, labels, titles, legend placement, plot-area shrinkage, chart title placement, and the order in which each layer consumes space. Once multiple axes, label styles, and modifier combinations entered the picture, layout needed to be inspectable.
The layout debugger is a good example of a tool that is not part of the customer-facing magic, but makes the magic possible. It turns a vague visual bug into a concrete question: which layer reserved this space, and why?
Verification Made the Pipeline Real
The verification scenes are one of the most interesting parts of Chart Guru because they turn invisible infrastructure into visible product evidence.
There is a big difference between saying “we parse Swift Charts” and showing a scene where a Swift snippet becomes parsed model state, generated C#, and a live chart result.
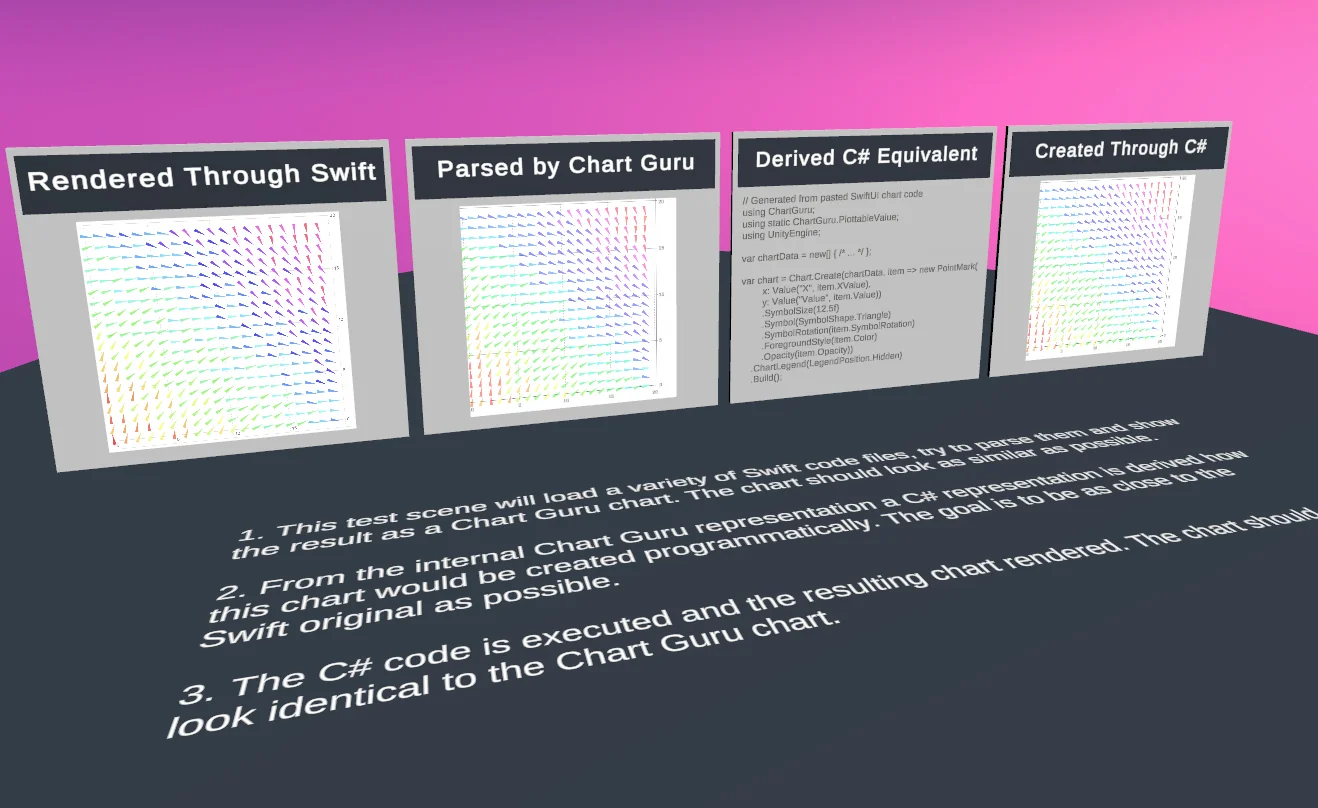
Pipeline from left to right: Swift screenshot, parsed result, generated code from parsed result, and chart created through programmatic way. The first two should match as good as possible, the last one needs to be identical.
There is also a big difference between saying “the output matches” and showing a reference render, a generated render, an overlap view, and a delta image.
That behind-the-scenes material belongs in the article because it explains why Chart Guru took so many commits. The hard part was not producing one convincing screenshot. The hard part was building a system that could keep proving itself as the supported surface grew.
This is also where the project became more disciplined. The validation work caught importer regressions, generated-code regressions, rendering differences, and release readiness issues. It made the work less dependent on taste and more dependent on evidence.
SDF Shaders and the Rendering Layer
Once the authoring and verification loops were in place, the renderer still had to make the output feel native.
Chart Guru is not placing a static image into Unity. The chart geometry is rendered through Unity, with custom shaders for bars, lines, areas, sectors, points, grids, shadows, and anti-aliased GL paths. Text is handled separately through surface-native systems: TextMeshPro on Canvas, UI Toolkit labels where appropriate, and IMGUI labels in editor previews.
The SDF shader work is part of why the final output feels polished. Rounded bars use a signed-distance rounded-rectangle shader. Point symbols use SDF shapes for circles, squares, diamonds, triangles, crosses, and stars. Pie and donut sectors use distance-field logic for clean arc edges. The GL anti-aliasing shader uses signed distance from the edge to blend line edges smoothly.
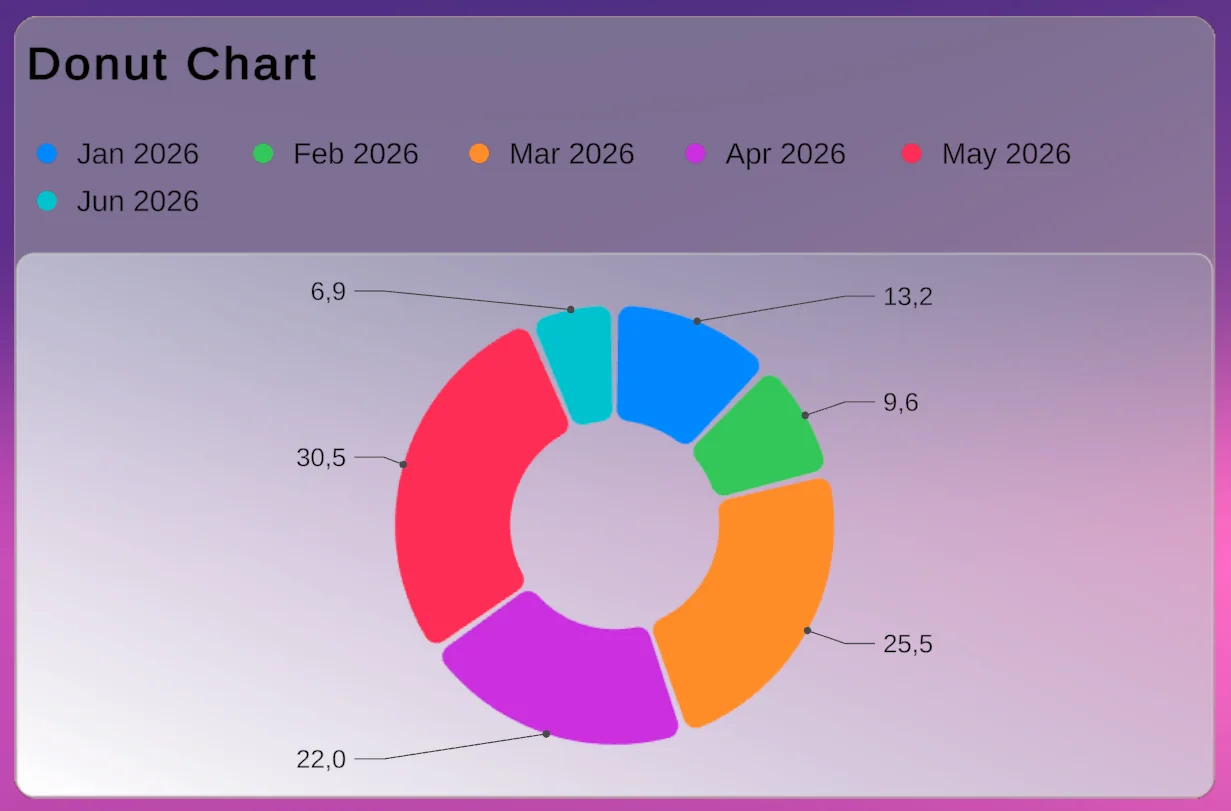
Rounded corners in chart segments, plot area and chart area
That sounds like low-level rendering trivia until you look at the product requirements. Swift Charts parity is full of small shape details: rounded corners, symbol families, line widths, sectors, borders, shadows, dense grid lines, and plot overlays. If those edges look rough, the whole product feels less like a native charting tool and more like a collection of drawn primitives.
The shader layer also had to survive Unity realities: built-in pipeline projects, URP projects, editor previews, render textures, texture output, and charts used in other Wetzold Studios tools. That is why rendering polish belongs in the history. The final magic depends on it, even when the user never sees the shader names.
Charts as Textures: The LED Studio Bridge
The LED Studio integration is a good example of that rendering architecture turning into a product story.
Chart Guru already renders chart geometry into a RenderTexture. That is efficient for normal UI because the chart can be displayed as one UI quad instead of a large hierarchy of objects. But the same decision also makes the output portable. Once a chart is a texture, it can feed another Unity system without that system needing to understand bars, axes, labels, marks, legends, or Swift Charts-inspired APIs.
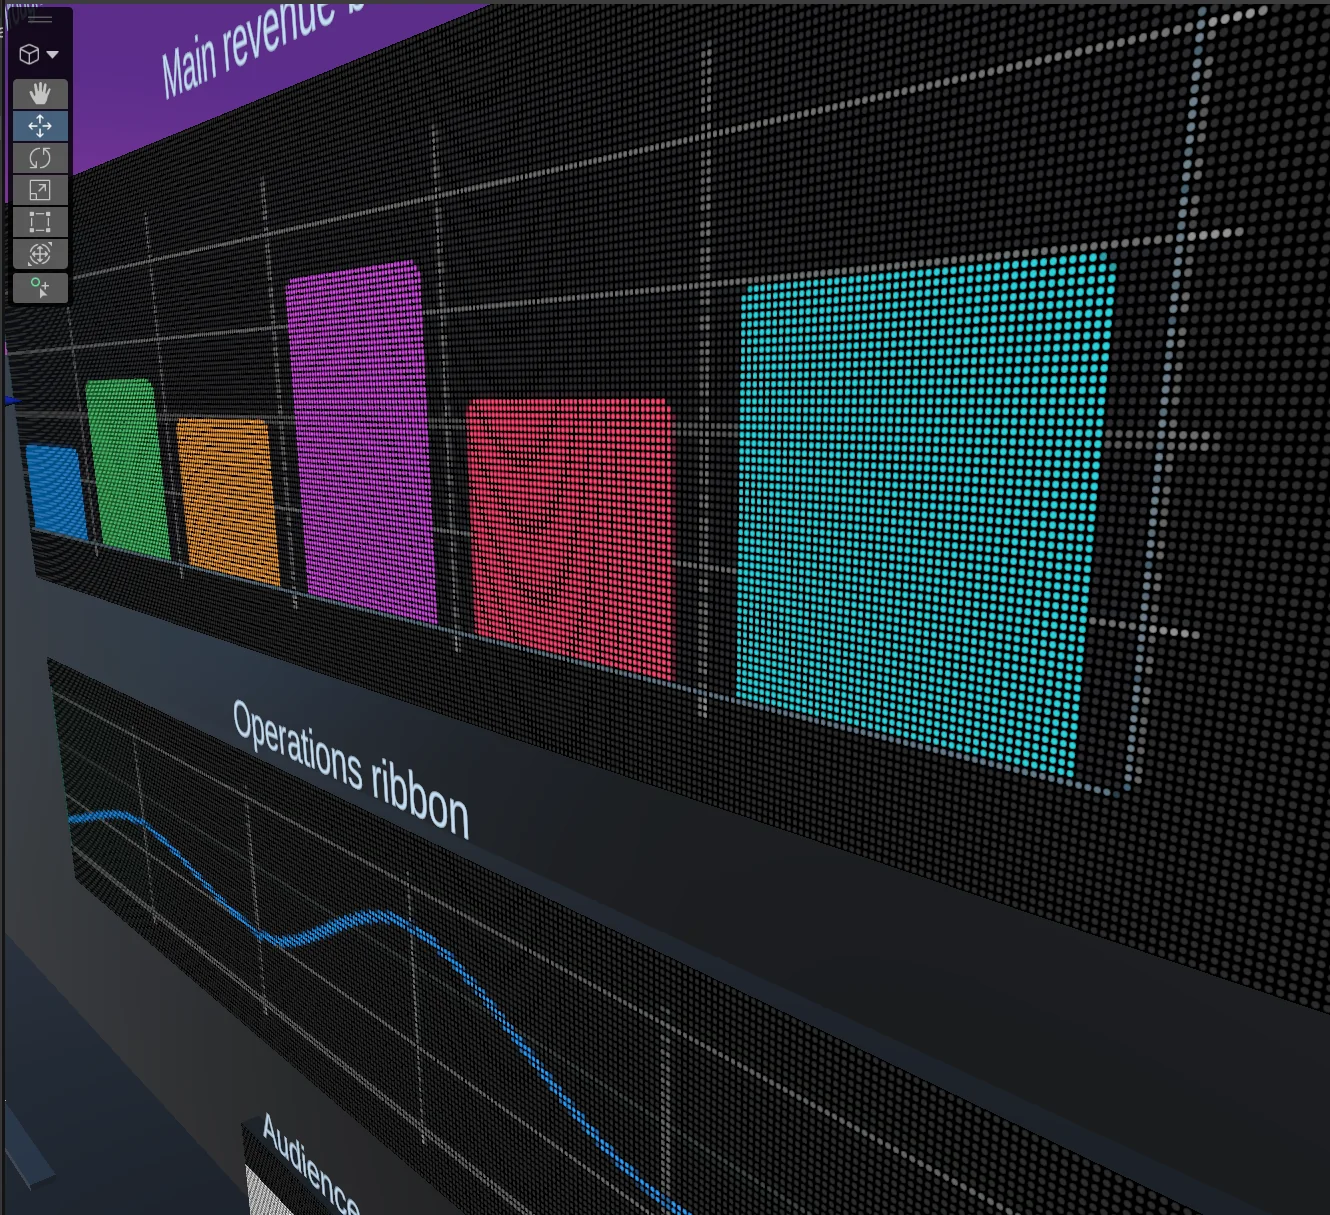
Chart Guru output mapped onto an LED Studio board: the chart remains a live Chart Guru chart, while LED Studio receives it as a texture.
The integration stays intentionally small. Chart Guru exposes texture output from ChartGraphic: a fast geometry texture, or a composed texture that also includes TextMeshPro labels, titles, data labels, and legends. The LED Studio side uses a LedChartDataSource that watches the chart, refreshes the output only when needed, and exposes the result as the LED source texture.
That is the right kind of integration. It does not create a second chart renderer for LED Studio. It does not ask LED Studio to learn Chart Guru internals. It simply turns a live chart into a texture and lets the LED compositor do what it already does well.
This is also why the integration belongs in the broader Chart Guru story. The same output path can drive a UI, a board, a material, a venue wall, or any other Unity workflow that accepts a Texture. The feature looks like a small bridge between two assets, but it only exists because the renderer was designed around reusable texture output from the beginning.
The 3D Add-On: Parity Without Blurring Boundaries
Chart Guru’s 3D story is another example of turning a strong foundation into broader product reach without blurring package boundaries.
The core package is the 2D Swift Charts-inspired charting surface. ChartGuru.3D is an optional add-on. That separation matters. It keeps the core package focused and avoids making every user pay for 3D systems they may not need, while still letting the product follow Apple’s newer Chart3D direction. [November 2026: since version 1.4, Chart Guru 3D is included with Chart Guru at no extra cost. It stays a separate module inside the package, and the 2D core still does not depend on it.]
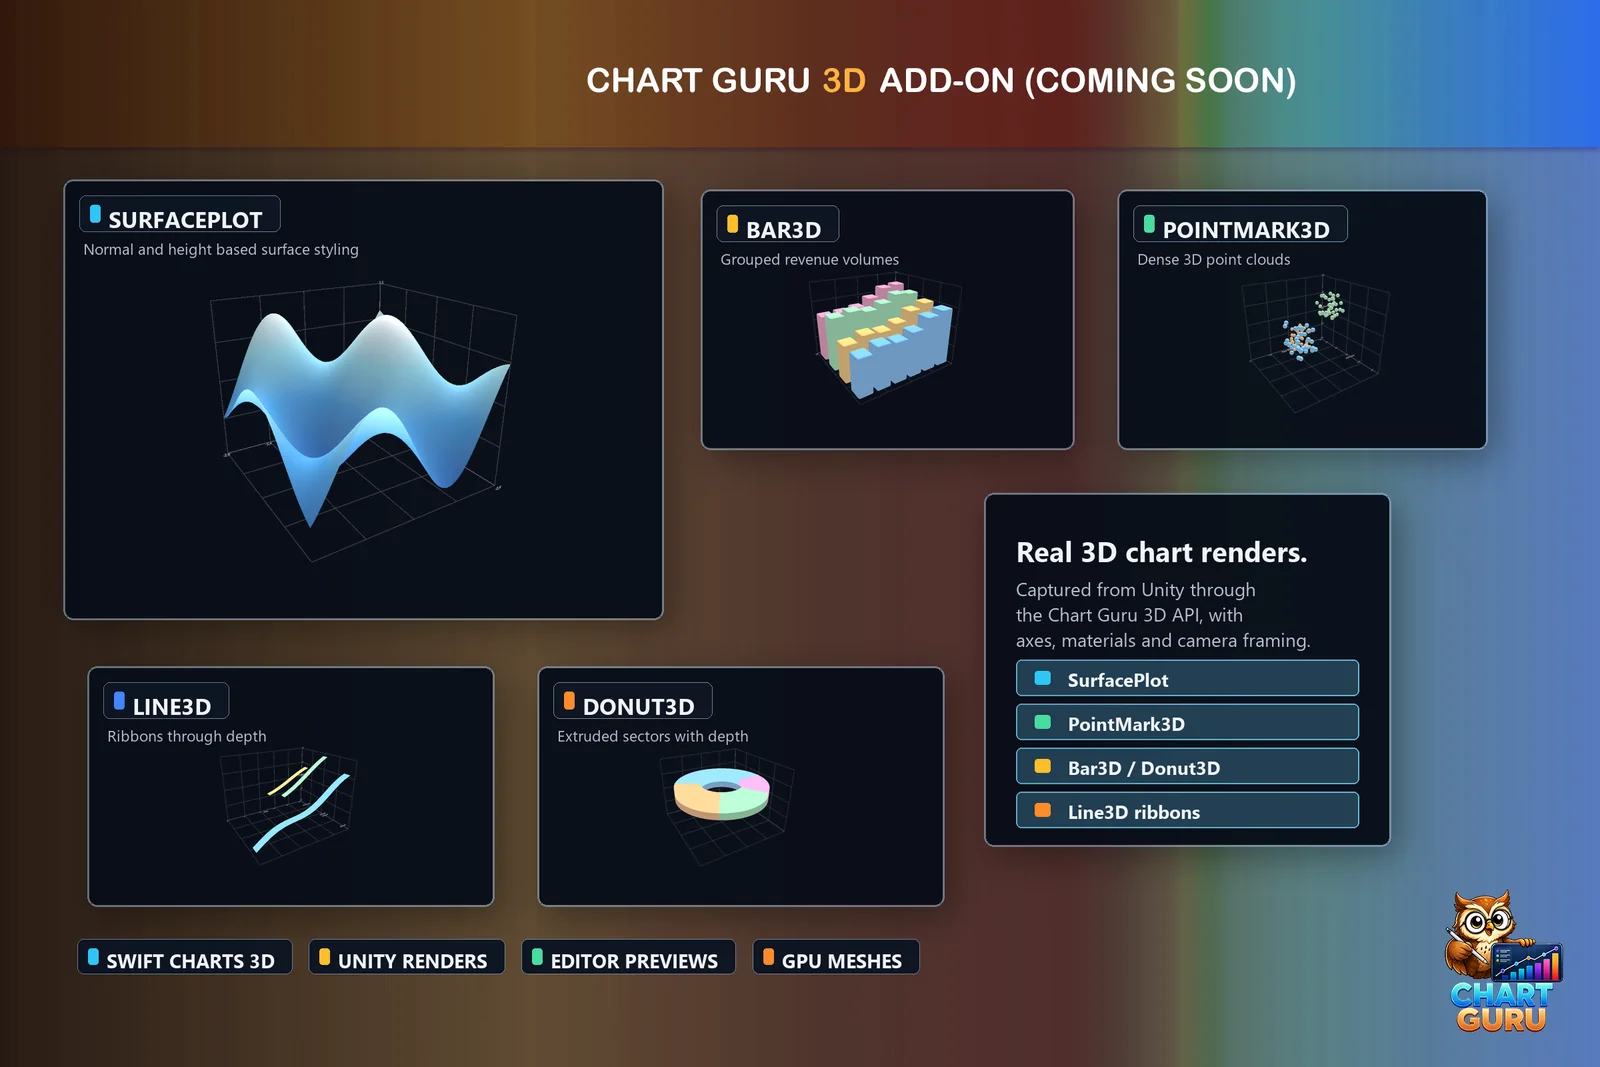
ChartGuru.3D extends the Swift Charts-inspired model into Unity 3D scenes with surfaces, 3D marks, extruded chart types, poses, lighting, and interaction.
The parity target is Apple’s Chart3D vocabulary: Chart3D, 3D point, rule, rectangle, and surface plot concepts, Z axes and scales, pose, camera projection, 3D symbols, and surface styling. ChartGuru.3D mirrors those concepts where they map cleanly to Unity.
But Unity opens doors that SwiftUI does not need to open. The add-on also includes Unity-native extensions: extruded 3D bars, line ribbons, area prisms, 3D pie and donut charts, radar and scatter variants, snapshots, world-space mesh hosts, orbit controls, themes, lighting, and 2D-to-3D morph recipes.
The important part is that those extras are not disguised as Swift parity. The parity document separates them deliberately. Some rows mean “this is the Chart3D concept in Unity.” Other rows mean “this is extra value because Unity can render and interact with actual 3D geometry.”
That distinction became part of the product philosophy. Chart Guru could be inspired by Swift Charts without pretending Unity is SwiftUI. The best version of the port keeps the mental model familiar, then uses Unity’s strengths where they genuinely add something.
Release Polish Is Product Engineering
The final phase was not only cleanup.
It was product engineering.
A tool is not finished when the core renderer works. It is finished when the user can discover it, understand it, trust it, and recover from mistakes. For Chart Guru, that meant documentation, polished screenshots, package boundaries, samples, editor menus, UI Toolkit workflows, shader validation, generated examples, and release checks.
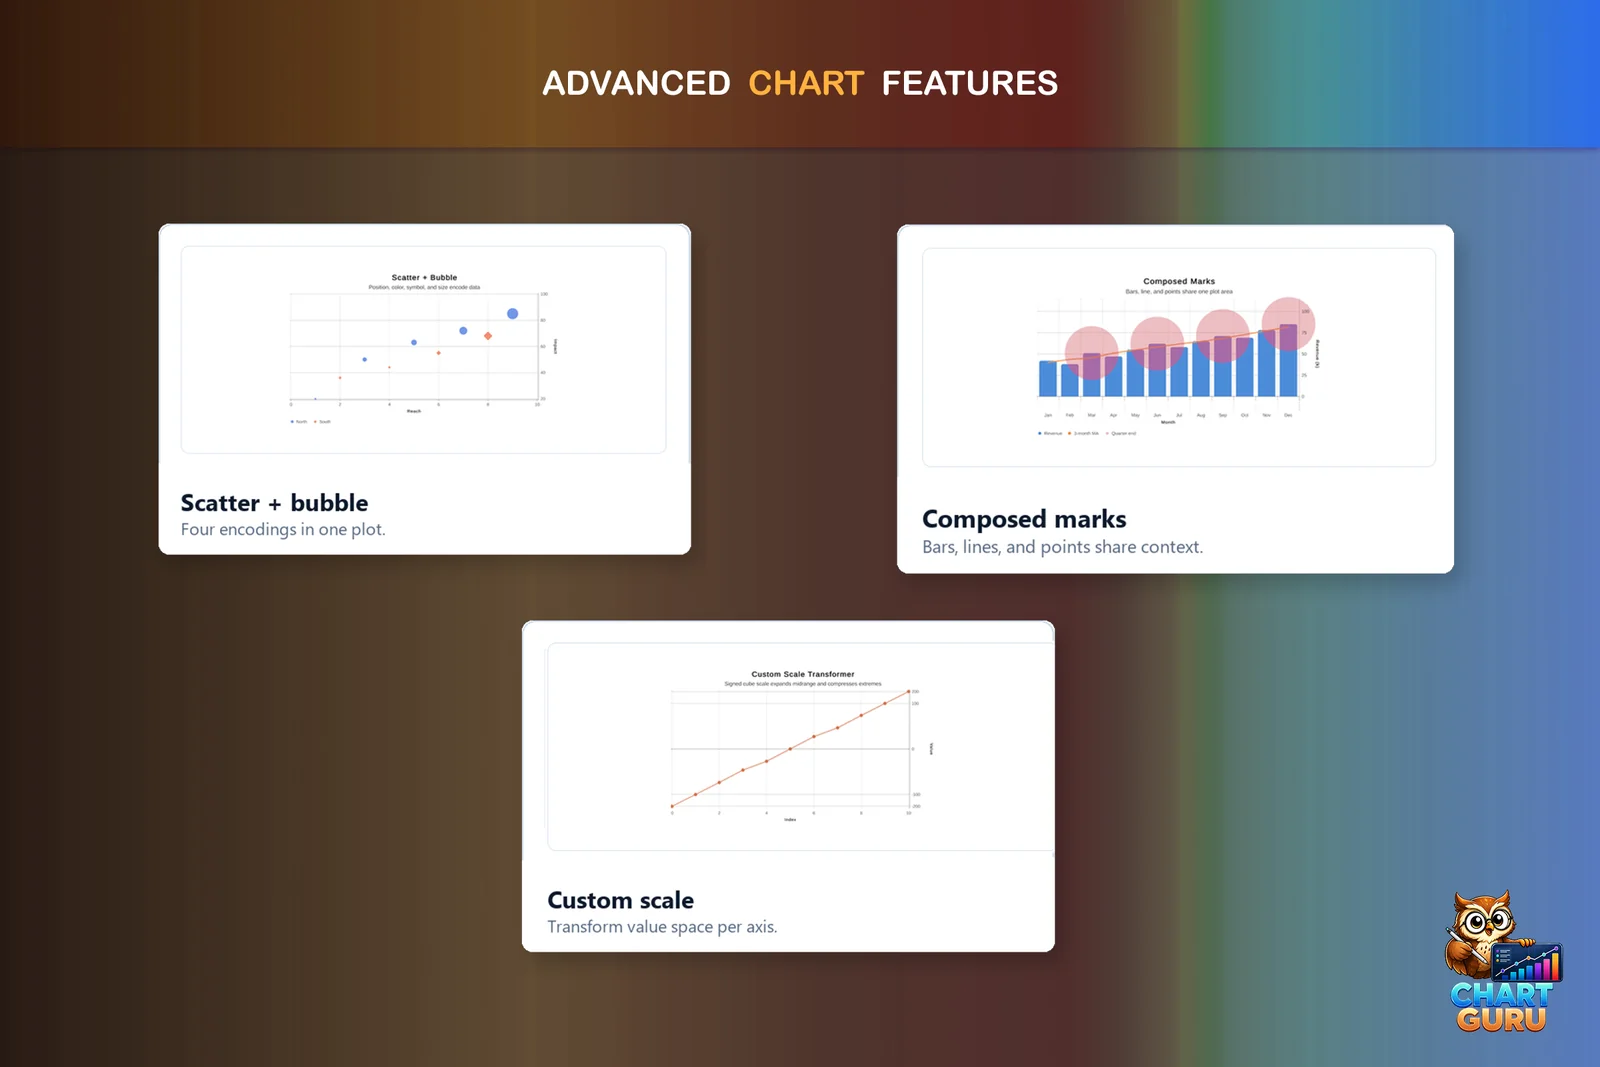
The final screenshots combine chart variety, advanced plots, customization, and release-ready polish.
The polished store screenshots matter because they show the product from the outside. They show chart types, customization, Swift import, comparison, performance, data sources, designer workflows, 3D charts, trend lines, function plots, and interaction. But the story behind them is the long internal path that made those screenshots honest.
Chart Guru also had to fit into the larger Wetzold Studios ecosystem. It needed shared Common infrastructure without becoming tangled with other tools. It needed optional integration boundaries. It needed documentation built from real output. It needed package validation that would not ship missing scripts, broken references, or editor-only runtime mistakes.
That kind of polish does not look dramatic in a single commit. It accumulates.
The Gallery as the Final Contract
The Chart Gallery is a good final image for the story because it shows Chart Guru as a product, not just a renderer or importer.
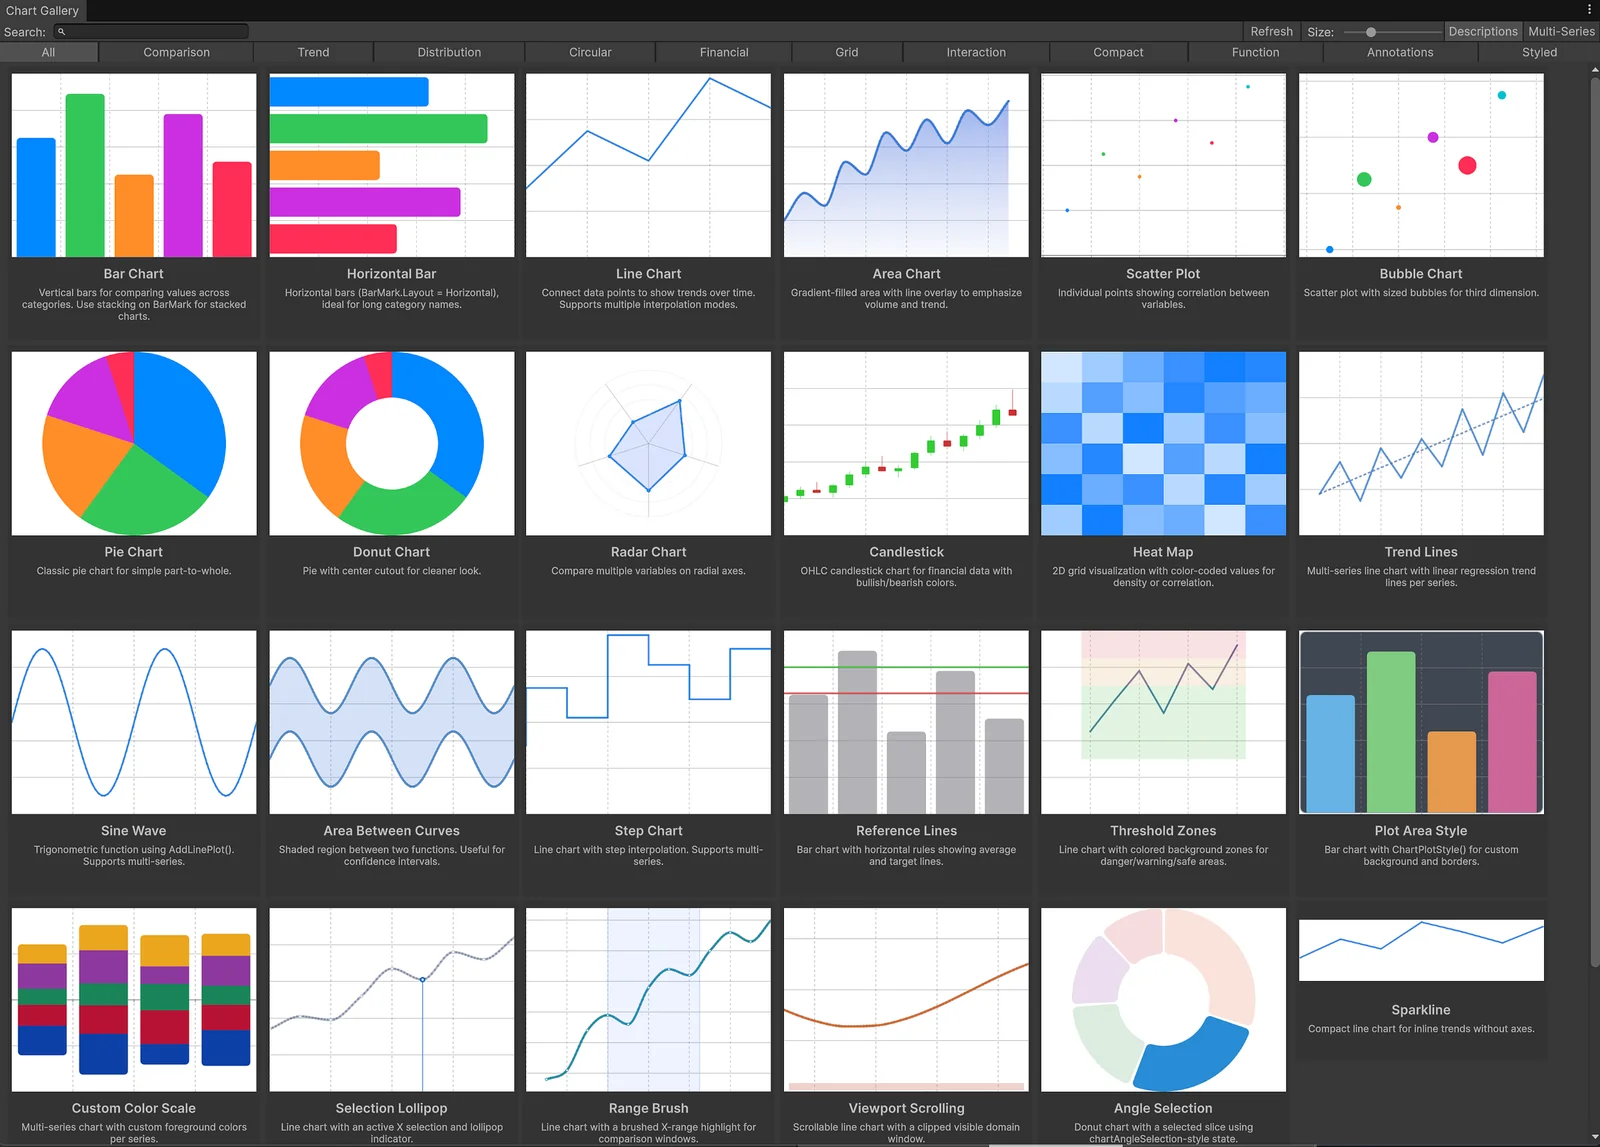
The Chart Gallery collects live examples across comparison, trend, distribution, circular, financial, grid, interaction, compact, function, annotation, and styled chart categories.
The gallery is a browsable catalog of live chart configurations. Each card is a small promise: this chart type works, this feature has a visible example, this configuration can be inspected, and this is not just a hidden API surface. [November 2026: since version 1.4, it is the searchable 2D Gallery with chart-family filters and Swift Charts compatibility badges, next to a 3D Gallery. The online gallery shows renders from the same renderer.]
It also connects the earlier story threads. The gallery uses the same renderer. It reflects the same defaults. It gives the Designer real starting points. It gives documentation and store screenshots honest source material. It gives a developer a place to explore chart families without reading every API call first.
That is why I like it near the end. After all the parser work, code generation, layout debugging, SDF shaders, texture output, verification scenes, and release polish, the gallery is what the user sees: a wall of working possibilities.
The Final Magic
The final version of Chart Guru is interesting because it compresses a lot of work into a simple experience.
You can build charts fluently in C#.
You can design charts visually and still get generated C#.
You can use the Chart Gallery, editor tooling, and sample scenes to explore chart types.
You can import Swift Charts-style examples and inspect the generated Chart Guru C#.
You can verify output visually.
You can use live data, dense layouts, annotations, labels, axes, legends, gradients, trend lines, and advanced plots.
You can extend into ChartGuru.3D when the chart belongs in a world-space or 3D visualization workflow.
You can render charts as real Unity output instead of static images.
You can rely on the renderer, text layer, and SDF shader details that make the output feel crisp instead of approximate.
You can move chart output into adjacent workflows as live textures, including integrations such as LED Studio.
That is the part that feels magical now: not that a chart appears, but that the entire path from idea to generated code to live Unity output is visible and usable.
The project started with the obvious question: how do we draw charts in Unity?
It ended with a better one: how close can Unity chart authoring get to the clarity of Swift Charts while still feeling native to Unity and C#?
Chart Guru is the answer that came out of hundreds of commits, several wrong turns, a separate product born from test data, and a lot of patient visual verification.
Asset Store: Chart Guru on the Unity Asset Store
An earlier version of this article was published on Medium.
Easy, reliable charts for Unity, from sparklines to multi-series 3D.
Keep reading
 Use case
Paste Swift Charts code into Unity
Chart Guru reads supported Swift Charts code pasted into the Chart Designer or a chart Inspector, draws the chart in Unity and writes PascalCase C#. Diagnostics name everything it skipped, and nothing is invented.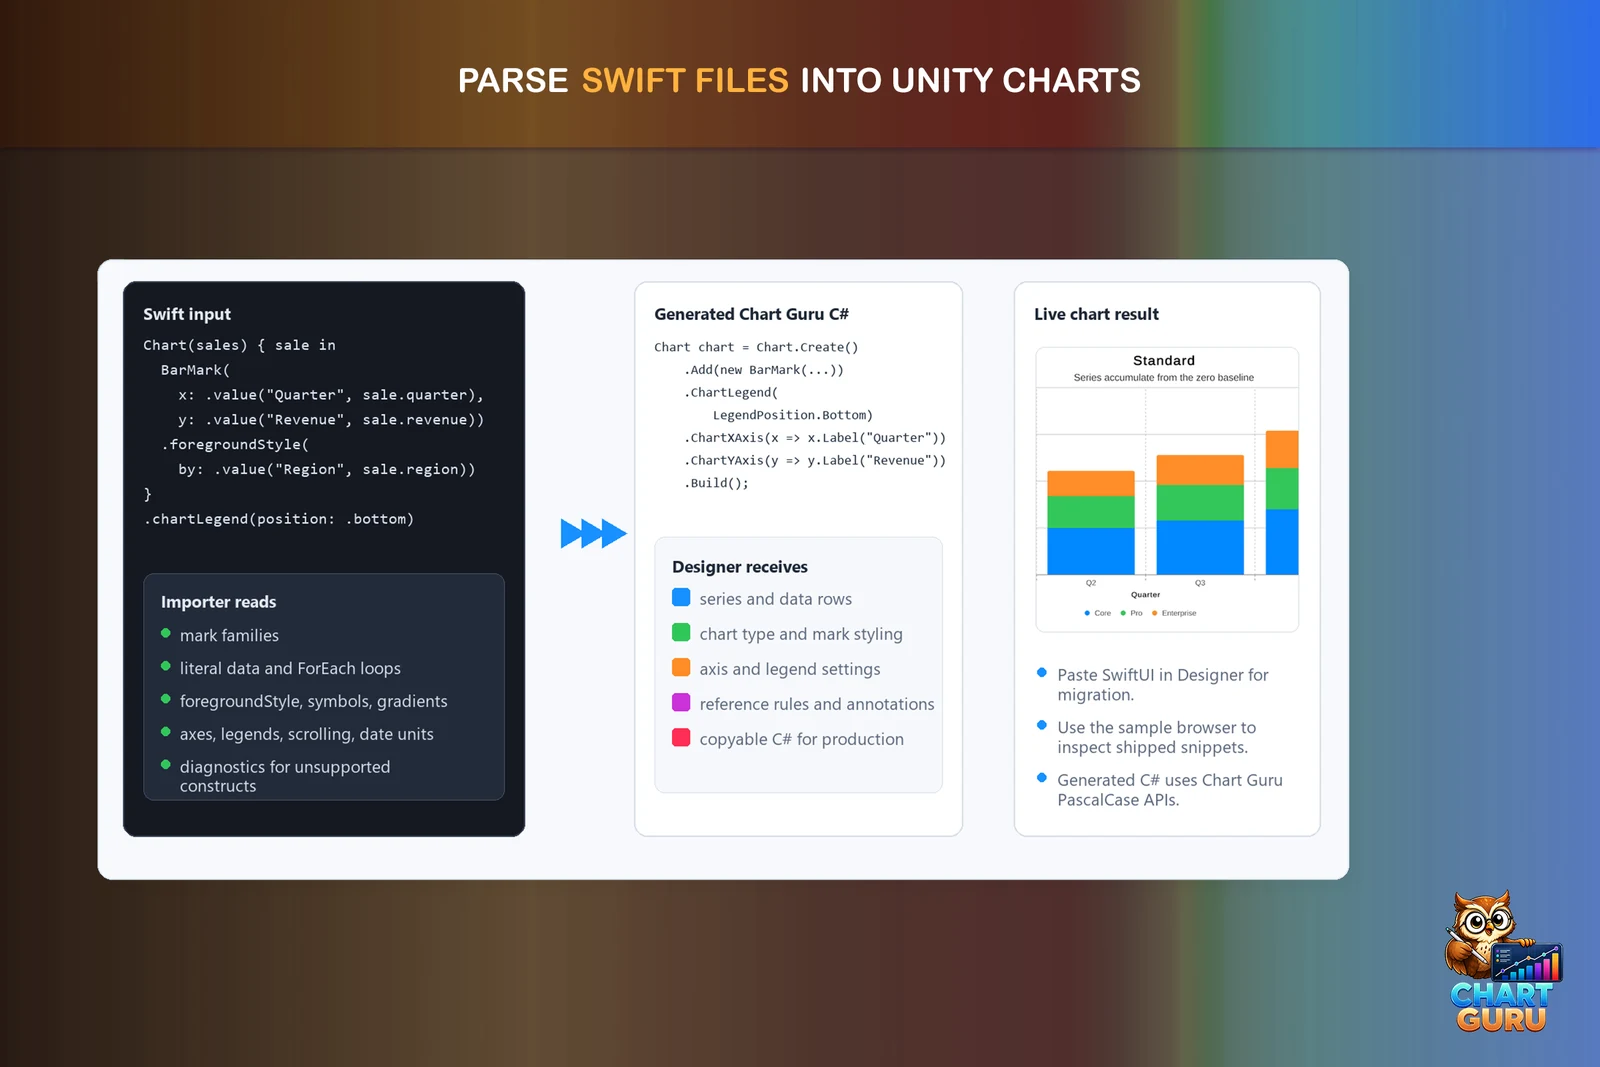 Article
Swift Charts to Unity C#: API cheat sheet
A side-by-side map from Swift Charts to the Chart Guru C# API for Unity, with honest notes on partial rows and the naming rule that turns lower camel case into PascalCase.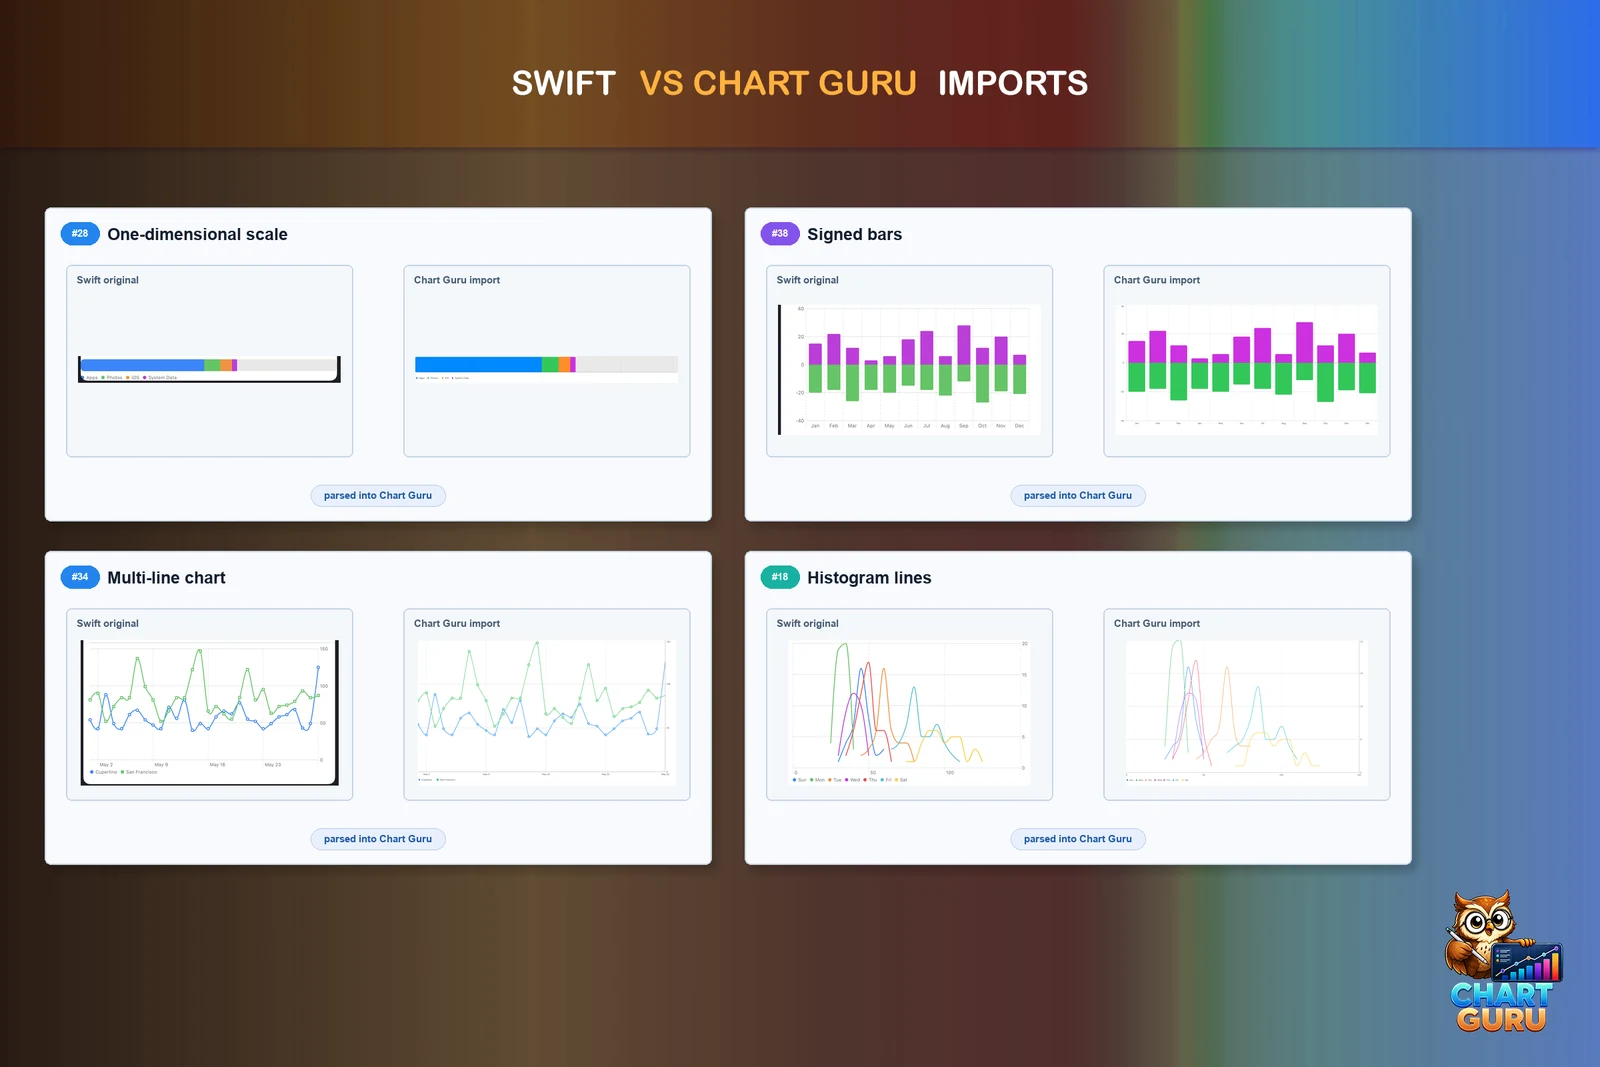 Article