Real-time graphs in Unity without GC spikes
Why live graphs in Unity stutter, and how a thread-safe ring buffer, once-per-frame publishing and in-place updates keep streaming charts free of GC spikes.
A live graph has two jobs that pull against each other. It must accept data at whatever rate the data arrives, from a sensor, a socket, a simulation or a market feed, and it must still finish every frame on time: at 60 frames per second, that is 16.7 milliseconds for everything. When live graphs in Unity stutter, the cause is rarely the drawing itself. It is the work around it: rebuilding things that did not need rebuilding, and allocating memory that the garbage collector later reclaims in the middle of a frame.
Why naive live graphs stutter
Redrawing a texture every frame
Plotting into a Texture2D looks simple: clear the pixels, draw the new line with SetPixels, call Apply. But the CPU rasterizes the whole graph again for every update, and Apply uploads the entire texture to the GPU each time. The cost follows the texture’s area, not the number of new samples, and lines drawn pixel by pixel come out jagged unless you add your own anti-aliasing. Unity’s forums have threads about slow texture-based graphs going back to 2011.
Rebuilding objects or meshes for each point
Spawning a GameObject or a UI Image per data point, and destroying it when the point scrolls out, costs an instantiation, a destruction and garbage for every sample. In uGUI, a changed element also makes its Canvas rebuild its batches, so hundreds of moving images keep the Canvas busy every frame. Regenerating one mesh is cheaper, but if every update creates new vertex arrays, the object churn simply turns into garbage.
Allocating on every update
A new array or list per update, LINQ queries, ToString for every tick label each frame, closures and boxing: each allocation is small, but at 60 updates per second they add up, and the garbage collector eventually pauses the main thread to reclaim them. Unity’s incremental garbage collector spreads that work over several frames, which softens the spike. A steady state that does not allocate avoids it.
How Chart Guru streams data
Chart Guru separates where values come from, the data source, from how they are drawn, the chart definition. That separation is what makes cheap updates possible: as long as the data keeps its shape, the chart writes new values into the marks it already has.
A thread-safe ring buffer
RingBufferChartDataSource holds a fixed number of samples. Push(y) and Push(x, y) are thread-safe and O(1), so a socket reader, a serial port thread or your Update method can write into it directly. Once the buffer is full, each push replaces the oldest sample and the published frame is updated in place, so steady streaming allocates nothing.
// On a saved Line chart, or on a parent of several charts without their own dataRingBufferChartDataSource buffer = gameObject.AddComponent<RingBufferChartDataSource>();buffer.Capacity = 600;buffer.SeriesName = "Pressure (bar)";
// From the main thread or from a worker threadbuffer.Push(reading);
The component is hidden from the Add Component menu, so you add it from code. A source on a parent feeds every chart below it that has no data of its own, so one buffer can drive several 2D and 3D charts at once.
Publish at most once per frame
Pushing does not redraw anything. The buffer publishes in LateUpdate, at most once per frame, so a source that delivers many samples between two frames still causes a single chart update. Write your own sources the same way: change every column you need, then publish once.
Update values in place
For data with a fixed shape, meaning the same columns, the same row count and the same categories, Chart Guru updates existing marks instead of compiling the chart again:
- A chart you built in code: call
chart.SetValues(values)when only Y values change and the number of marks stays fixed. Thefloat[]overload updates without copying your array. - A saved chart: call
host.SetData(frame, shapeChanged: false)with a frame whose columns, row count and categories are unchanged. Anything else rebuilds once, which is the right response to a real shape change. - Your own source: derive from
ChartDataSource, keep the columns you published, overwrite them and publish a value change.
using ChartGuru;using UnityEngine;
public sealed class SensorSource : ChartDataSource{    readonly float[] _values = new float[256];    ChartDataColumn<float> _level;
    public override void Refresh()    {        _level = new ChartDataColumn<float>("Level", _values);        Publish(new ChartDataFrame(_level));    }
    void OnEnable() => Refresh();
    void OnDisable() => ClearFrame();
    void Update()    {        if (!Application.isPlaying || _level == null) return;        // Write the latest readings into _values here, keeping its length        OverwriteValues(_level, _values);        PublishValueChange();    }}
Bound charts then update their marks in place and rebuild only when new values regroup marks, for example when a category changes.
Pooled text and allocation tests
Labels are pooled, so ticks and data labels that move or change their text reuse existing objects. Chart Guru’s own test suite holds the steady path to account: after a warm-up, it repeats updates such as SetValues on a 2,048-point line chart, in-place definition updates, data frame bindings, axis label layout, moving labels and rendering to a texture, and each test fails if the update allocates a single managed byte. Chart Guru 3D follows the same rule for surfaces, points, bars, lines and areas, which update in place without recompiling and without allocating once warm.
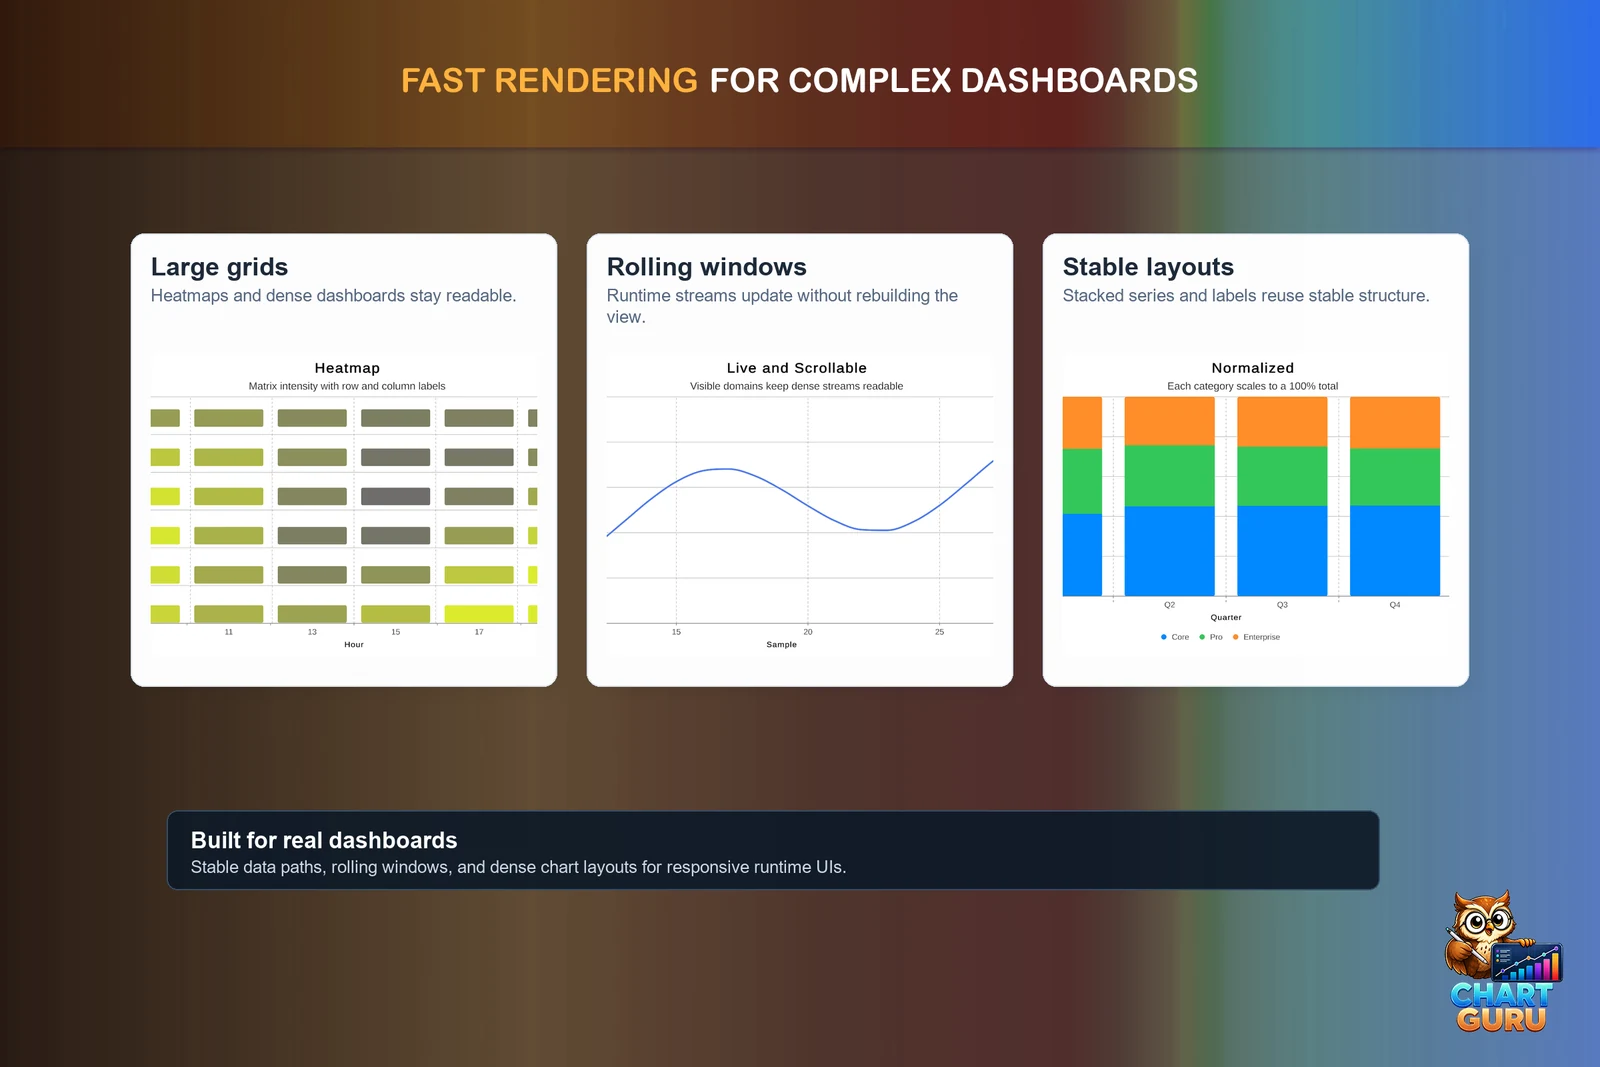 Heat map grids, rolling live windows and stacked layouts that keep their structure while values change.
The performance guidance in practice
The manual’s performance guidance comes down to a few rules:
- Use
SetValuesfor code-built charts when only Y values change and the mark count stays fixed. - Use
SetData(frame, shapeChanged: false)on saved charts only when columns, row count and categories are unchanged. - Hide dense data labels on large charts. Labels are pooled, but thousands of visible labels are hard to read and still cost rendering time.
- Use compact charts, such as Sparkline, MiniBar, MiniPie, MiniDonut and Indicator, for small dashboard signals instead of full charts with axes and legends.
- Use
RingBufferChartDataSourcefor frequent samples instead of rebuilding a chart for every event. - Keep a chart’s RenderTexture close to its displayed size; oversized charts cost memory and fill rate.
- Reuse
ChartGraphicandChartinstances when dashboards update, instead of destroying and recreating UI objects.
Two more rules come from the AI skills that ship with the package: build a static chart once, in Start or when its data changes, never in Update, and coalesce events that arrive faster than your frame rate instead of starting a transition for each one.
To test before your real feed exists, the included Mock Magic generator streams rows in constant, random, burst and drip rhythms, and mock candlesticks continue from the previous close. For market data, YahooFinanceChartDataSource loads OHLCV candles for a symbol from Yahoo’s public chart endpoint, which suits examples and prototypes; the trading and finance use case covers live candles.
What 35,136 points look like
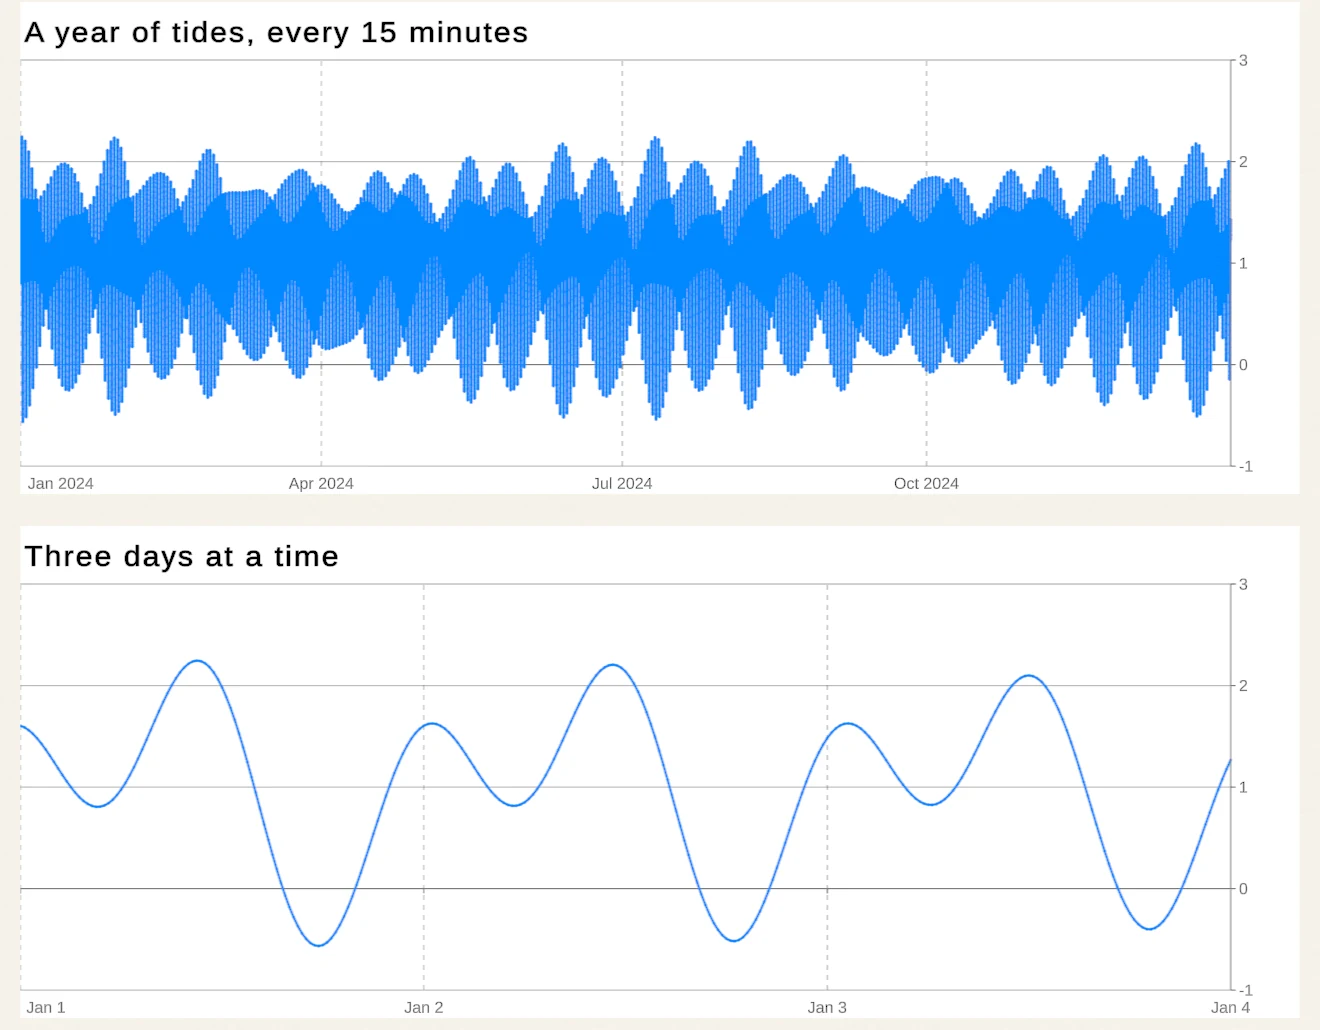
The Large Datasets lesson in the samples needs no download. A custom data source predicts a year of tides for 2024 every 15 minutes, the way tide tables are made, as the sum of eight harmonic constituents: 366 days of 96 samples, 35,136 rows. It computes the frame once and publishes it to both charts that read it. One line chart draws the whole year; the other shows a three-day window of the same frame that you scroll by dragging and zoom with the mouse wheel or a pinch.
The Live Data lesson covers the streaming side with real data. It replays the hourly electricity demand on the Texas ERCOT grid for August 2024, 744 hours from the U.S. Energy Information Administration, into ring buffer sources at four recorded hours per second. One buffer keeps the last 24 hours and one the last 72, so both charts scroll while their marks update in place.
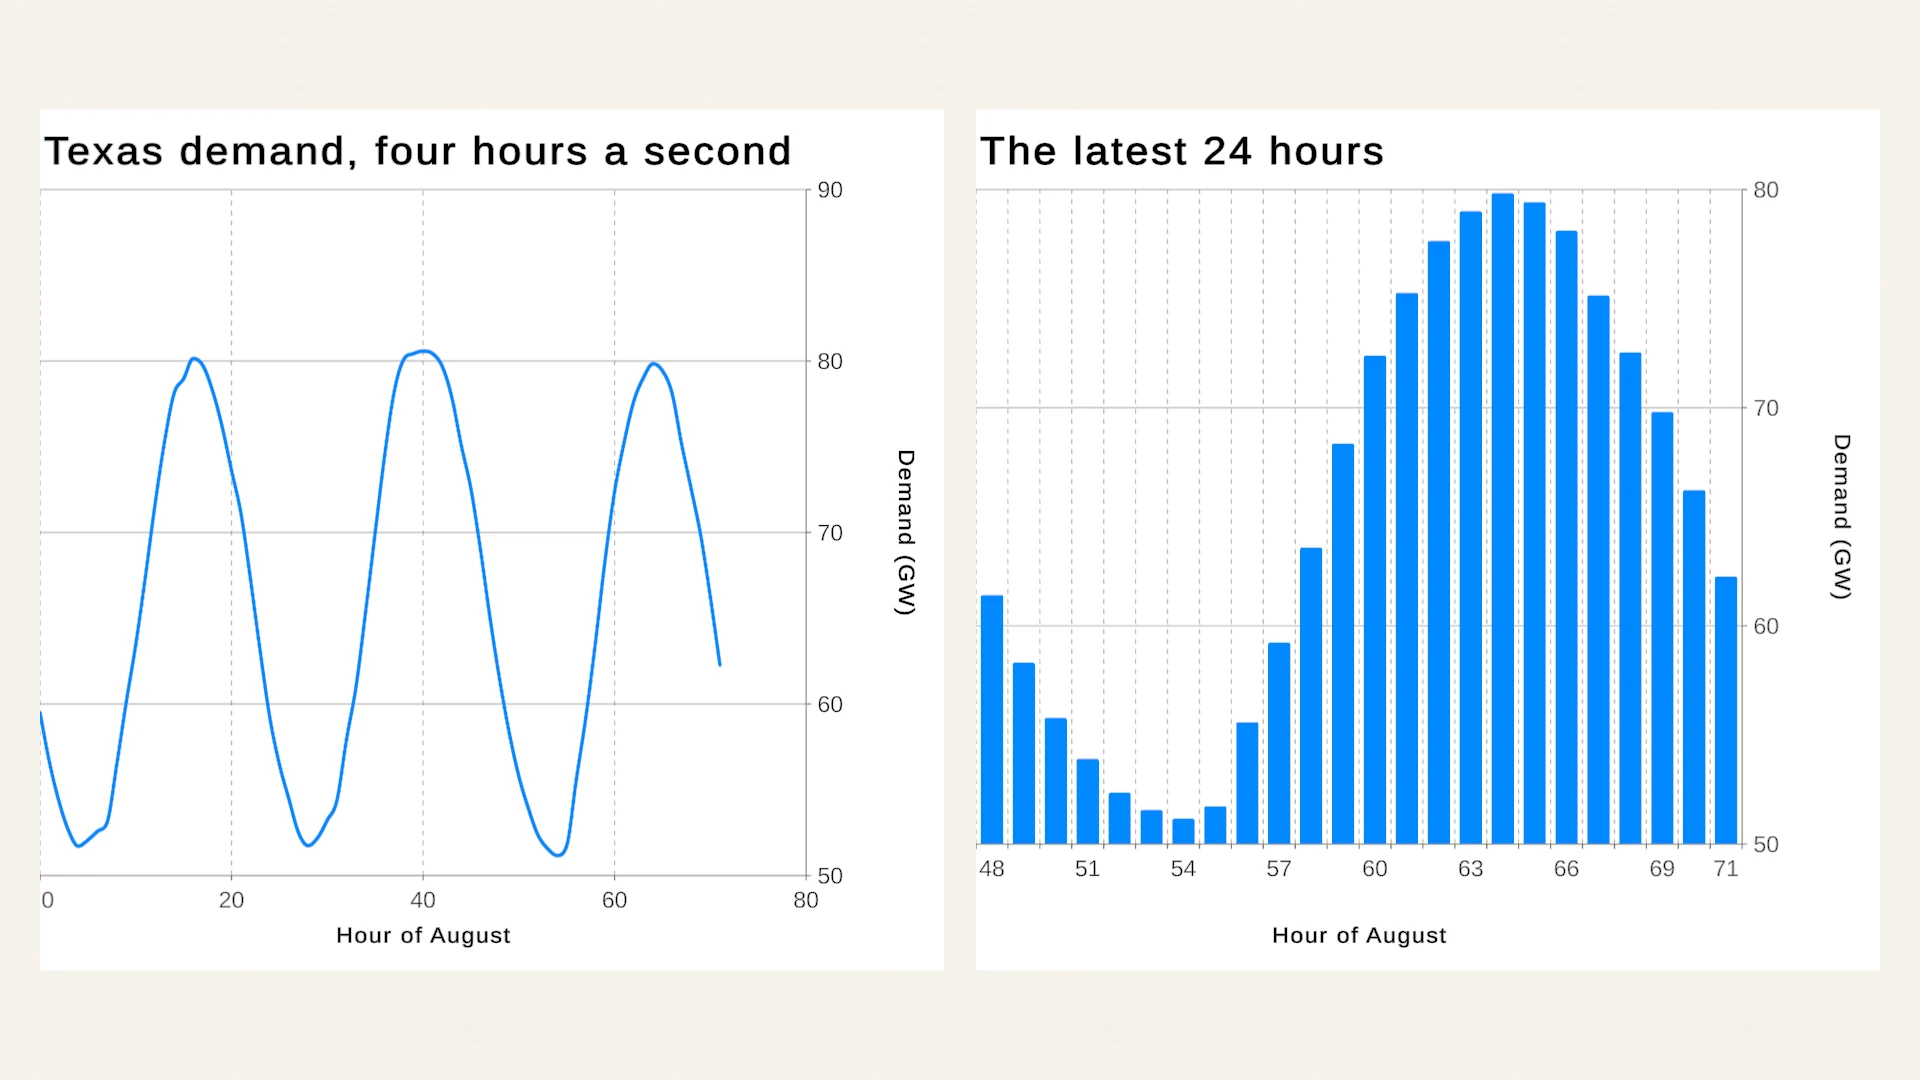 The Live Data lesson: recorded hourly demand replayed into ring buffers, one chart per window length.
Both lessons ship with Chart Guru, which costs US$29 on the Asset Store (November 2026) and includes Chart Guru 3D and Mock Magic.
Measuring your own case
Chart Guru does not publish frame-time figures for its streaming path yet. The cost depends on how many marks are visible, the render size, the labels and the device, so measure the case you ship:
- Build a development player for the target device and record a few hundred frames with the Unity Profiler while the chart updates.
- Check the GC Alloc column: after warm-up, steady
SetValuesupdates and ring buffer pushes should allocate nothing, which is what the test suite requires of them. - Compare main-thread time with and without data labels, and at the chart’s display size against a larger RenderTexture, since labels and fill rate dominate dense charts.
Frequently asked questions
Can I push data into a Chart Guru chart from another thread?
Yes, through RingBufferChartDataSource. Push is thread-safe and O(1), and the buffer publishes to its charts at most once per frame on the main thread. Custom sources that overwrite their own published columns must do that on the Unity thread.
Do Chart Guru updates allocate memory?
Steady updates that keep the data's shape are built not to. Value-only updates reuse unchanged columns and marks, a full ring buffer overwrites its frame in place, and the package's tests fail if warm updates such as SetValues allocate managed memory. Changing columns, row counts or categories rebuilds the chart once.
How do I test a live chart before the real data feed exists?
Add a Mock Chart Data Source and start streaming. The included Mock Magic generator emits rows in constant, random, burst or drip rhythms, continues the pattern when it appends, and continues mock candlesticks from the previous close.
Easy, reliable charts for Unity, from sparklines to multi-series 3D.
Keep reading
Use caseReal-time graphs for live and high-volume data in Unity
Chart Guru streams live values into Unity charts through a fixed-capacity ring buffer you can push from any thread, web sources that poll with backoff, and your own adapters. Stable updates are tested to allocate nothing after warm-up.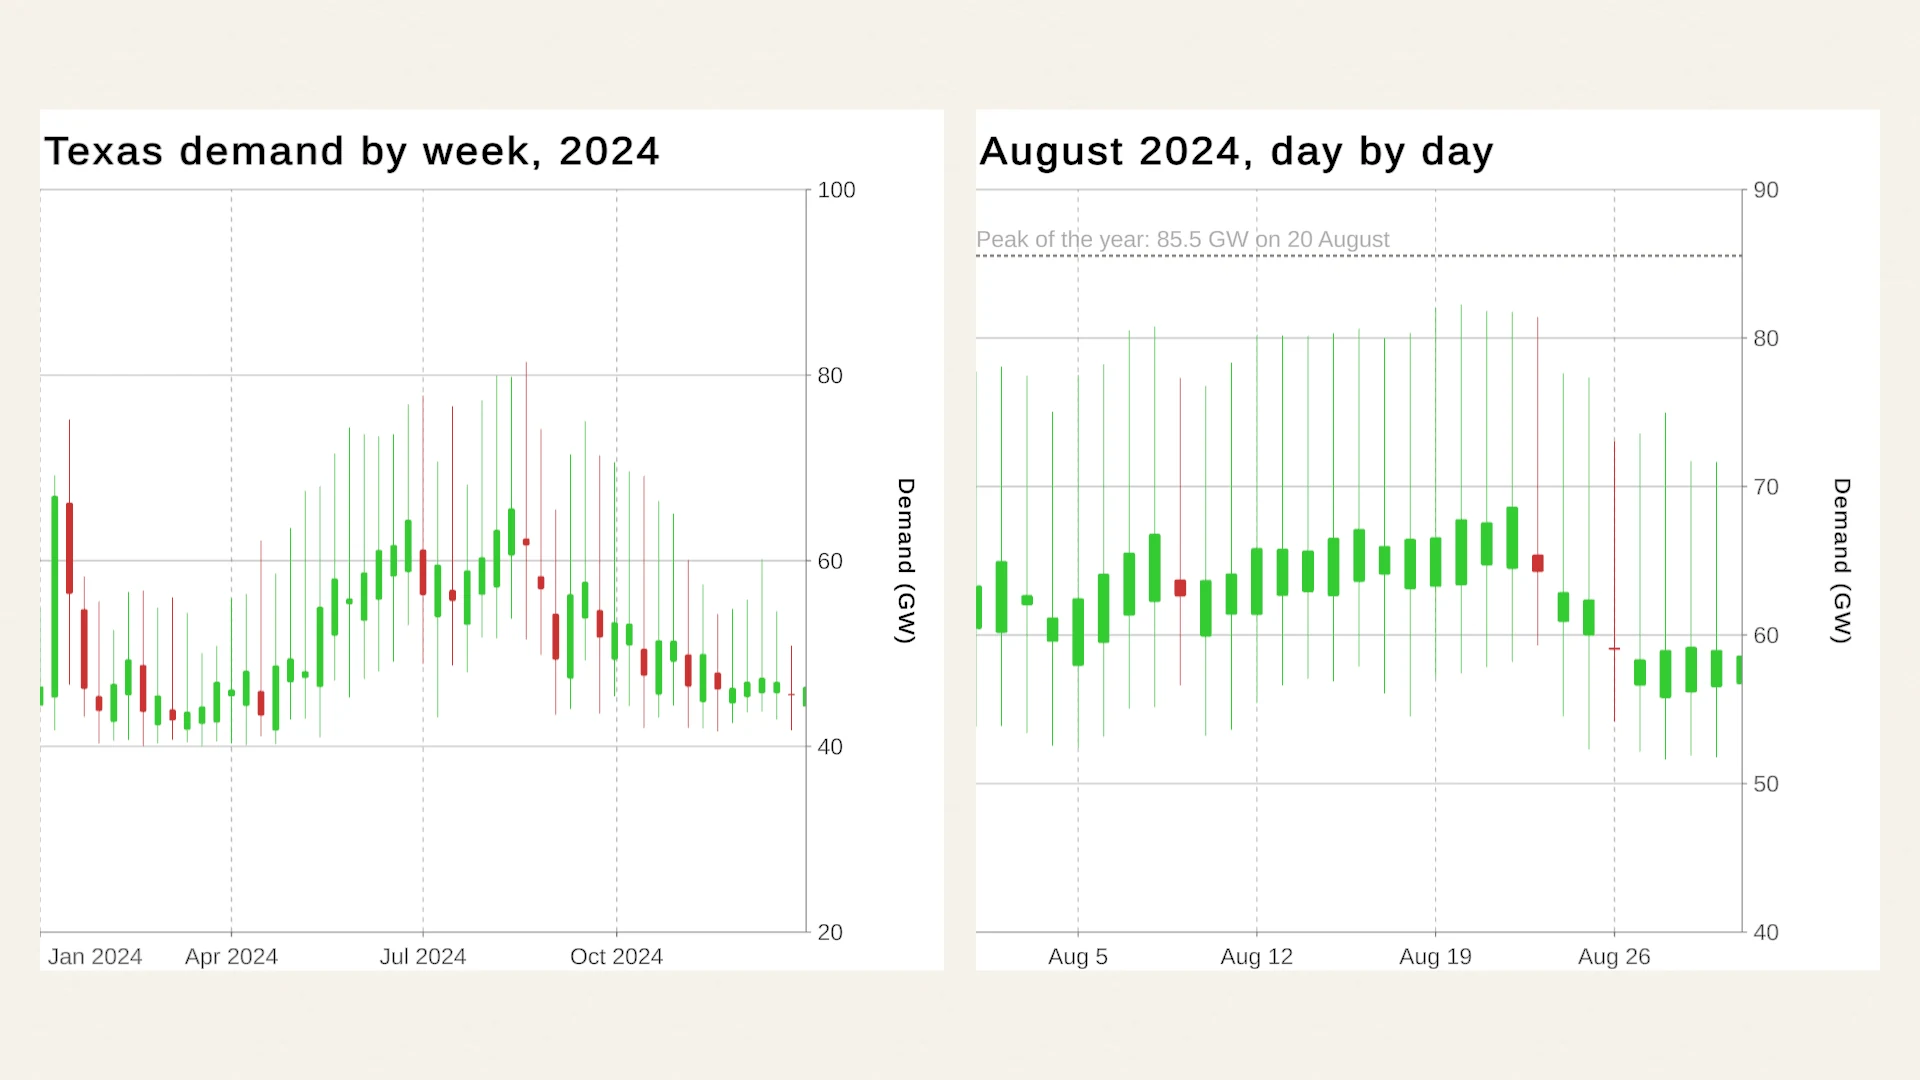 Use case
Live candlestick charts for trading games and finance apps
Chart Guru draws OHLC candlesticks in Unity from Yahoo Finance for prototypes, a licensed feed through the Web source, or mock streams that open at the previous close, with volume, waterfalls, scrolling, zoom and tooltips. Use case