Swift Charts to Unity C#: API cheat sheet
Swift Charts code next to its Chart Guru C# equivalent in Unity: marks, modifiers, axes, scales, legends, selection, scrolling, animation, accessibility and Chart3D.
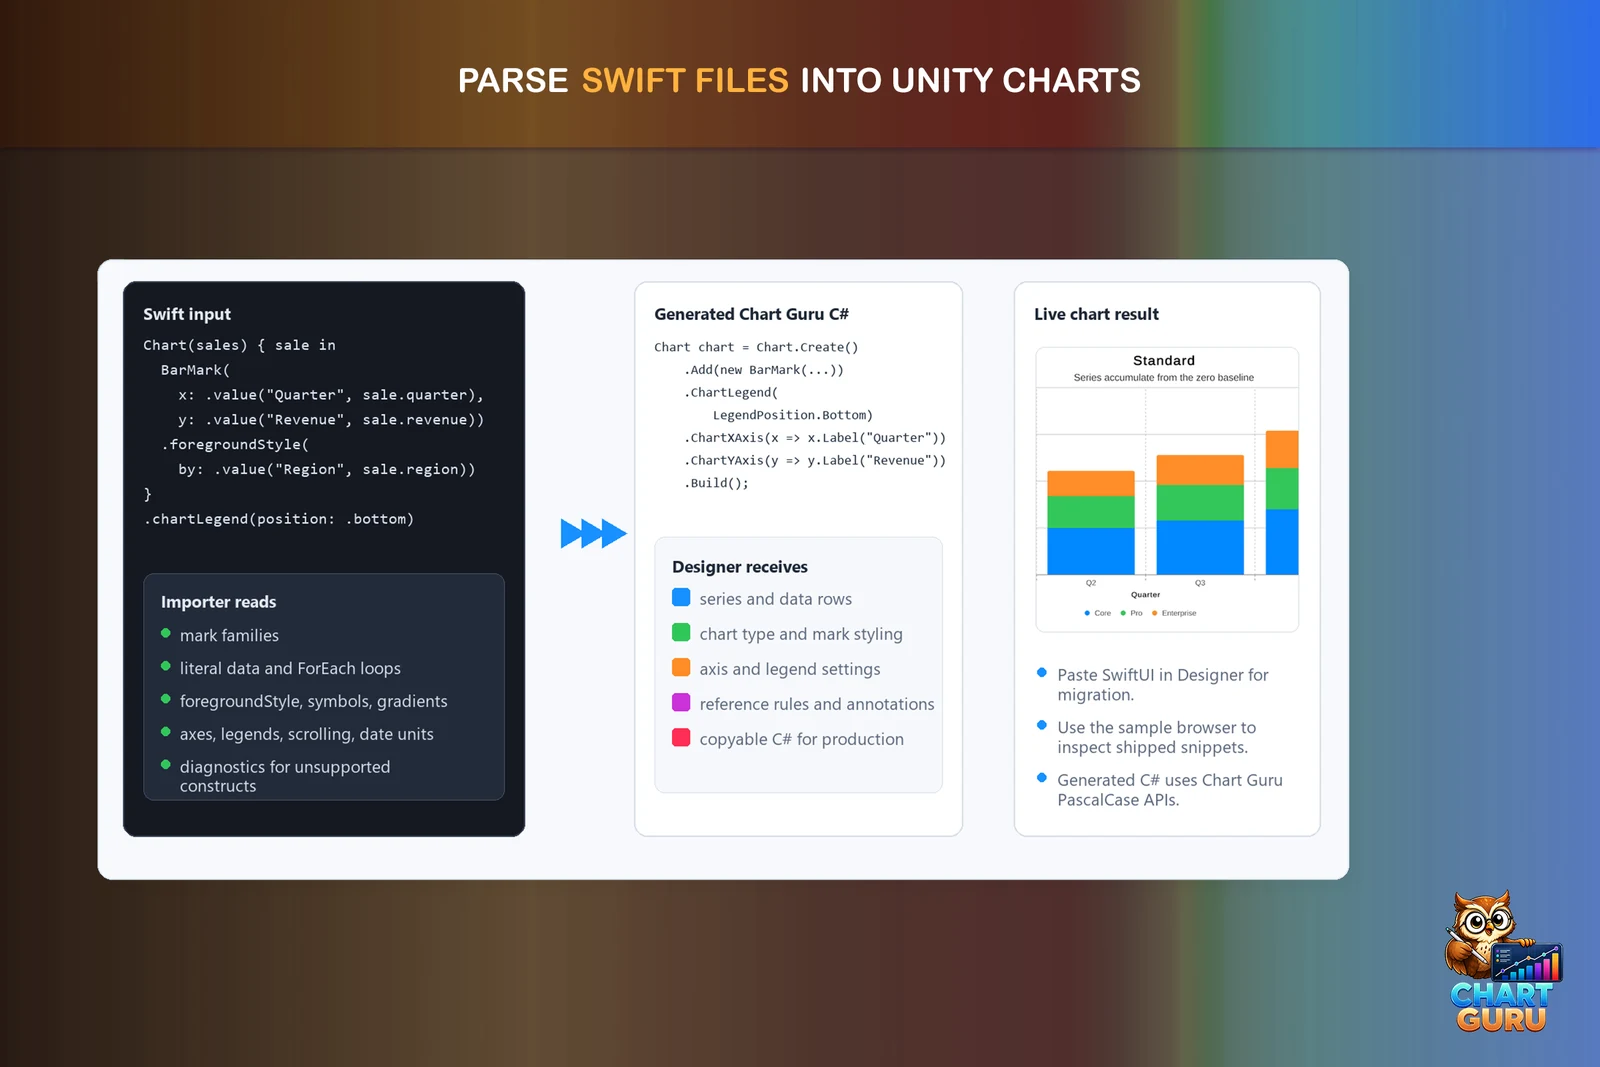
Chart Guru follows the vocabulary of Apple’s Swift Charts: marks, plottable values, modifiers, scales and the chart proxy. If you know Swift Charts, this page shows where each concept lives in Unity C#. If you have never written Swift, read it as a map of a small, consistent vocabulary with proven defaults; you do not need Swift to use any of it.
How names translate from Swift to C#
Every public Chart Guru member uses PascalCase, including fluent builders, mark modifiers, extension methods and generated code. Swift’s .chartXAxis becomes .ChartXAxis, .foregroundStyle becomes .ForegroundStyle and .value becomes PlottableValue.Value. There are deliberately no lower camel case aliases, so C# code stays idiomatic. The importer still reads real Swift casing and generates PascalCase C#.
A few more rules cover most of the remaining differences:
- Result builders become builder chains.
Chart { ... }becomesChart.Create(), one.Add(...)per mark, chart modifiers, then.Build(). Show the result on a host withSetChart: aChartGraphicon a Canvas or aChartGuruElementin UI Toolkit. - Argument labels become positions and enum members.
BarMark(x: .value(...), y: .value(...))becomesnew BarMark(PlottableValue.Value(...), PlottableValue.Value(...)), and.bottombecomesLegendPosition.Bottom. - Bindings become callbacks. Where Swift writes
$selection, C# passes anActionthat receives the selected value. - Symbol sizes are diameters. Swift sizes symbols by area, Chart Guru by diameter. The importer converts numeric sizes, so do not copy them by hand.
Here is one chart in both languages. The Swift version:
Chart(sales) { sale in BarMark( x: .value("Quarter", sale.quarter), y: .value("Revenue", sale.revenue) ) .foregroundStyle(by: .value("Region", sale.region))}.chartYAxisLabel("Revenue").chartLegend(position: .bottom)The Chart Guru version in Unity:
Chart chart = Chart.Create(sales, sale => new BarMark( PlottableValue.Value("Quarter", sale.Quarter), PlottableValue.Value("Revenue", sale.Revenue)) .ForegroundStyle(PlottableValue.Value("Region", sale.Region))) .ChartYAxis(axis => axis.Label("Revenue")) .ChartLegend(LegendPosition.Bottom) .Build();host.SetChart(chart);Coverage at a glance
Chart Guru ships a parity inventory that rates 237 Swift Charts concepts: 212 Full, 22 Partial, 1 Missing and 2 N/A. Full means an equivalent API covers the concept and its behavior within the documented host limits. It does not mean verified pixel parity with native Swift Charts renders. Features Chart Guru adds on top, such as compact charts and chart-type morphs, are listed separately as extras. The tables below follow the inventory as of version 1.4 and name every Partial, Missing and N/A row they include, with the reason.
Container and builder
| Swift Charts | Chart Guru C# |
|---|---|
Chart { ... } | Chart.Create() … .Build(), then host.SetChart(chart) |
Chart(data) { item in ... } | Chart.Create(data, item => mark) |
ForEach(data) { ... } in a chart | Chart.Create(data, ...), or AddBars, AddLine, AddPoints, AddArea, AddSectors on the builder |
Plot { ... } | .Plot(group => ...) |
Composite ChartContent | IChartContent and AddComposites(data, factory) |
Chart3D { ... } | Chart3D.Create() (see the 3D table) |
Marks
| Swift Charts | Chart Guru C# |
|---|---|
BarMark(x:y:) | new BarMark(x, y) |
BarMark(x:yStart:yEnd:), BarMark(xStart:xEnd:y:) | BarMark.YRange(...), BarMark.XRange(...), AddRangeBar, AddHorizontalRangeBar |
LineMark(x:y:), with series: | new LineMark(x, y), series through .ForegroundStyle(PlottableValue.Value(...)) or SeriesKey |
AreaMark(x:y:), AreaMark(x:yStart:yEnd:) | new AreaMark(x, y), new AreaMark(x, yStart, yEnd) |
PointMark(x:y:) | new PointMark(x, y) |
RectangleMark(xStart:xEnd:yStart:yEnd:) | new RectangleMark(xStart, xEnd, yStart, yEnd) |
RuleMark(y:), RuleMark(x:) and segments | RuleMark.Horizontal(y), RuleMark.Vertical(x), HorizontalSegment, VerticalSegment |
SectorMark(angle:innerRadius:angularInset:) | new SectorMark(value, innerRadius, angularInset), .OuterRadius(ratio) |
LinePlot, AreaPlot with a function | AddLinePlot(function, min, max, samples), AddAreaPlot, AddAreaBetweenCurves |
RulePlot, RectanglePlot, SectorPlot | AddRulePlot, AddRectanglePlot, AddSectorPlot |
Chart Guru also has marks Swift Charts leaves to you: CandleStickMark for OHLC data and the HeatMap(values, colorScale) builder helper.
Mark modifiers
| Swift Charts | Chart Guru C# |
|---|---|
.foregroundStyle(.blue) | .ForegroundStyle(Color.blue) |
.foregroundStyle(by: .value("Region", r)) | .ForegroundStyle(PlottableValue.Value("Region", r)) |
.foregroundStyle(Color.blue.gradient) | .ForegroundStyleGradient(Color.blue) |
.foregroundStyle(.linearGradient(...)) | .ForegroundStyle(LinearGradientStyle.FromStops(stops, start, end)) |
.opacity(0.5) | .Opacity(0.5f) |
.cornerRadius(4) | .CornerRadius(4f) on bars, rectangles, sectors and candles |
.symbol(.diamond) | .Symbol(SymbolShape.Diamond) |
.symbolSize(100) | .SymbolSize(diameter). Partial: Swift sizes are areas, Chart Guru sizes are diameters; imports convert them, but adaptive scaling can differ at other chart sizes |
.symbol(by: .value(...)) | .Symbol(PlottableValue.Value(...)) with ChartSymbolScale. Partial: separate color and symbol legends are not fully represented |
.lineStyle(StrokeStyle(...)) | .LineStyle(new StrokeStyle(...)), or StrokeStyle.Dashed(...) and Dotted(...) |
.interpolationMethod(.catmullRom) | .InterpolationMethod(InterpolationMethod.CatmullRom), or .Curved() |
.position(by: .value(...)) | .Position(PlottableValue.Value(...)) |
BarMark(..., stacking: .normalized) | .Stacking(MarkStackingMethod.Normalized), or .Normalized() |
.offset(x:y:) | .Offset(x, y) |
.shadow(...) | .Shadow(color, offset, blur) |
.zIndex(1) | .ZIndex(1) |
.clipShape, .mask, .blendMode, .blur, .compositingLayer | .ClipShape, .Mask, .BlendMode, .Blur, .CompositingLayer. Partial: the settings are stored on marks, but isolated per-mark compositing is not rendered in every backend; bars do support rounded clipping and insets |
Axes
| Swift Charts | Chart Guru C# |
|---|---|
.chartXAxis { AxisMarks(...) } | .ChartXAxis(axis => ...) |
.chartYAxis(.hidden) | .ChartYAxis(AxisVisibility.Hidden), or HideAxes() |
AxisMarks(position: .leading) | Position(AxisMarkPosition.Leading) |
AxisMarks(values: .automatic(desiredCount: 5)) | AxisMarkValues.Automatic(5), or TickCount(5) |
AxisMarks(values: .stride(by: .month)) | AxisMarkValues.Stride(TimeUnit.Month, 1) |
AxisGridLine(), AxisTick(), AxisValueLabel() | GridLine(), Tick(), ValueLabel() on AxisMarksBuilder |
AxisMarks { value in ... } | ForEachValue((value, marks) => ...) |
AxisValueLabel(format: .percent) | FormatStyle(AxisFormatStyle.Percent, ...) on the axis builder |
AxisValueLabel(collisionResolution: .greedy) | AxisValueLabelCollisionResolution.Greedy |
.chartXAxisLabel("Month") | .ChartXAxis(axis => axis.Label("Month")), or .ChartXAxisLabel(...) |
Scales
| Swift Charts | Chart Guru C# |
|---|---|
.chartXScale(domain: 0...100) | .ChartXScale(0f, 100f) |
.chartYScale(type: .log) | .ChartYScale(ScaleType.Log) |
.squareRoot, .symmetricLog, .power(exponent:) | ScaleType.SquareRoot, ScaleType.SymmetricLog, ScaleType.Power |
.chartForegroundStyleScale(["North": .blue]) | .ChartForegroundStyleScale(new Dictionary<string, Color> { ... }) |
.chartForegroundStyleScale(range: Gradient(...)) | .ChartForegroundStyleScale(gradient), or a ColorScale such as ColorScale.FromColormap(ChartColormap.Viridis) |
.chartSymbolScale, .chartLineStyleScale, .chartSymbolSizeScale | ChartSymbolScale, ChartLineStyleScale, ChartSymbolSizeScale |
| A custom scale type | IScaleTransformer, or FunctionScaleTransformer(forward, inverse) |
ScaleDomain.automatic(includesZero:reversed:) | AutoDomain, IncludeZeroInDomain, Inverted, ModifyInferredDomain(...) |
As in Swift Charts, only the first scale modifier for an axis applies, so combine domain, range and type in that call.
Legend
| Swift Charts | Chart Guru C# |
|---|---|
.chartLegend(position: .bottom) | .ChartLegend(LegendPosition.Bottom) |
.chartLegend(.hidden) | .HideLegend(), or .ChartLegend(LegendVisibility.Hidden) |
.chartLegend(position:alignment:spacing:) | ChartLegend(position, size) and LegendConfig.Alignment |
.chartLegend { custom content } | A per-item callback that can change labels and swatches or hide entries; arbitrary SwiftUI-style views are not a goal |
There is no overlay position. Left and Right place the legend inside the plot, a Chart Guru extension that the Swift export writes as .leading or .trailing and reports. A legend with LegendConfig.Interactive hides a series on click, which Swift Charts does not do on its own.
Plot area
| Swift Charts | Chart Guru C# |
|---|---|
.chartPlotStyle { plot in ... } | .ChartPlotStyle(plot => ...) with Background, Border, CornerRadius, Padding and Frame |
.chartBackground { proxy in ... } | .ChartBackground(proxy => ...) |
.chartOverlay { proxy in ... } | .ChartOverlay(proxy => ...) |
.chartXScale(range: .plotDimension(startPadding:endPadding:)) | .ChartXScaleRange(...) with a PlotDimensionRange |
Titles and annotations
| Swift Charts | Chart Guru C# |
|---|---|
.annotation(position: .top) { Text("Peak") } | .Annotation(AnnotationPosition.Top, "Peak") with AnnotationSpacing, AnnotationFont, AnnotationTextColor. Partial: text only, no SwiftUI view content, and imported annotations on general marks become data labels |
overflowResolution: on an annotation | .AnnotationOverflowResolution(...) with AnnotationOverflowConfig. Partial: one shared boundary for both axes, and padScale is not reproduced |
RuleMark(y: 100) with an annotation | RuleMark.Horizontal(100f).Annotation(...), or AddHorizontalRule(y, color, label) |
A Text title above the chart | .ChartTitle("...") and .ChartSubtitle("..."), built in |
| Values written on every mark | .ShowDataLabels(), with leader lines for pies through PieLabelMode |
Selection and interaction
| Swift Charts | Chart Guru C# |
|---|---|
.chartXSelection(value: $selectedX) | .ChartXSelection(...) with an Action<float?>. Partial: whole-plot X selection works on every host, but Unity uses one hover and drag stream instead of the native macOS hover and iOS gesture defaults |
.chartYSelection(value: $selectedY) | .ChartYSelection(...) with an Action<float?> |
.chartXSelection(range:), .chartYSelection(range:) | ChartXSelection and ChartYSelection with an Action<ClosedRange<float>?> |
.chartAngleSelection(value: $angle) | .ChartAngleSelection(angle => ...) |
.chartGesture { proxy in DragGesture() ... } | .ChartGesture(proxy => ChartGesture.DragGesture(proxy).OnChanged(...)) |
TapGesture, LongPressGesture, MagnificationGesture | ChartGesture.TapGesture(proxy), LongPressGesture(proxy, duration), MagnificationGesture(proxy) |
proxy.value(atX:), proxy.position(forX:), proxy.plotAreaFrame | ValueAtX(...), PositionForX(...), PlotAreaFrame on ChartProxy |
@State and @Binding | N/A: C# callbacks and events, such as ChartTooltipChanged, take their place |
Tooltips (ChartTooltip) and linked selection across charts (ChartSelectionLink) are built in, where a Swift app would compose them from overlays.
Scrolling and zooming
| Swift Charts | Chart Guru C# |
|---|---|
.chartScrollableAxes(.horizontal) | .ChartScrollableAxes(ScrollableAxes.Horizontal) |
.chartXVisibleDomain(length: 30) | .ChartXVisibleDomain(30f) |
.chartScrollPosition(initialX: 10) | .ChartScrollPosition(initialX: 10f) |
.chartScrollTargetBehavior(.paging) | .ChartScrollTargetBehavior(ChartScrollTargetBehavior.Paging) |
.valueAligned(matching:majorAlignment:) | ChartScrollTargetBehavior.ValueAligned(step, majorAlignment) |
| Pinch to zoom on scrollable axes | Built-in wheel, drag and pinch, plus ZoomX, ZoomY and ResetViewport on ChartProxy |
| Vectorized plot performance (iOS 18) | Typed Plot<T> content. Partial: it expands into ordinary marks, so equal native batching is not implied; measure your own data |
Animation
| Swift Charts | Chart Guru C# |
|---|---|
withAnimation(.easeInOut) { data = newData } | chart.SetData(marks, Animation.EaseInOut(0.4f)), or chart.SetValues(values, animation) |
.animation(.default, value: data) | .Animation(Animation.Default) on the builder, or NoAnimation() |
.linear, .easeIn, .easeOut, .timingCurve | Animation.Linear, EaseIn, EaseOut, TimingCurve |
.spring(duration:bounce:) | Animation.Spring(...), SpringResponse, Bouncy, Smooth, Snappy |
.delay, .speed, .repeatCount, .repeatForever | .Delay, .Speed, .RepeatCount(n, autoreverses), .RepeatForever() |
Morphs between chart types (MorphTo) and replayed entry animations are Chart Guru additions.
Data and live updates
| Swift Charts | Chart Guru C# |
|---|---|
.value("Sales", 12) | PlottableValue.Value("Sales", 12f) |
.value("Region", "North") | PlottableValue.Value("Region", "North") |
.value("Day", date) | PlottableValue.Value("Day", dateTime) |
.value("Month", date, unit: .month) | PlottableValue.Value("Month", dateTime, TimeUnit.Month, 1) |
A custom Plottable type | PlottableValue.Register<T>(toScalar, toLabel, type) |
NumberBins, DateBins | NumberBins, DateBins.ByCount, ByStride, ByThresholds, drawn with AddHistogramBars |
Vectorized LinePlot(data, x:y:) and the other data plots | The seven Plot<T> types. Partial: the highest-impact per-element modifiers are covered, the full protocol surface is still reviewed case by case |
| A SwiftUI view redrawing on new state | host.SetData(frame), chart.SetValues(...), data source components, or RingBufferChartDataSource.Push(x, y) from any thread |
Accessibility
| Swift Charts | Chart Guru C# |
|---|---|
.accessibilityLabel, .accessibilityValue on a mark | .AccessibilityLabel(...), .AccessibilityValue(...) |
.accessibilityHidden, .accessibilityIdentifier | .AccessibilityHidden(true), .AccessibilityIdentifier(...) |
AXChartDescriptorRepresentable | chart.GetAccessibilityDescriptor() |
| Audio Graphs | ChartAudioGraph with Play(chart), Sonify(chart) and CreateAudioClip(chart) |
| VoiceOver chart summary | .ChartAccessibilityLabel(...), .ChartAccessibilityRepresentation(...), and ChartAccessibilityHierarchyBridge on Unity 6 |
.accessibilityRepresentation { ... } | N/A: no alternate SwiftUI view; ChartAccessibilityRepresentation(string) supplies a description instead |
The accessible charts article covers these in practice.
3D with Chart3D
Swift Charts 3D adds a Z value to its marks, and Chart Guru does the same with the same builder shape:
Chart3D { PointMark( x: .value("Flipper (mm)", 190), y: .value("Mass (g)", 3700), z: .value("Bill (mm)", 38.8) ) .symbol(.sphere)}.chart3DPose(.default)Chart chart = Chart3D.Create() .Add(new PointMark3D(PlottableValue.Value("Flipper (mm)", 190f), PlottableValue.Value("Mass (g)", 3700f), PlottableValue.Value("Bill (mm)", 38.8f)) .Symbol(Symbol3D.Sphere)) .Chart3DPose(Chart3DPose.Default) .Build();chart3D.SetChart(chart);| Swift Charts 3D | Chart Guru C# |
|---|---|
PointMark(x:y:z:) | new PointMark3D(x, y, z) |
RuleMark with z: | RuleMark3D |
RectangleMark(x:y:z:) | RectangleMark3D |
SurfacePlot(x:y:z:) { x, z in ... } | new SurfacePlotMark("X", "Y", "Z", (x, z) => ...) |
LinearRegression with SurfacePlot | LinearRegression3D.Fit(data, x, y, z) and new SurfacePlotMark("X", "Y", "Z", regression) |
.foregroundStyle(.heightBased), .normalBased | .ForegroundStyle(SurfaceStyle.HeightBased), SurfaceStyle.NormalBased |
.chart3DPose(.front), Chart3DPose(azimuth:inclination:) | .Chart3DPose(Chart3DPose.Front), new Chart3DPose(20f, 7f) |
.chart3DCameraProjection(.perspective) | .Chart3DCameraProjection(Chart3DCameraProjection.Perspective) |
.chartZAxis { ... }, .chartZScale(domain:) | .ChartZAxis(axis => ...), .ChartZScaleDomain(min, max) |
.symbol(.sphere) | .Symbol(Symbol3D.Sphere) |
.symbolSize(...) | .SymbolSize(...). Partial: Chart Guru sizes are diameters while Swift sizes a sphere by its radius; the importer doubles sphere sizes |
| Animated pose changes | Chart3DPose.Lerp(a, b, t). Partial: no built-in animated pose transition yet |
.chartZAxisLabel(...) | Label(...) on the Z axis. Partial: the title is drawn without its position, alignment and spacing |
.chartZSelection(value:) | Chart.SelectedZValue and OnZSelectionChanged. Partial: no range gesture and no selection highlight yet |
.chart3DRenderingStyle (visionOS) | Missing: reported on import |
Beyond Apple’s set, Chart Guru adds Bar3DMark, Line3DMark, Area3DMark, Sector3DMark, Donut3DMark and Radar3DMark, lifts 2D marks into depth with .Z(z), and animates compatible charts from 2D into 3D. The Chart Guru 3D page covers the 3D module.
Let the importer write the first draft
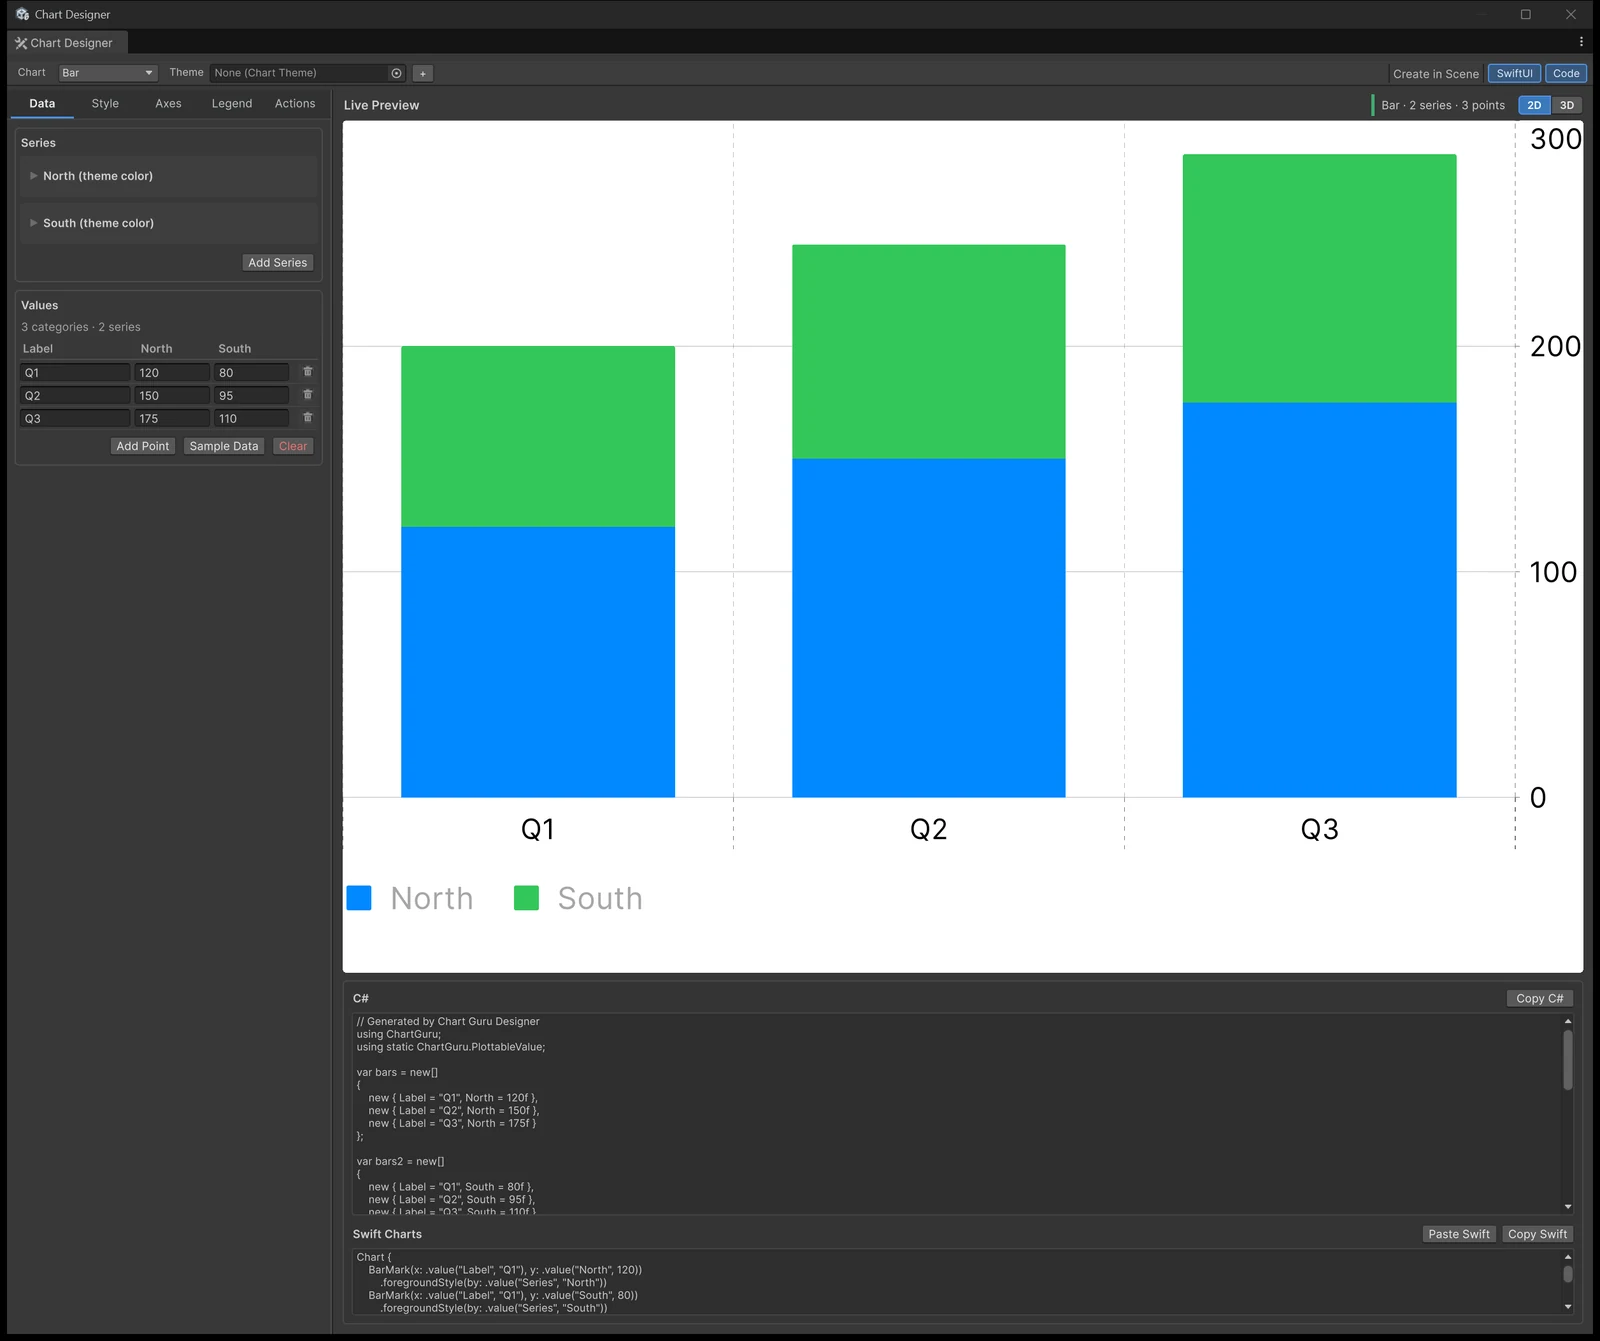
You rarely need to translate by hand. Paste supported Swift Chart or Chart3D code into the Chart Designer or a chart Inspector and Chart Guru reads the marks, literal data, loops, modifiers, axes, scales, legends, annotations and scrolling, then generates PascalCase C#. It reports unsupported or partial constructs by name, and data the source computes with app code it cannot run is reported instead of replaced with invented values. Arbitrary Swift app code does not convert; chart-focused code does. Going the other way, Copy Swift writes a chart back as Swift Charts code and lists the Chart Guru extensions it cannot carry.
The examples include 41 Swift Charts samples with their native renders, used by the Swift Import lesson, so you can compare an import with the original. Samples 27 to 44 are adapted from Jordi Bruin’s Swift Charts Examples under the MIT license. The paste Swift Charts code use case walks through the workflow, and the API quick reference lists the main types.
Sources: SwiftChartsFeatureParity.md in the Chart Guru 1.4 package and the Chart Guru API reference, checked 2026-11-11. Chart Guru is available on the Unity Asset Store.
Easy, reliable charts for Unity, from sparklines to multi-series 3D.
Keep reading
 Use case
Paste Swift Charts code into Unity
Chart Guru reads supported Swift Charts code pasted into the Chart Designer or a chart Inspector, draws the chart in Unity and writes PascalCase C#. Diagnostics name everything it skipped, and nothing is invented.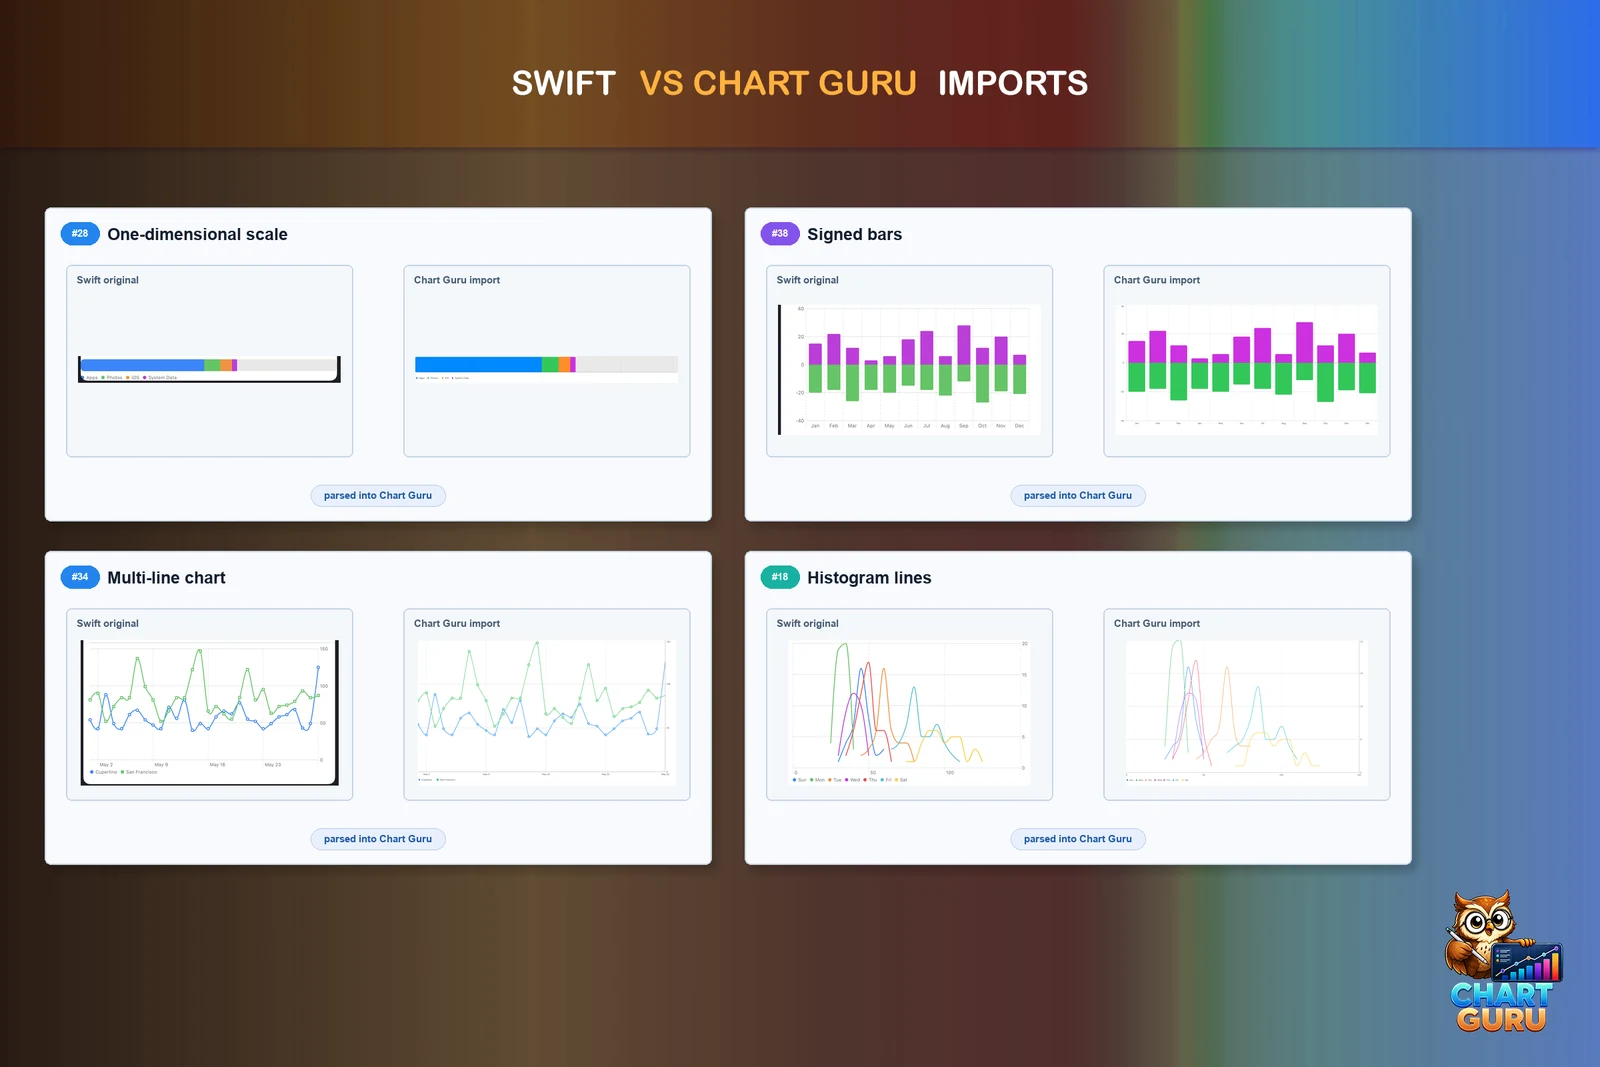 Article
Why Chart Guru follows Swift Charts conventions
Ad-hoc chart APIs leave categories, series and styling to you. Chart Guru adopts the grammar of Apple's Swift Charts instead. What that gives people who never wrote Swift, what Swift developers get, how it extends to 3D, and where parity stops. Article