Chart Guru vs Graph And Chart
Graph And Chart is the long-running uGUI chart asset for Unity, with an edition for huge live series. Chart Guru adds UI Toolkit, a Swift Charts API and a Designer.
Graph And Chart has been on the Asset Store since January 2017 and is still updated every one to three months; version 1.300.0 from 2026-10-30 prepares it for the CoreCLR runtime of Unity 7. It comes in three editions: Lite for 2D charts, the full edition with 3D charts and PlayMaker, and Scientific for high-volume real-time graphs. Chart Guru was first published in June 2026.
The facts below come from BitSplash’s store pages, documentation and written reviews and from Chart Guru’s manual, all checked on 2026-11-11. We make Chart Guru, and we did not benchmark either asset for this page.
At a glance
| Graph And Chart | Chart Guru | |
|---|---|---|
| Price | US$85 full; US$25 Lite (2D only); US$150 Scientific, full edition included | US$29; 3D module and Mock Magic included |
| Track record | Since January 2017; 102 ratings, 2,028 favorites; 1.300.0 on 2026-10-30 | Since June 2026; 3 reviews, 5.0 average |
| Unity and pipelines | 2019.4 and newer; Built-in, URP, HDRP | 2022.3 and newer; Built-in, URP, HDRP |
| UI systems | uGUI canvases in overlay, camera and world space; UI Toolkit not supported | uGUI canvases, UI Toolkit, world space, custom inspectors |
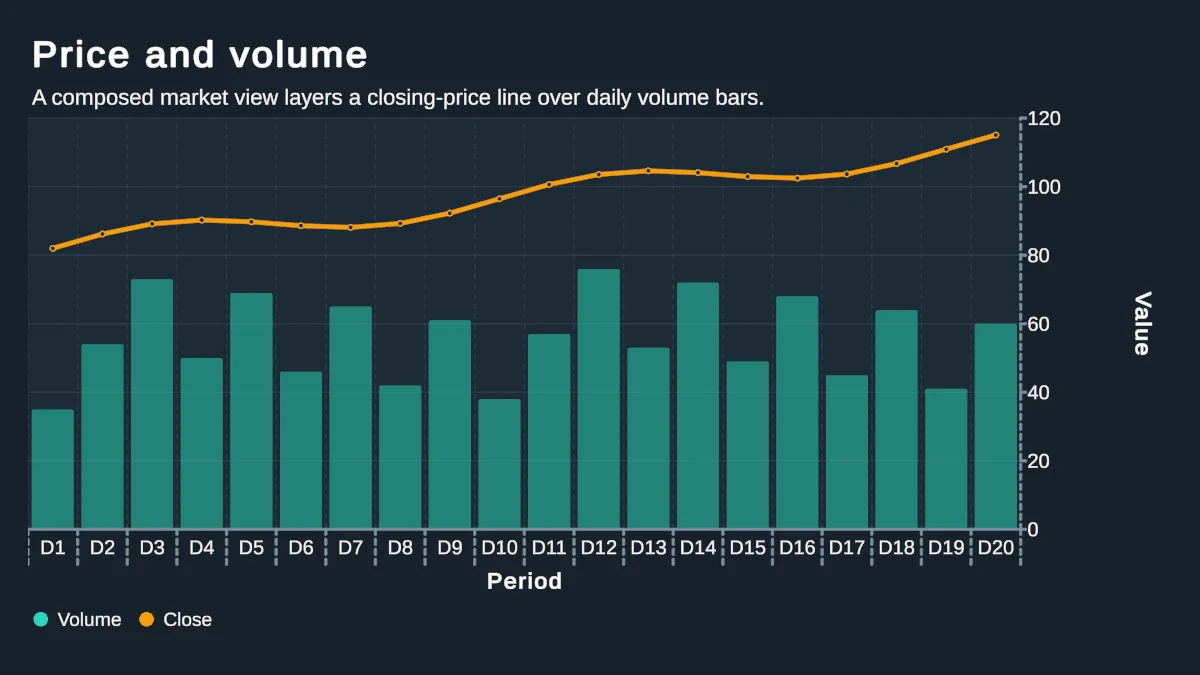
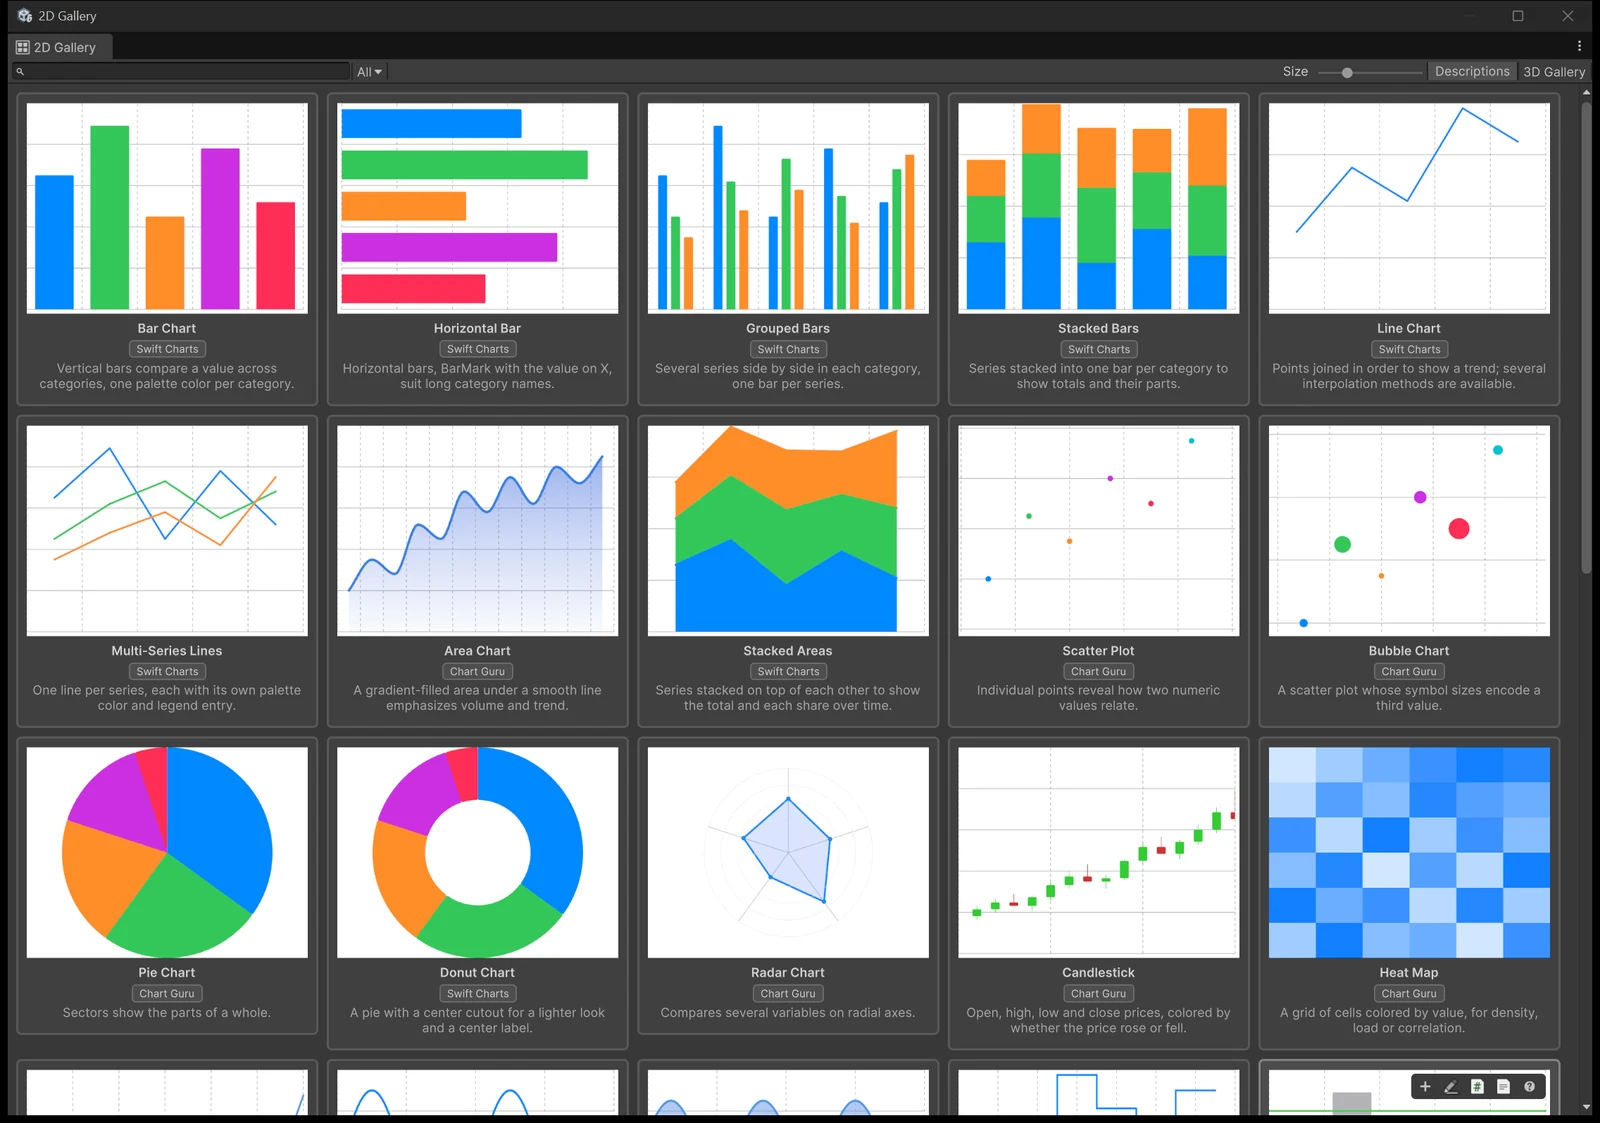
| 2D chart types | Bar (stacked, racing), pie, torus, graph (lines, curves, fills, points), bubble, radar, candlestick, pyramid (beta) | Bar, line, point, area, pie, donut, radar, bubble, scatter, heat map, candlestick, five compact types, composed charts |
| 3D | Bar, pie, torus, graph (non-streaming), bubble and radar in the full edition | 12 3D types with streaming updates, orbit, selection and a 2D to 3D lift |
| Real-time | Streaming graph and candle charts; Scientific for about 100,000 points | Thread-safe ring buffer, allocation-free stable updates; no published throughput figure yet |
| Data loading | JSON and XML from a URL; otherwise your own code | CSV, JSON, web, Google Sheets, Yahoo Finance, mock streams, ring buffer, data assets |
| Code style | Categories set up in the Inspector, filled by string name | Typed marks in a fluent Swift Charts-style builder; Swift import and export |
| Authoring | Inspector with editor preview, 30+ themes, tutorial scenes | Template gallery, Chart Designer with Undo, tabbed inspectors, themes |
| Interaction | Click, hover and leave events; scroll, zoom, pan and autoscroll on graphs | Tooltips, selection, linked selection, brushing, zoom, scrolling, gestures |
| Motion | Hover and value-change animations, sliding real-time appends | Animated data changes, entry animations, morphs between chart types, 2D to 3D lift |
| Accessibility and export | Not described | Descriptions, Unity 6 accessibility, audio graphs; PNG, CSV and JSON export |
| Documentation | Tutorials, concepts and a 40-minute video; no API reference section | Manual, full API reference, assistant skills for coding tools |
| Integrations | PlayMaker (not in Lite) | Mock Magic included; optional LED Studio integration |
Where Graph And Chart is the better choice
- Track record. More than nine years of updates, 102 ratings shown as five stars and 2,028 favorites, against three reviews for Chart Guru so far. If a long history matters to your team, that gap is real.
- Very large real-time series. The Scientific edition (US$150, full edition included) is built for high point counts and loads data asynchronously. BitSplash advertises up to about 100,000 points and 100 to 1,000 appended points per second, depending on hardware.
- PlayMaker. The full edition integrates with PlayMaker, so visual-scripting teams can drive charts without C#. Chart Guru has no PlayMaker integration.
- Older Unity versions. Graph And Chart supports Unity 2019.4 and is tested on 2019.4, 2022.3 and Unity 6.0. Chart Guru needs Unity 2022.3 or newer.
- Pyramid and racing bar charts. Both are dedicated chart types, the pyramid still in beta. Chart Guru has neither; its population pyramids are a different chart, and one Chart Guru reviewer has asked for a proportional pyramid.
- Ready-made themes. More than 30 visual themes ship with the full edition.
- Support reputation. Responsive email and forum support is the most common praise in its reviews; one reviewer wrote that they “really appreciate their continued assistance through multiple email exchanges” (SEIB-DGVM, 2024).
Where Chart Guru is the better choice
- UI Toolkit. BitSplash’s store page states plainly that UI Toolkit is not supported. Chart Guru’s
ChartGuruElementworks in UXML, the UI Builder, runtime panels and editor windows, alongside Canvas and world-space hosts. See charts in UI Toolkit. - A typed API with proven conventions. Graph And Chart fills Inspector-defined categories by string name. Chart Guru builds typed marks in a fluent builder that follows Swift Charts, so a chart can live entirely in code, and pasted Swift Charts code becomes a working chart plus clean C#. See pasting Swift Charts code.
- Visual authoring. Start from a template gallery with chart-family filters and Swift compatibility badges, refine in a Chart Designer with Undo, and fine-tune in inspectors with live previews. BitSplash configures every chart in the Inspector with an editor preview and mentions no designer window or gallery.
- Data sources. CSV with culture-aware number parsing, JSON, web endpoints with polling, backoff and cancellation, Google Sheets, Yahoo Finance candles, Mock Magic streams and a ring buffer are components, not code you write. Values that arrive on a socket or serial thread can be pushed into the ring buffer from that thread. See real-time graphs.
- Accessibility and export. Chart descriptions, accessible navigation, Unity 6 native accessibility support and audio graphs, plus CSV, JSON and PNG export. Graph And Chart’s store page mentions none of these.
- Motion and 3D. Data changes animate, charts morph between types, and compatible 2D charts lift into 3D with an animated transition. 3D charts take in-place streaming updates, while BitSplash’s feature list marks its 3D graphs as non-streaming. See lifting 2D charts into 3D.
- Small charts. Sparklines, mini bars, mini pies, mini donuts and indicators are dedicated types; see sparklines and KPIs.
- Price. US$29 against US$85 for the full edition, with 3D and Mock Magic included.
Real-time performance
Both assets stream: Graph And Chart appends points to graph and candle charts with a sliding animation, and Scientific targets very large point counts. Chart Guru’s streaming path is designed for steady high-frequency updates: RingBufferChartDataSource has a fixed capacity, accepts pushes from any thread in constant time, publishes at most once per frame and allocates nothing once full, and stable value updates are covered by tests that check for zero managed allocations after warm-up. The Large Datasets lesson draws 35,136 tide points.
What we have not published yet is a throughput figure, such as points per frame at 60 fps, that compares directly with BitSplash’s claim for Scientific. Until we do, if one chart must hold tens of thousands of streaming points, test both assets with your own data, or choose Scientific.
API style side by side
These Graph And Chart calls come from BitSplash’s page on filling the graph chart with data; the category is created in the GraphChart Inspector first:
// Graph And ChartGraph.DataSource.ClearCategory("Player 1");Graph.DataSource.AddPointToCategory("Player 1", x, y);Graph.DataSource.AddPointToCategoryRealtime("Player 1", System.DateTime.Now, Random.value * 20f + 10f, 1f);Chart Guru builds a static chart as typed marks in one expression:
// Chart GuruChart chart = Chart.Create() .ChartTitle("Sales by Region") .Add(new BarMark(PlottableValue.Value("Region", "North"), PlottableValue.Value("Sales", 12f))) .Add(new BarMark(PlottableValue.Value("Region", "South"), PlottableValue.Value("Sales", 7f))) .Build();graphic.SetChart(chart);For live values, a ring buffer on the same GameObject as a saved chart, or on a parent, feeds it:
var buffer = gameObject.AddComponent<RingBufferChartDataSource>();buffer.Capacity = 600;buffer.SeriesName = "Player 1";buffer.Push(Random.value * 20f + 10f); // safe to call from any threadBoth use names, but BitSplash’s must match categories configured in the Inspector, while Chart Guru’s labels travel with the values in each mark. The Designer shows the generated C# and Swift for a chart and lists any settings Swift cannot express, and the Swift Charts to Unity cheat sheet maps the vocabulary.
What reviewers say
By our count, Graph And Chart’s 86 written reviews average 4.79 stars. Most were written between 2017 and 2021, and four since 2024. Praise centers on support and on how far charts can be customized, and one team reports 60 fps in fullscreen WebGL with large data. The criticisms below are individual reviewers’ opinions, and some may predate later updates:
- A 2025 three-star review found it dated and hard to use for a simple line graph with custom axes, and criticized the code structure.
- A 2021 three-star review missed a complete API overview and found that some Inspector options behaved unexpectedly.
- Reviews from 2020 and 2021, with one to three stars, called the package bloated and pointed to naming and spelling inconsistencies, prefabs in Resources folders and a missing namespace.
- A 2025 review reported labels disappearing in VR.
- A 2024 three-star review of the Lite edition said its documentation consists of tutorials rather than a reference.
Switching from Graph And Chart
- Categories become series. A category name maps to a series: the
SeriesNameof a ring buffer, a series column in your data, or the series value on marks. - Map chart types. Graph charts become line, area or point charts, torus charts become donuts, candle charts become candlesticks, and bar, pie, bubble and radar keep their names. Pyramid and racing bar charts have no direct counterpart.
- Replace PlayMaker actions with C# or with data sources; Chart Guru has no PlayMaker integration.
- Move 3D charts to Chart Guru 3D. Compatible 2D charts can also switch to 3D in the Designer, keeping their data and settings.
- Recreate themes as Chart Guru theme assets.
Sources
- Graph And Chart, Lite and Scientific on the Asset Store, for prices, ratings, versions and features.
- Graph And Chart reviews on the Asset Store.
- BitSplash documentation, including filling the graph chart with data, the source of the Graph And Chart code sample.
- Chart Guru’s introduction, data sources and performance guidance manual pages.
All facts were checked on 2026-11-11.
Bottom line
If you need the safety of a long track record, PlayMaker, Unity 2019.4, or a dedicated edition for very large real-time series, Graph And Chart is the better choice. If you build with UI Toolkit, want a typed Swift Charts-style API, prefer designing charts visually, or need data sources, accessibility and streaming 3D, Chart Guru fits better, at US$29 on the Unity Asset Store.
See also Chart Guru vs XCharts, the roundup of Unity chart assets and libraries, trading and finance charts, and the product page.
Frequently asked questions
Does Graph And Chart work with UI Toolkit?
No. BitSplash's store page states that it is a uGUI tool and that UI Toolkit is not supported. Its charts render on canvases in overlay, camera or world space, plus separate 3D charts in the full edition. Chart Guru draws charts on Canvas, in UI Toolkit and in world space.
Which one handles more real-time data?
Graph And Chart Scientific (US$150) is built for it: BitSplash advertises up to about 100,000 points and 100 to 1,000 new points per second, depending on hardware. Chart Guru streams through a thread-safe ring buffer with allocation-free updates but has not published comparable throughput figures yet, so test with your own data volume if this decides your choice.
What does each one cost?
As of 2026-11-11, Chart Guru costs US$29 with its 3D module and Mock Magic included. Graph And Chart costs US$85 for the full edition with 3D charts and PlayMaker support, US$25 for the 2D Lite edition, and US$150 for Scientific, which includes the full edition.
Easy, reliable charts for Unity, from sparklines to multi-series 3D.
Keep reading
 Comparison
Unity chart assets and libraries compared (2026)
About ten ways to draw charts and graphs in Unity, free and paid, and what each one is best at. Unity ships no public chart control, so the right pick depends on your UI system, data, 3D needs and how actively a tool is maintained.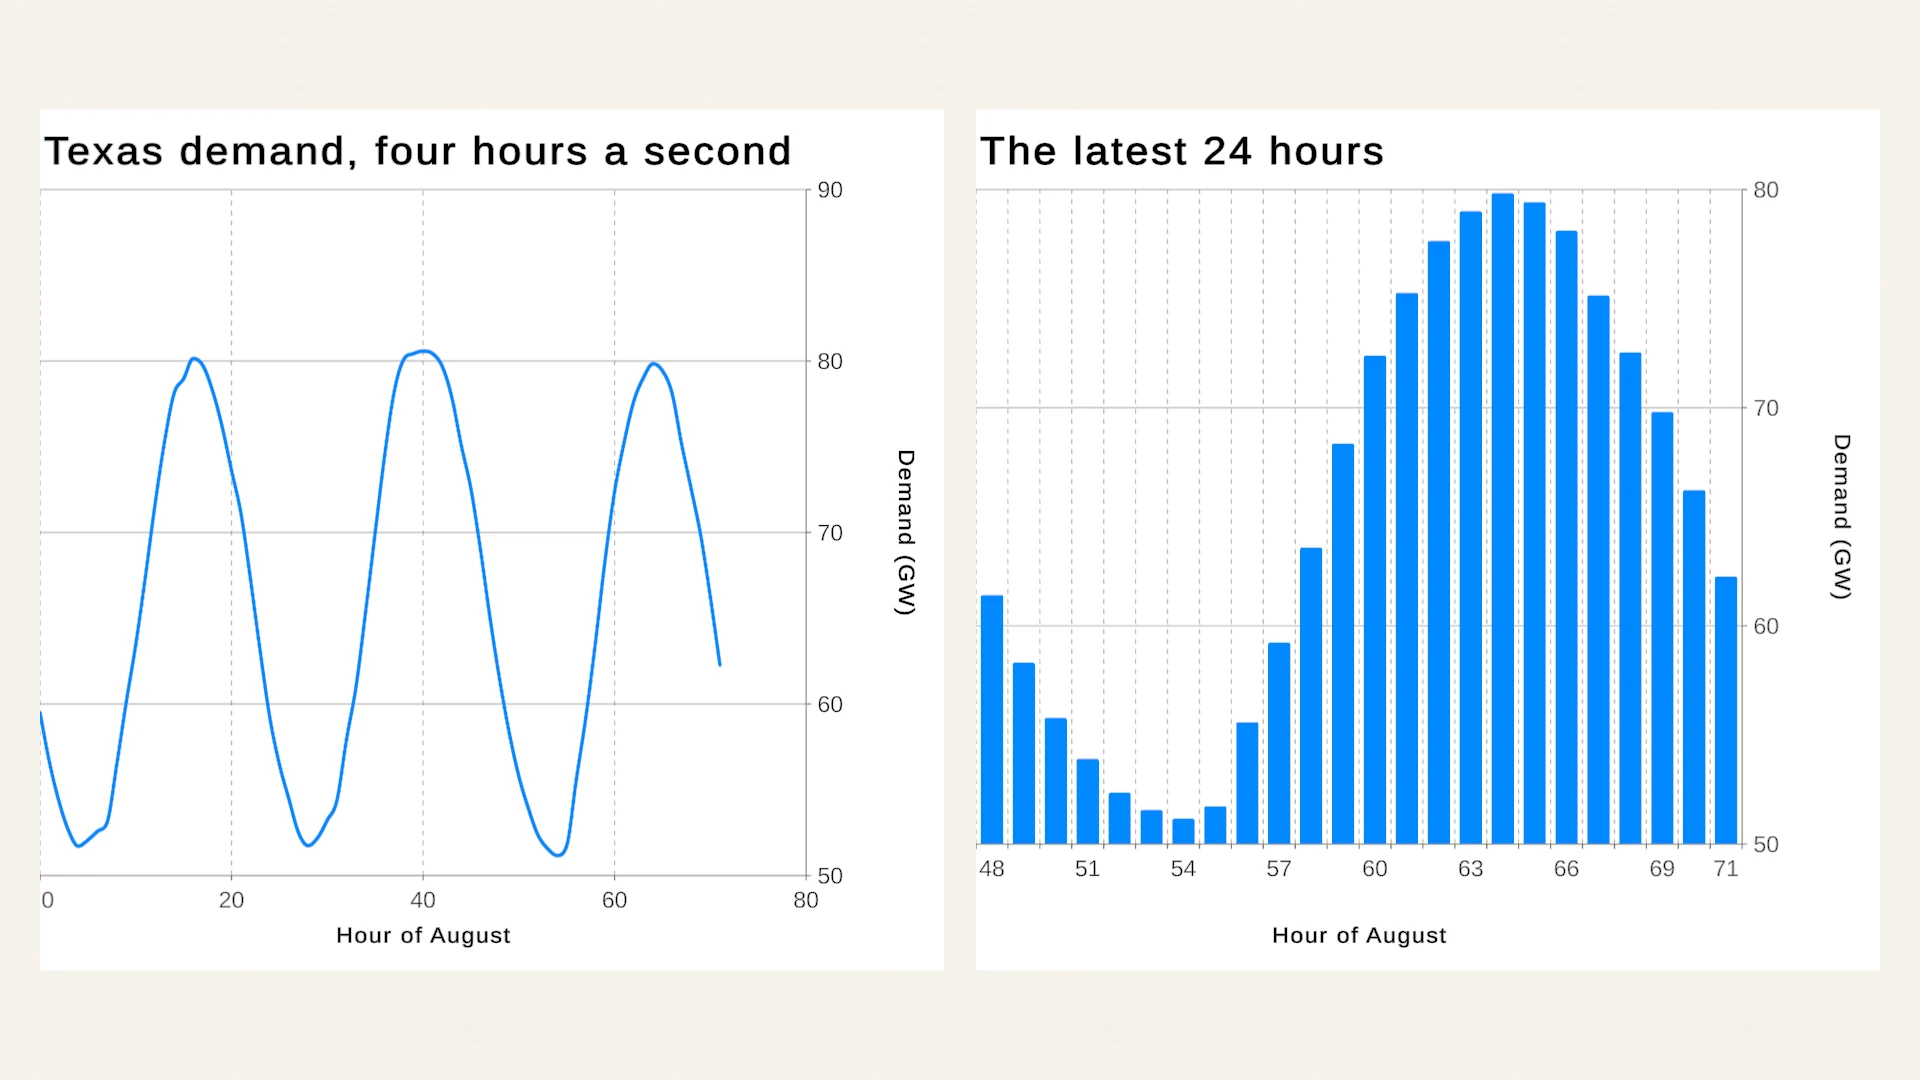 Use case
Real-time graphs for live and high-volume data in Unity
Chart Guru streams live values into Unity charts through a fixed-capacity ring buffer you can push from any thread, web sources that poll with backoff, and your own adapters. Stable updates are tested to allocate nothing after warm-up. Use case