Live charts from Google Sheets, CSV and JSON
Chart CSV files, JSON payloads, web endpoints and published Google Sheets in Unity: culture-aware parsing, automatic column binding, async refresh and CSV or PNG export.
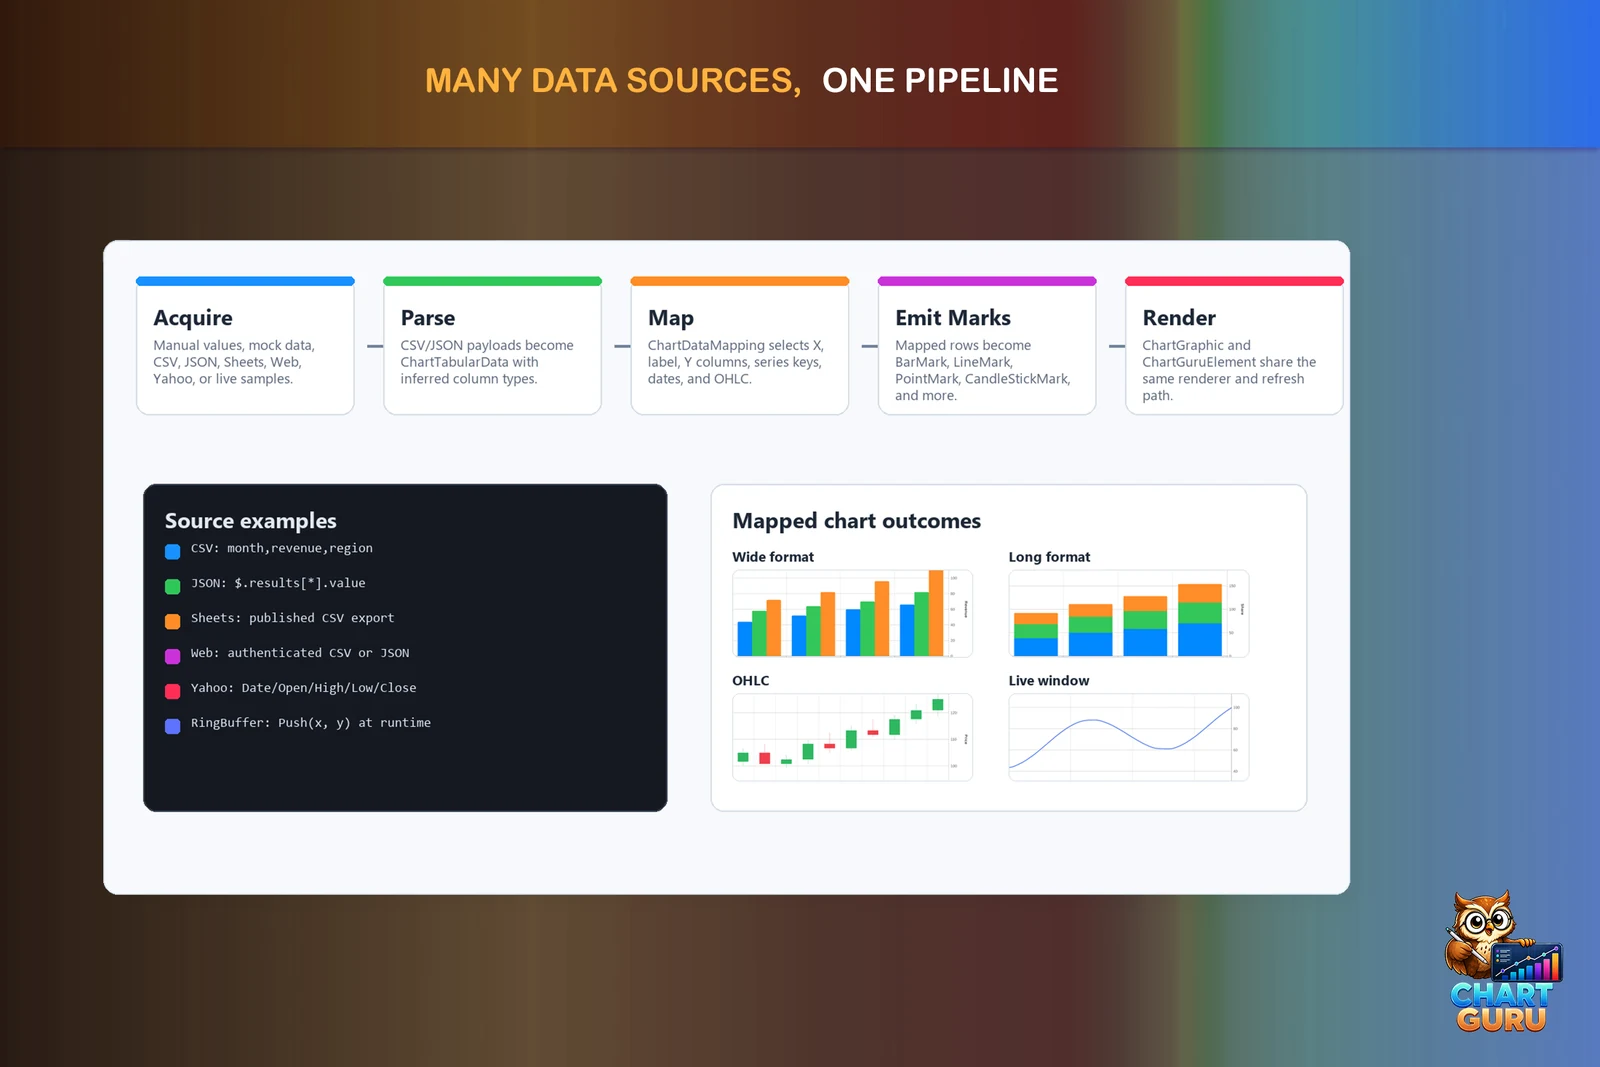
The data you want to chart often already exists outside Unity: a spreadsheet a designer keeps up to date, a CSV export from a database or a test rig, a JSON API behind a dashboard. Getting it onto the screen usually means writing a parser, guessing at number formats and wiring up refresh logic. Chart Guru’s data sources do that part. Each one turns text into a typed table, the chart maps the table’s columns to marks, and refreshes run without blocking the game.
Four text sources, one pipeline
| Source | Reads | Notes |
|---|---|---|
CsvChartDataSource | CSV, TSV or semicolon-separated text from a TextAsset, a project file, an absolute path, StreamingAssets or an inline string | Detects the delimiter, header row and column types; can watch its file |
JsonChartDataSource | JSON from the same places | A root selector such as $.data.timeseries[*] targets the records; nested objects flatten one level, so ohlc.open becomes a column |
WebChartDataSource | CSV or JSON from an HTTP or HTTPS endpoint | Request headers, polling, retry with backoff, cancellation |
GoogleSheetsChartDataSource | A published Google Sheet | Converts the share URL into the CSV export and reads one tab |
Every source publishes a typed ChartDataFrame with named number, category, date or Boolean columns. Put the source on the chart’s GameObject, or on a parent to feed every chart below it that has no data of its own; one source can drive several 2D and 3D charts with different mappings. The Preview tab on the source’s Inspector shows the published columns and values before any chart maps them, and Max Rows limits how many rows a file source loads.
The CSV source can watch its file with a file system watcher, in the Editor by default and at runtime when you opt in with WatchFileAtRuntime, so a chart follows edits to an exported file while you work.
Google Sheets in four steps
- In Google Sheets, choose File > Share > Publish to web.
- On the chart or a parent object, choose Add Component > Chart Guru > Data Sources > Google Sheets Chart Data Source.
- Paste the share URL into Share URL, or enter the Spreadsheet ID and the Sheet GID of the tab you want.
- Set Poll Interval (s) above zero if the chart should refresh on its own.
The source turns the share URL into the sheet’s CSV export URL and handles the usual traps: picking the right tab by its gid, requesting CSV instead of HTML, and decoding UTF-8. The sheet must be published or otherwise reachable by the device that runs the chart. Designers and analysts keep editing the sheet in their browser, and the chart in Unity follows on its next refresh.
Parsing that copes with real files
Spreadsheet exports are rarely clean. The file sources handle the common problems without a mapping asset:
- Number formats. With Number Culture left automatic,
1,234reads as one thousand two hundred thirty-four, a lone1,5as one and a half, and semicolon-delimited tables use decimal commas. Set a culture such asde-DEwhen a file follows one locale throughout. - Missing values. Placeholders such as
NA,N/A,#N/A,nullor-become empty cells instead of zeros, so gaps stay gaps in the chart. - Dates. Date Format and Date Culture control parsing. Dates without a time zone are read as UTC in both data and axes, so a chart shows the same times on every machine. Large numbers become timestamps only in time-named columns such as
Timestamp. - Headers. Rows such as
Jan,30without a header stay data instead of becoming column names.
Columns become marks
A chart’s layers map the published columns to marks. Leave the layers automatic and Chart Guru infers a layout: a column named X, otherwise the first date or text column, otherwise a first number column named Year or running in one direction becomes X. Every other number column becomes a series, and a further text column groups the series. A single number column draws against the row index, and heat maps draw one row per number column.
When the inferred layout does not describe your data, bind columns by name on the Marks tab: X, Y, Series, Color, Size, labels, start and end for ranges, or Open, High, Low and Close for candlesticks. Wide tables bind several value columns at once, long tables split rows by a series column. The Data status line and the Marks diagnostics name any column a layer expects but the data lacks.
Refresh without blocking the game
File and web sources parse on a worker thread and publish on the Unity thread. RefreshAsync(CancellationToken) lets you await a refresh, and RefreshStateChanged, IsRefreshing, LastRefreshError and LastRefreshUtc drive a loading indicator or an error label. A newer refresh supersedes an older request, so a slow response never overwrites newer data, and disabling a source cancels its work. Web sources poll through PollIntervalSeconds, where zero means one request, and back off after transient failures. In Edit Mode a web source fetches only when you turn on RunInEditMode or press Fetch Now in its Inspector.
Keep credentials out of saved assets
Authenticated endpoints need keys, and keys must not land in scenes, prefabs or source control. Supply header values at runtime, or choose an environment variable as a header’s value source:
source.SetRuntimeHeader("Authorization", authorizationHeader);source.RefreshStateChanged += showState;try{ await source.RefreshAsync(cancellationToken);}finally{ source.RefreshStateChanged -= showState;}Runtime header values are never serialized. Handle OperationCanceledException separately from a failed refresh, as the data sources page shows in its full example.
Reshape data before charting
Typed data frames give you the usual table operations without another library. Filter keeps matching rows, SortBy orders them, ChartDataTransforms.Calculate adds a derived column, AggregateBy summarizes groups, Rolling adds a moving-window statistic and FacetBy splits the frame into one view per value of a column. Each operation returns new frames and leaves the source frame untouched. The Data Frames and Facets lesson splits the Palmer penguins into one chart per group and aggregates the whole table into a summary chart.
The Data Explorer example
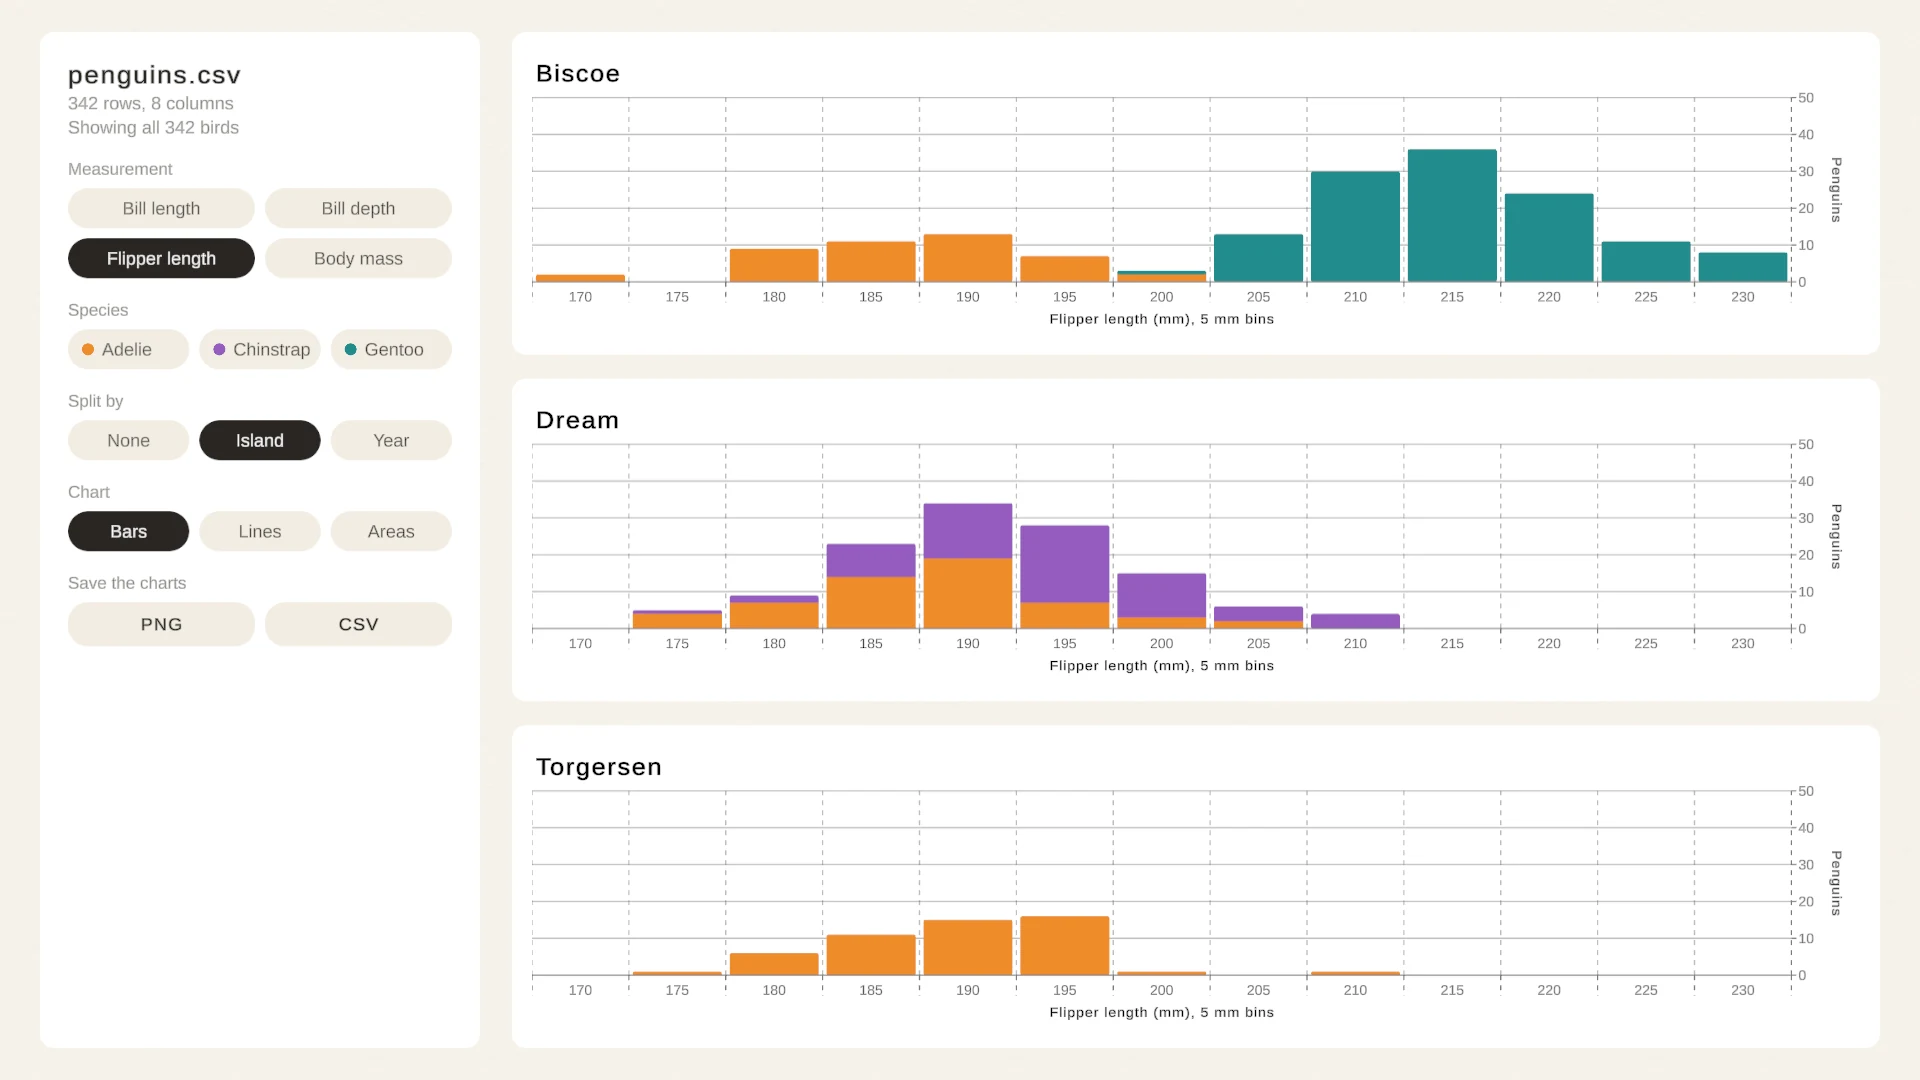
The Data Explorer production example is a small tool for one CSV file. A CSV source loads penguins.csv, 342 Palmer penguins with their species, island, bill, flipper and body mass measurements. You pick a measurement, switch species off and on, split the birds into one chart per island or year, and switch between stacked bars, lines and stacked areas, with the charts morphing from one type to the next on a shared scale. Save PNG and Save CSV write the charts on screen to Application.persistentDataPath/Chart Guru Exports/Data Explorer.
Export back out
ChartDataExporter.ToCsv(chart)andToJson(chart)return deterministic data that describes the chart’s marks and their meaning, including X, Y and Z values where they apply;WriteCsvandWriteJsonsave it to a path you choose.ChartGraphic.EncodeOutputPngandSaveOutputPngwrite the rendered chart as a PNG, with titles, axes, legends and data labels or without them.- The Exporting Charts lesson writes every chart as PNG, CSV and JSON with one button.
Limits
- The Google Sheets source reads published sheets through their CSV export; the sheet must be reachable from the device.
- The web source polls; streaming protocols such as MQTT need an adapter, described in the real-time graphs guide.
- Very large files load into memory as one table; use Max Rows and a scrollable visible window for long series.
The troubleshooting page covers sources that publish nothing, and the Chart Guru product page shows the rest of the package. Chart Guru is available on the Unity Asset Store.
Frequently asked questions
Does my Google Sheet have to be public?
The sheet must be published or otherwise reachable by the player or Editor. Publish it with File > Share > Publish to web in Google Sheets, then paste the share URL into the Google Sheets source, which converts it into the sheet's CSV export URL and reads the tab its gid selects.
My CSV uses decimal commas. Will the numbers come out right?
Yes. With Number Culture left automatic, CSV parsing handles common thousands separators and decimal commas, including semicolon-delimited tables with decimal commas. When a file follows one locale throughout, set Number Culture explicitly, for example to de-DE.
How do I keep API keys out of my project?
Set request headers at runtime with WebChartDataSource.SetRuntimeHeader, or let a header read its value from an environment variable. Runtime header values are not serialized, so they never end up in scenes, prefabs or source control.
Easy, reliable charts for Unity, from sparklines to multi-series 3D.
Keep reading
 Use case
Real-time graphs for live and high-volume data in Unity
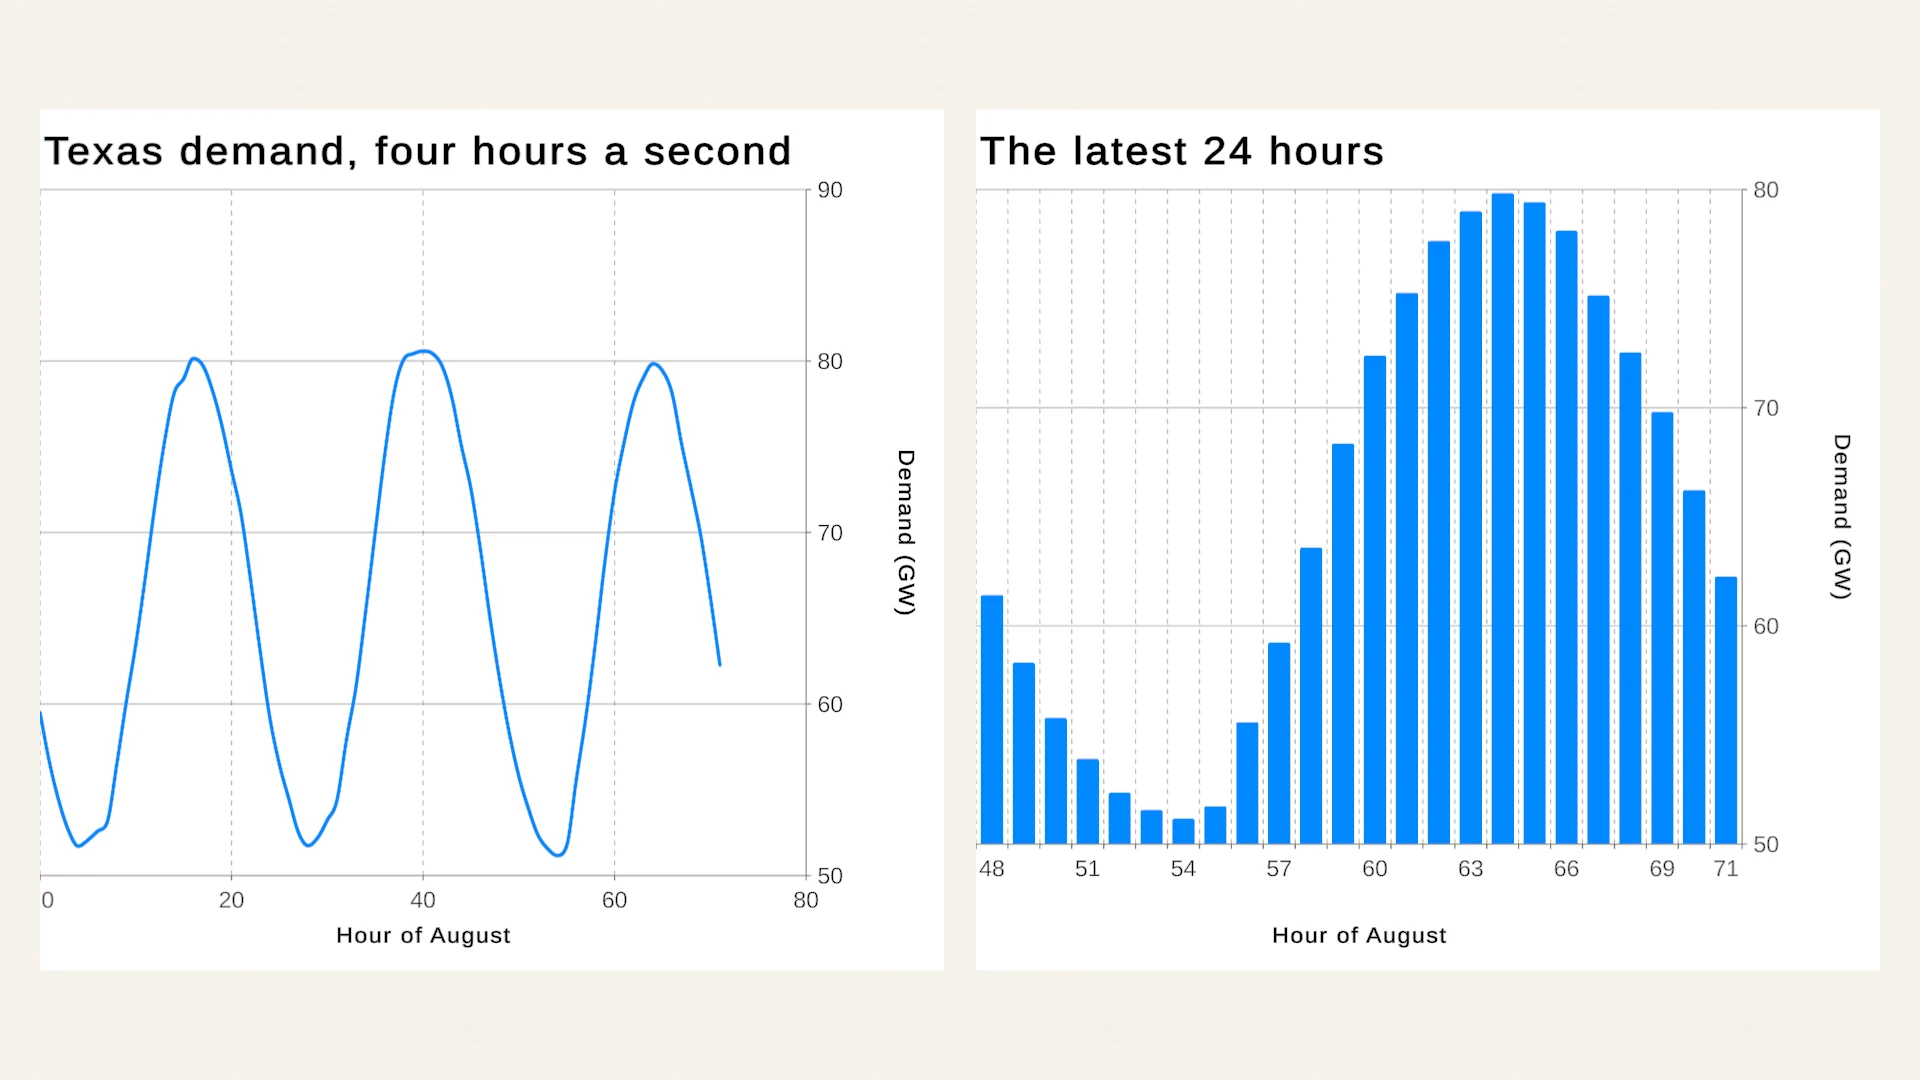
Chart Guru streams live values into Unity charts through a fixed-capacity ring buffer you can push from any thread, web sources that poll with backoff, and your own adapters. Stable updates are tested to allocate nothing after warm-up.ArticleLearn Unity charts with real data: the 27 lessons
How the Chart Guru examples teach charts in Unity: tracks from a showcase to production apps, credited public datasets with their licenses, and why real data exposes layout problems that tidy demo numbers hide. Use case