Debug overlays and gameplay graphs in Unity
Graph frame time per system, AI states, economy and latency in Unity debug overlays with Chart Guru ring buffers, corner sparklines and budget rules. Graphy covers FPS.
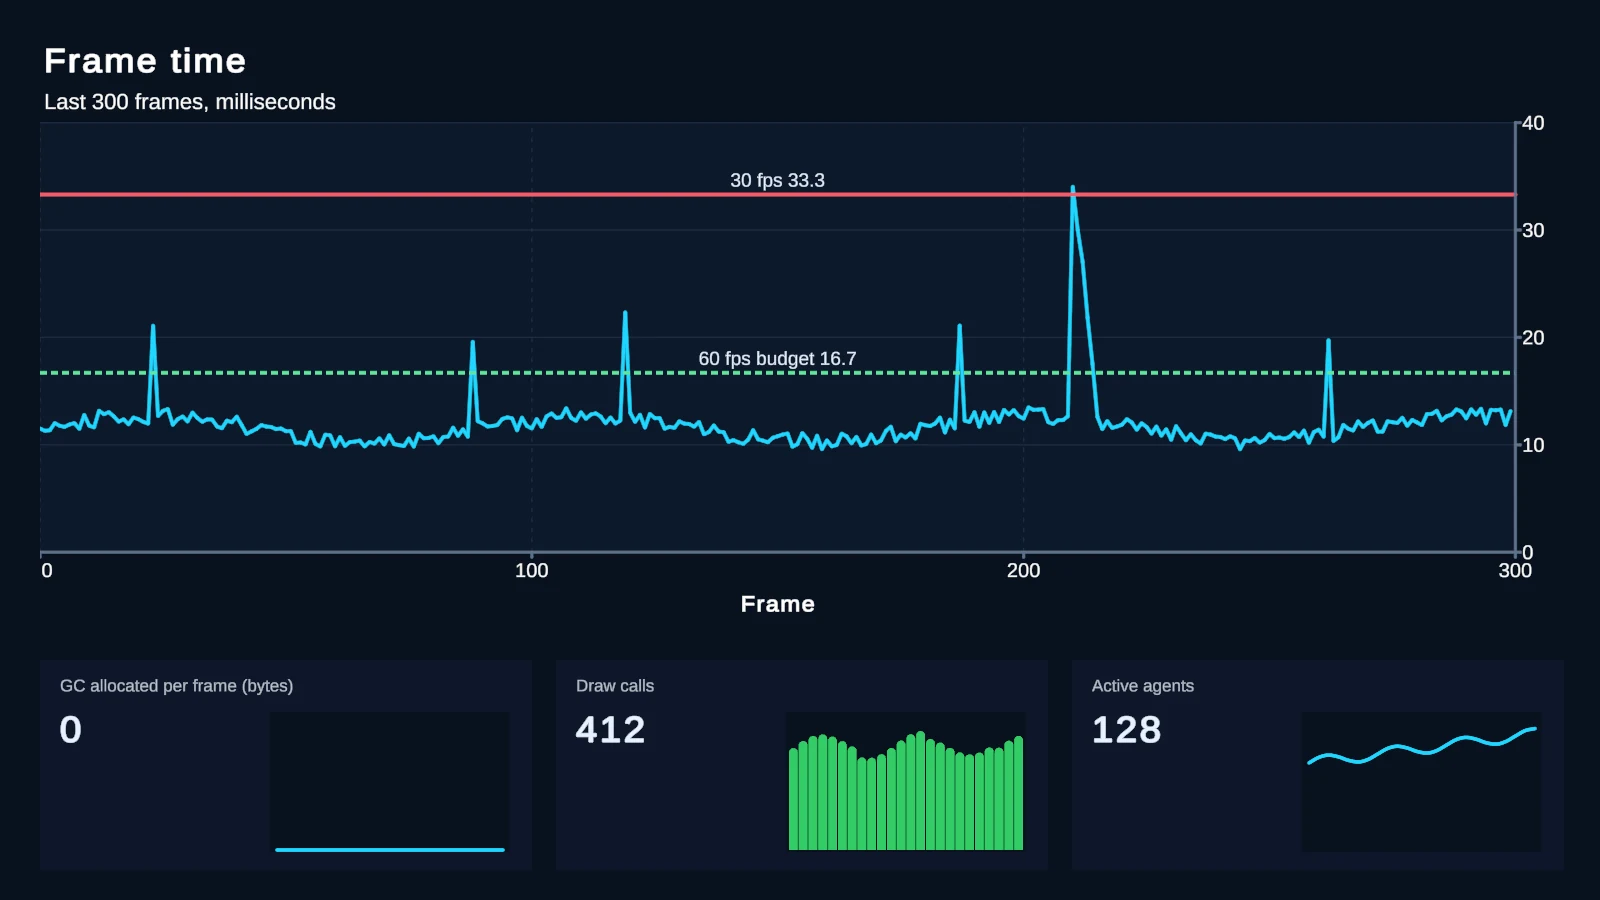
Every project grows a debug overlay. It starts with an FPS number, and then someone needs to see whether pathfinding spikes when a wave spawns, whether the economy inflates after hour three, or how latency behaves on a bad connection. A number that flickers every frame cannot answer those questions. A graph with a visible window and a budget line can.
When Graphy is the better choice
Graphy is a free, MIT-licensed FPS counter, stats monitor and debugger with FPS, memory and audio graphs. Version 4.0 (August 2026) added URP support and raised its minimum to Unity 2022.3, and its Asset Store page shows 5 stars from 215 ratings (checked November 2026). It drops into a scene and works without setup. If the overlay should show frame rate and memory, install Graphy and stop there. To find out why a frame is slow, use Unity’s Profiler; an overlay only tells you that it was slow, and when.
What Chart Guru adds: graphs of your own values
Chart Guru is a general chart library, so it graphs whatever you measure:
| Value | Chart |
|---|---|
| Frame time per system, measured with a Stopwatch or Unity’s ProfilerRecorder | Line chart with a budget rule |
| Agents per AI state | Stacked areas or bars per state |
| Gold earned and spent, items crafted | Lines or stacked areas over time |
| Network round trip time | Line chart with a threshold, or a sparkline per connection |
| Any single value at a glance | Sparkline or Indicator in a corner |
Push a value every frame
RingBufferChartDataSource is built for this. It keeps a fixed number of samples and drops the oldest first, takes a push from any thread in constant time, publishes to its charts at most once per frame in LateUpdate, and once full it updates its published frame in place, so steady streaming allocates nothing.
using ChartGuru;using UnityEngine;
public sealed class FrameTimeGraph : MonoBehaviour{    [SerializeField] private ChartGraphic _graph;    private RingBufferChartDataSource _frameTimes;
    private void Awake()    {        _frameTimes = _graph.gameObject.AddComponent<RingBufferChartDataSource>();        _frameTimes.Capacity = 300; // about five seconds at 60 fps        _frameTimes.SeriesName = "Frame (ms)";    }
    private void Update() => _frameTimes.Push(Time.unscaledDeltaTime * 1000f);}
Point the script at a Line or Sparkline chart; a source on the chart’s GameObject feeds it without further setup. The capacity is the visible window: 300 samples is about five seconds at 60 fps. Push(x, y) stores an explicit X value instead of the sample index. The ring buffer is hidden from the Add Component menu, so code adds it, and each buffer publishes one value column, so give each value its own buffer and chart. Several pushes in one frame still publish once. The data sources documentation lists the other sources.
Layouts that stay out of the way
Sparklines in a corner. The compact chart types hide axes and padding. A column of sparklines, one per system, shows the shape of each signal in a few pixels of height, and an Indicator shows a single value.
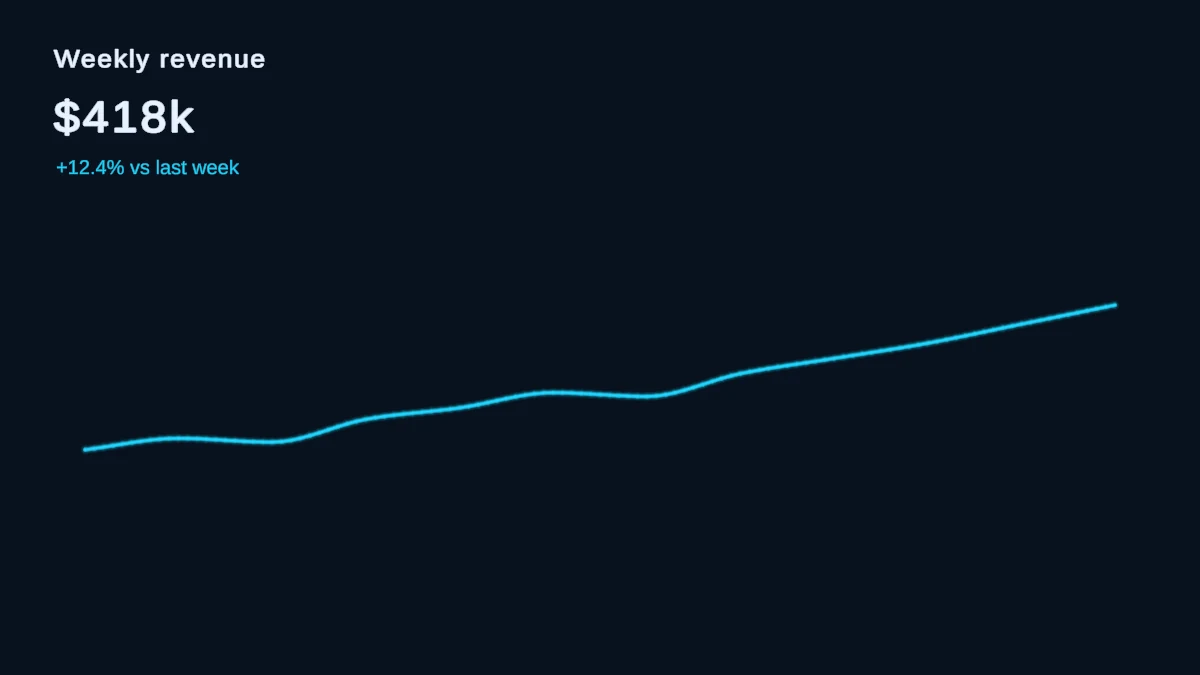 A sparkline card: a label, the latest value and the trend, without axes.
A line chart with a visible window. When the numbers matter, use a full line chart with a Y axis in milliseconds. The ring buffer’s capacity sets how much history the chart keeps; for longer captures, scrollable axes and a visible domain show the latest interval of a longer series.
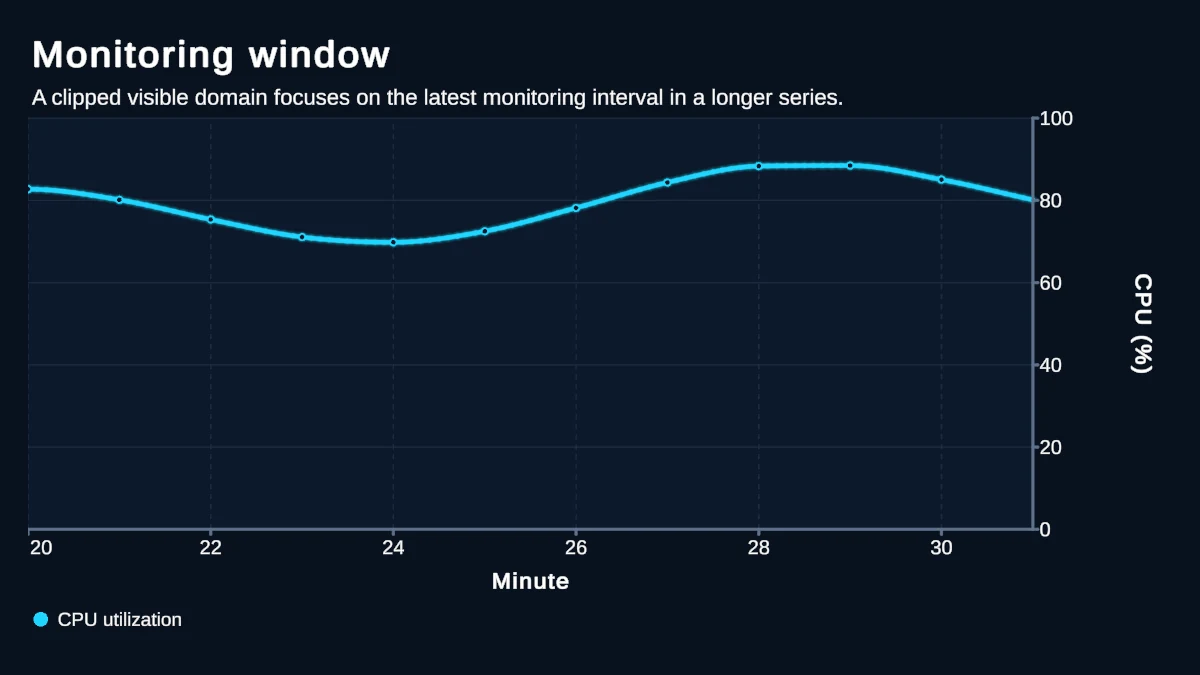 A clipped visible domain shows one interval of a longer series.
Budget rules. A horizontal rule at 16.6 ms marks the frame budget at 60 fps, and one at 33.3 ms the budget at 30 fps. Add it on the Marks tab with Customize Layers as a target rule with a caption, or as RuleMark.Horizontal on a chart built in code. Hover tooltips read the exact value of a spike that crosses the line.
Where the overlay lives
- Canvas. A Chart Graphic on a Screen Space Overlay Canvas draws over the game view, next to the rest of a uGUI debug panel.
- UI Toolkit. A
ChartGuruElementgoes into a runtime panel’s UXML. A UI Toolkit Chart Binder connects it to a ring buffer on the binder’s GameObject or a parent, or you assign the element’s DataSource in code. - Editor windows. The same element works in an EditorWindow, and the Inspector Charts guide sample draws a chart inside a custom inspector. See charts in editor windows.
- Builds. Charts are runtime components without a UnityEditor dependency, so the overlay runs in a development build on the device under test. Wrap the feeding script in a DEVELOPMENT_BUILD or UNITY_EDITOR check if it must never ship.
What the overlay costs
A debug overlay should not distort what it measures. Chart Guru’s stable updates are tested to allocate no managed memory after warm-up, and the ring buffer publishes at most once per frame however often you push. Keep the overlay cheap the way you would any UI: hide data labels on dense charts, use compact types for small signals and keep each chart close to its displayed size. Then profile the overlay once, so you know its share of the frame. The performance guidance lists more, and real-time graph performance explains the streaming path.
Limits
- Chart Guru is not a profiler. It has no call stacks and reads no engine counters by itself; you decide what to measure and push.
- It has no ready-made FPS and memory widget. Graphy has one.
- One ring buffer holds one series. Several series in one chart need a custom
ChartDataSourceorSetDatawith a frame of several columns, as covered in real-time graphs in Unity.
The Chart Guru product page shows the compact and full chart types, and Chart Guru is available on the Unity Asset Store.
Frequently asked questions
Should I use Chart Guru or Graphy for an FPS counter?
Graphy. It is free, works without setup and shows FPS, memory and audio graphs. Chart Guru is for graphs of your own gameplay and system values, with axes, budget rules and tooltips, and the two can run side by side.
Does pushing a value every frame allocate memory?
Not in steady state. RingBufferChartDataSource updates its published frame in place once the buffer is full, and Chart Guru's tests check that stable updates allocate no managed memory after warm-up.
Easy, reliable charts for Unity, from sparklines to multi-series 3D.
Keep reading
 Use case
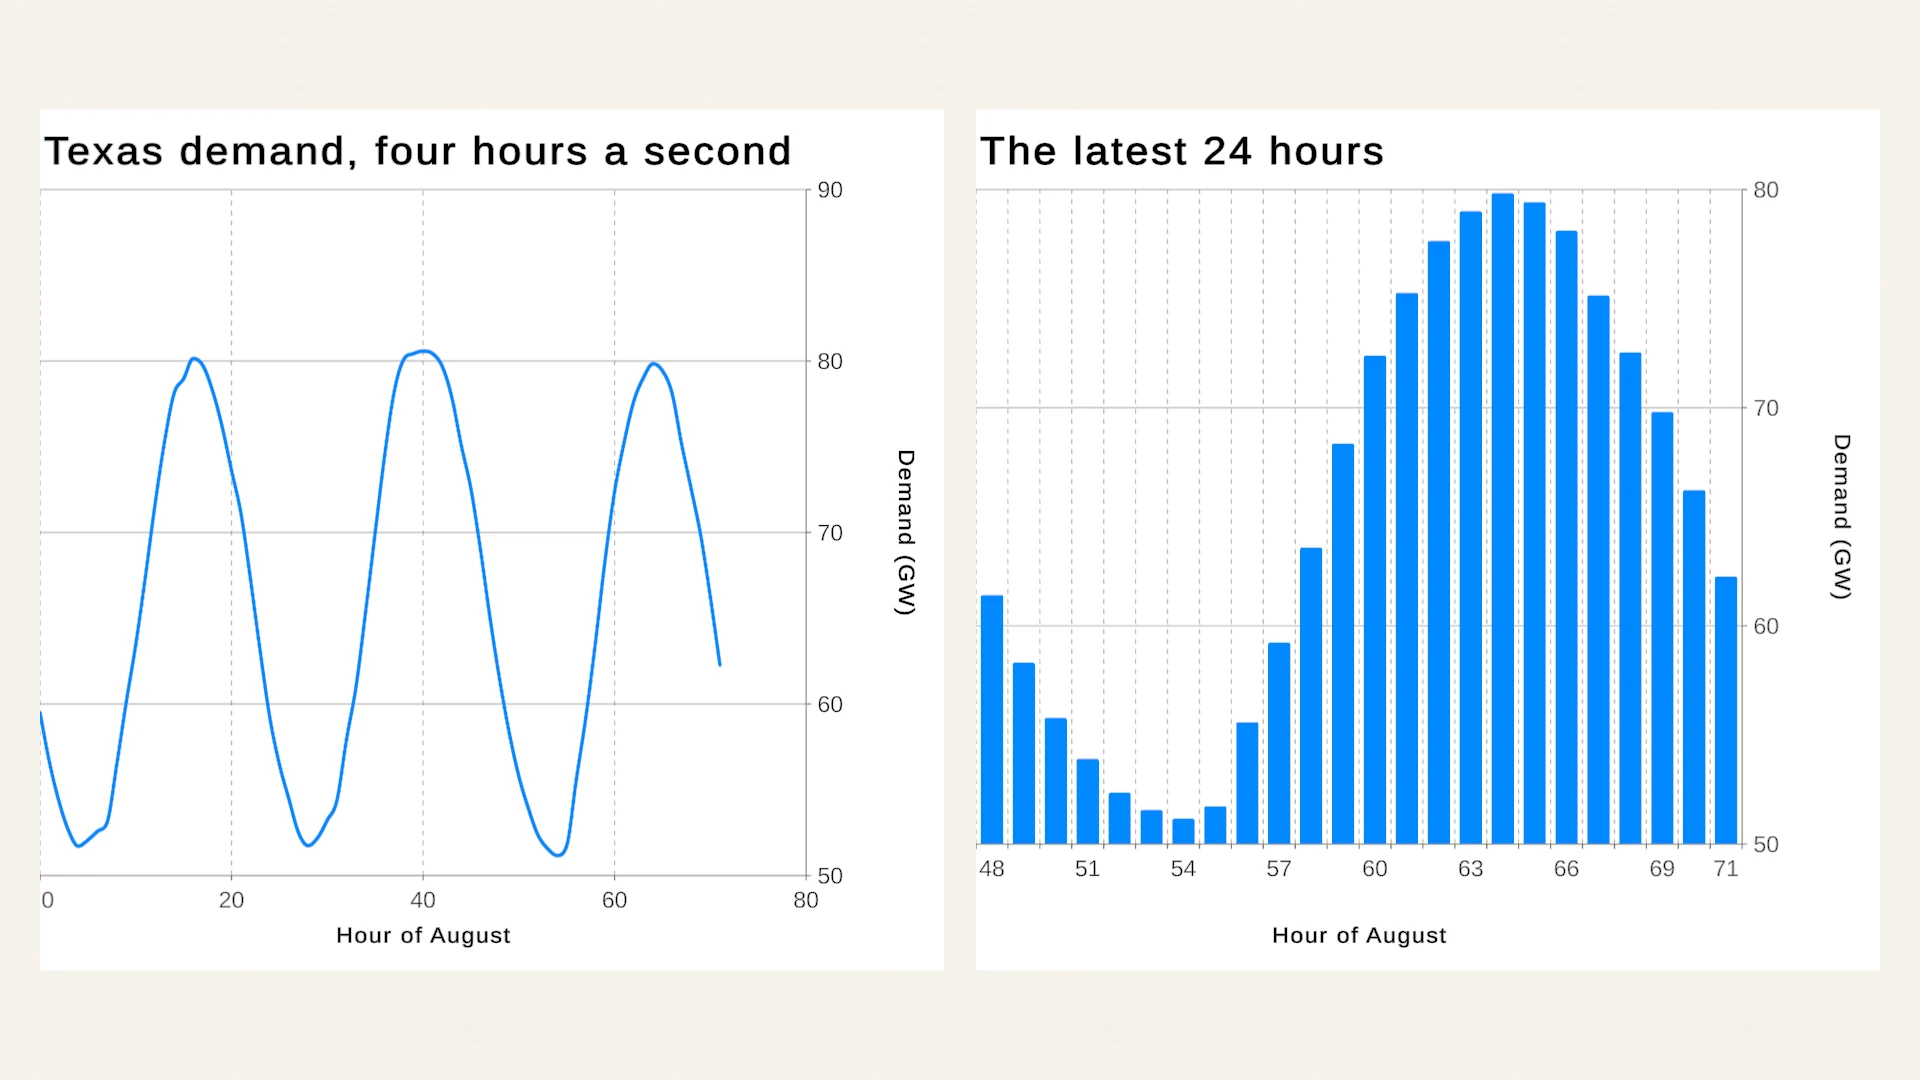
Real-time graphs for live and high-volume data in Unity
Chart Guru streams live values into Unity charts through a fixed-capacity ring buffer you can push from any thread, web sources that poll with backoff, and your own adapters. Stable updates are tested to allocate nothing after warm-up.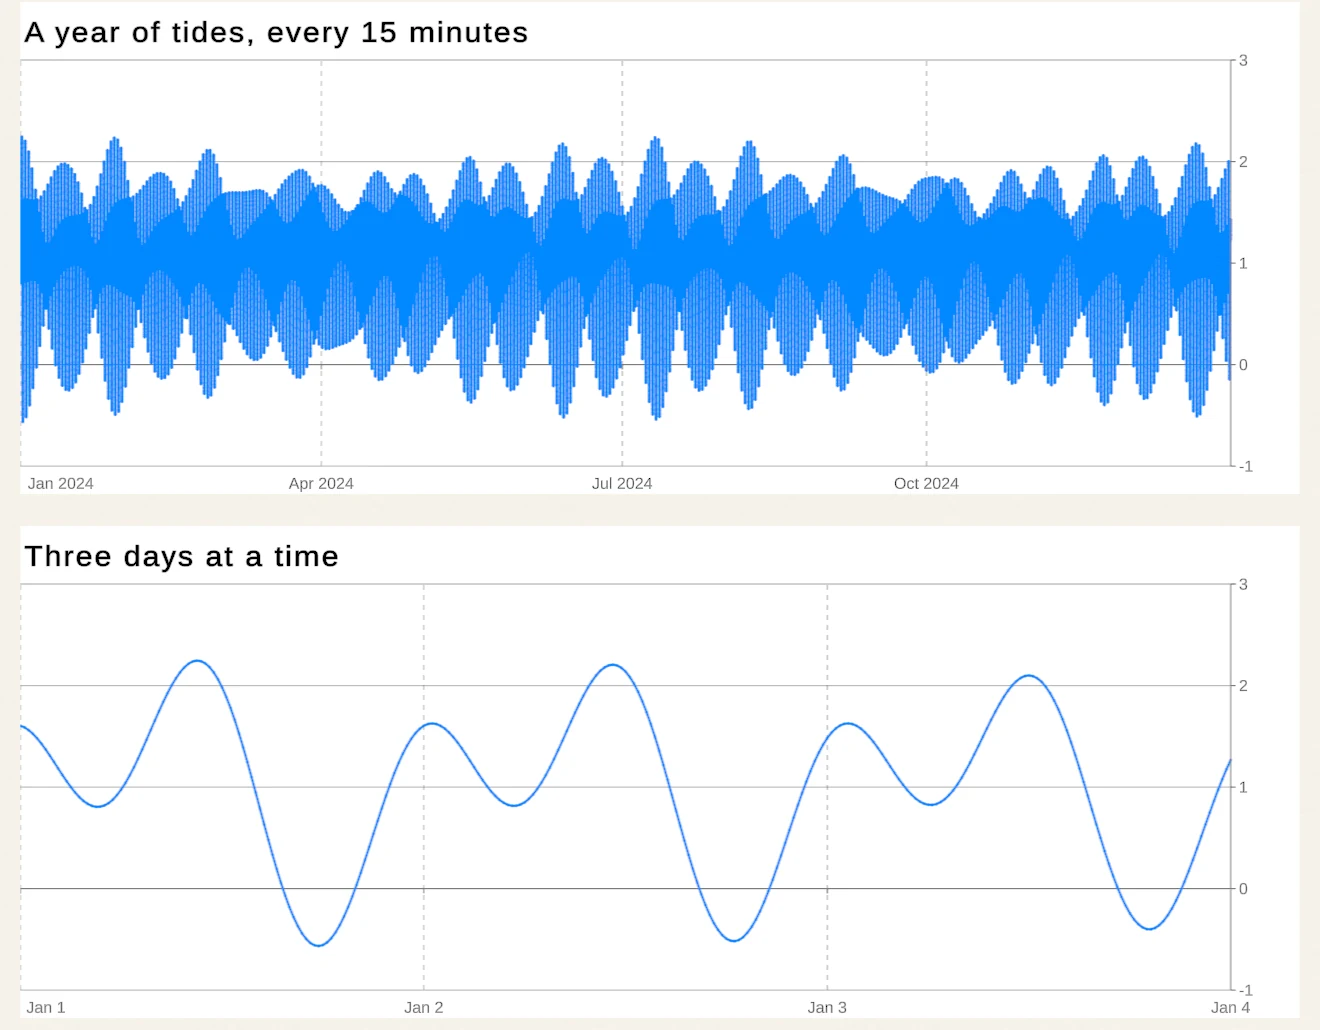 Article
Real-time graphs in Unity without GC spikes
Texture redraws, per-point objects and per-frame allocations make live graphs stutter. How Chart Guru for Unity streams data through a thread-safe ring buffer and in-place updates, what its performance guidance recommends, and what a 35,136-point lesson shows.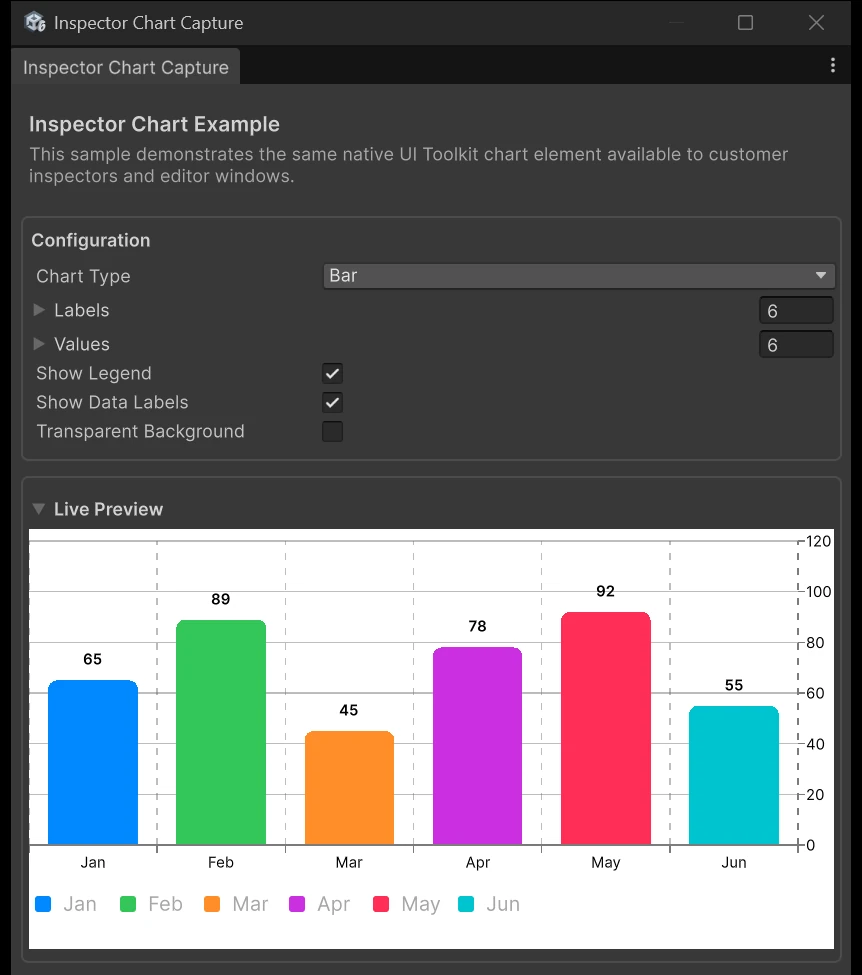 Use case