Charts in Unity editor windows and custom inspectors
Draw charts in Unity editor windows and custom inspectors with Chart Guru's UI Toolkit chart element: Edit Mode rendering, CreateInspectorGUI previews and data export.
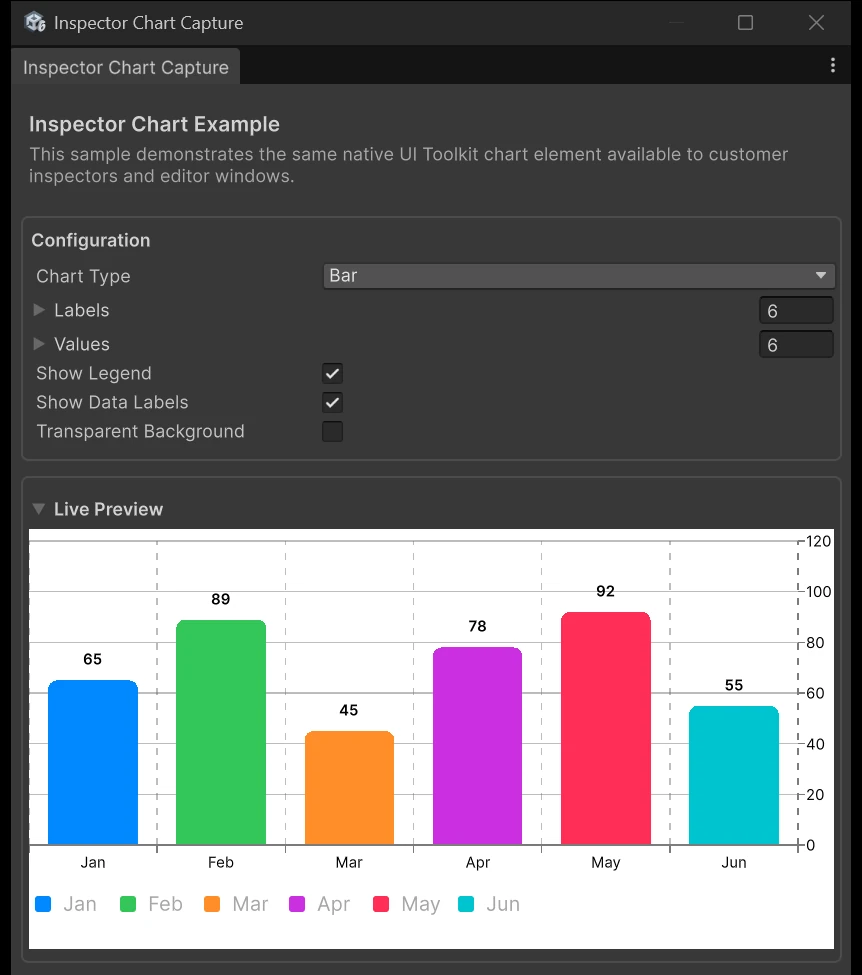
Tool builders keep needing charts inside the Editor: build sizes per platform over the last releases, asset counts by type, test durations, balancing curves for a game economy, timings exported from a profiling session. Unity draws charts in its own Profiler, but those classes are internal, so the usual answer has been GL calls, textures or a hand-written Painter2D graph. Chart Guru’s UI Toolkit chart element works in editor windows and custom inspectors, renders in Edit Mode and uses the same API as its runtime charts.
A chart in an editor window
ChartGuruElement is a regular VisualElement. Add it to an EditorWindow’s rootVisualElement in CreateGUI and give it a chart built in code:
using ChartGuru;using UnityEditor;using UnityEngine.UIElements;
public sealed class BuildSizeWindow : EditorWindow{    [MenuItem("Window/Build Sizes")]    static void Open() => GetWindow<BuildSizeWindow>("Build Sizes");
    void CreateGUI()    {        var chart = new ChartGuruElement();        chart.style.flexGrow = 1f;        rootVisualElement.Add(chart);        chart.SetChart(Chart.Create()            .Add(new BarMark(PlottableValue.Value("Group", "Textures"), PlottableValue.Value("MB", 412f)))            .Add(new BarMark(PlottableValue.Value("Group", "Meshes"), PlottableValue.Value("MB", 268f)))            .Add(new BarMark(PlottableValue.Value("Group", "Audio"), PlottableValue.Value("MB", 95f)))            .ChartYAxis(axis => axis.Label("Size (MB)"))            .Build());    }}
The chart lays out in panel points, renders sharp at the Editor’s display scale and follows the window as you resize it. Hover tooltips and selection work as they do at runtime. Chart Guru’s own Chart Designer, theme preview and chart asset previews are built on the same element, so the API that draws your tool’s chart is the one the package uses for its own editor.
A chart in a custom inspector
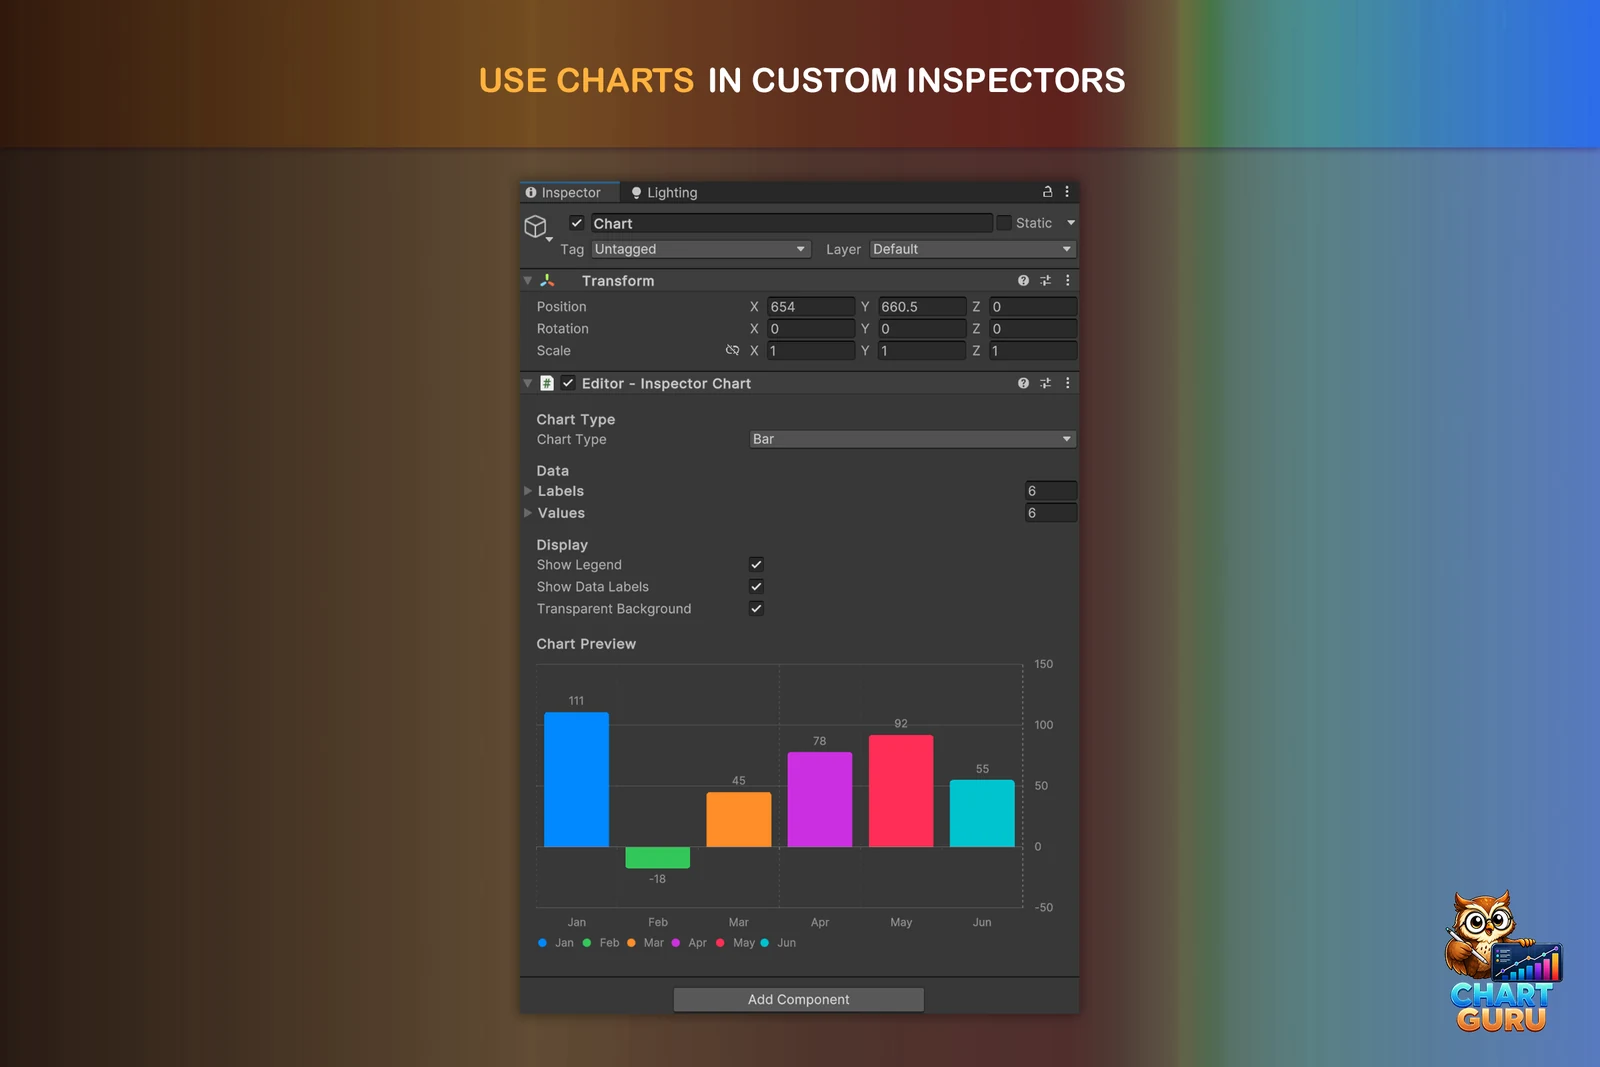
The Guides/Inspector Charts sample shows a component whose inspector draws its values as a chart. Add it through Add Component > Chart Guru > Examples > Guides > Inspector Chart, then change the chart type, labels, values, legend, data labels or background and watch the preview follow.
The pattern is short. In CreateInspectorGUI, build your fields, add a ChartGuruElement with a fixed height, and rebuild the chart whenever the serialized object changes:
- Create the root and add a
PropertyFieldfor each serialized property. - Add
new ChartGuruElement()with a height such as 280 pixels. - Call
root.TrackSerializedObjectValuewith theserializedObjectand a callback that runsRebuildPreview(), so every edit redraws the chart. - In
RebuildPreview, build the chart withChart.Create()from the component’s values and pass it toSetChart.
What about IMGUI
Chart Guru’s IMGUI drawing helpers are internal to its editor assembly, and the manual notes that IMGUI rendering does not provide the same annotation presenter as Canvas and UI Toolkit. For your own tools the UI Toolkit element is the supported route. An IMGUI-based inspector can switch to CreateInspectorGUI; an IMGUI window can add the chart to rootVisualElement, and Unity’s IMGUIContainer keeps existing IMGUI code running beside it.
Saved designs or charts built in code
Editor tools can use both of Chart Guru’s authoring routes:
- A saved chart asset. Design the chart in the Chart Designer and save it with Save as Asset, or create one with Assets > Create > Chart Guru > Chart and edit it in its Inspector, then assign it to the element’s
DefinitionAsset. Your tool then only supplies data withSetData(frame), and a designer can restyle the chart without touching your code. - A chart built in code. Use
Chart.Create()andSetChart, as above, when the tool computes everything itself.
Data that comes from your tool is usually easiest to pass as a ChartDataFrame with SetData. Data source components such as the CSV or Web sources live on GameObjects; element.DataSource accepts one from code. Web sources send no requests in Edit Mode unless you turn on their RunInEditMode option, so an editor tool that polls a server should enable it deliberately.
Reports: export data and images
Editor tools often end in a report. Chart Guru exports both the data and the picture:
ChartDataExporter.ToCsv(chart)andToJson(chart)return deterministic, semantic data for any chart, andWriteCsvandWriteJsonsave it to a path you choose. The export describes the marks and what they mean, not the pixels.- The
ChartGraphicmethodsEncodeOutputPng(includeText)andSaveOutputPng(path, includeText)read the image back from the GPU, with or without titles, axes, legends and data labels. They work in Edit Mode as well. - The chart Inspector’s Export PNG action saves a chart’s image as an asset.
The PNG methods belong to the Canvas host, so a report tool that needs images can show the same chart asset on a ChartGraphic and export from there. For a text summary, GetAccessibilitySummary() describes the chart in words.
What Unity offers instead
| Option | What it is | Fit for data charts |
|---|---|---|
| Profiler chart widgets | Internal classes behind Unity’s Profiler window | Not public API |
CurveField and GradientField | Editor fields for editing an AnimationCurve or Gradient | Editing, not plotting data |
| Painter2D | Vector drawing in UI Toolkit | Possible, but axes, labels and interaction are yours |
| Graph Toolkit and GraphView | Node graph editors | A different kind of graph |
Painter2D remains a good choice for a single custom shape. Once a tool needs axes that adapt to the data, labels that avoid collisions, tooltips and several chart types, a chart library saves that work.
Limits
- The Swift importer, the C# generator and the Designer are editor tools; the charts they produce also run in builds.
- PNG export is a Canvas host feature; a chart in an editor window exports its data directly and its image through a Canvas chart.
- Data source components need a GameObject. Pure editor tools usually pass frames with
SetDatainstead.
The rendering paths page lists every host and export call, and build your first chart explains saved charts and charts built in code. The Chart Guru product page shows the rest of the package, and Chart Guru is available on the Unity Asset Store.
Frequently asked questions
Can I use the charts from Unity's Profiler in my own tools?
No. The Profiler's chart classes, such as LineChartWidget and BarChartWidget in Unity's C# reference source, are internal editor code and not public API. Unity's public UI Toolkit elements include CurveField and GradientField for editing, but no data chart.
Does it work in IMGUI inspectors?
Chart Guru's own IMGUI drawing helpers are internal, and the UI Toolkit element is the supported route. Return a root VisualElement from CreateInspectorGUI, or add the chart to an EditorWindow's rootVisualElement; Unity's IMGUIContainer lets existing IMGUI code run beside it while you migrate.
Easy, reliable charts for Unity, from sparklines to multi-series 3D.
Keep reading
 Use case
Charts in UI Toolkit and UI Builder
Unity ships no chart control for UI Toolkit, only a Painter2D pie chart tutorial. Chart Guru adds ChartGuruElement for UXML, UI Builder, runtime panels and editor windows, with data binding, tooltips and live updates.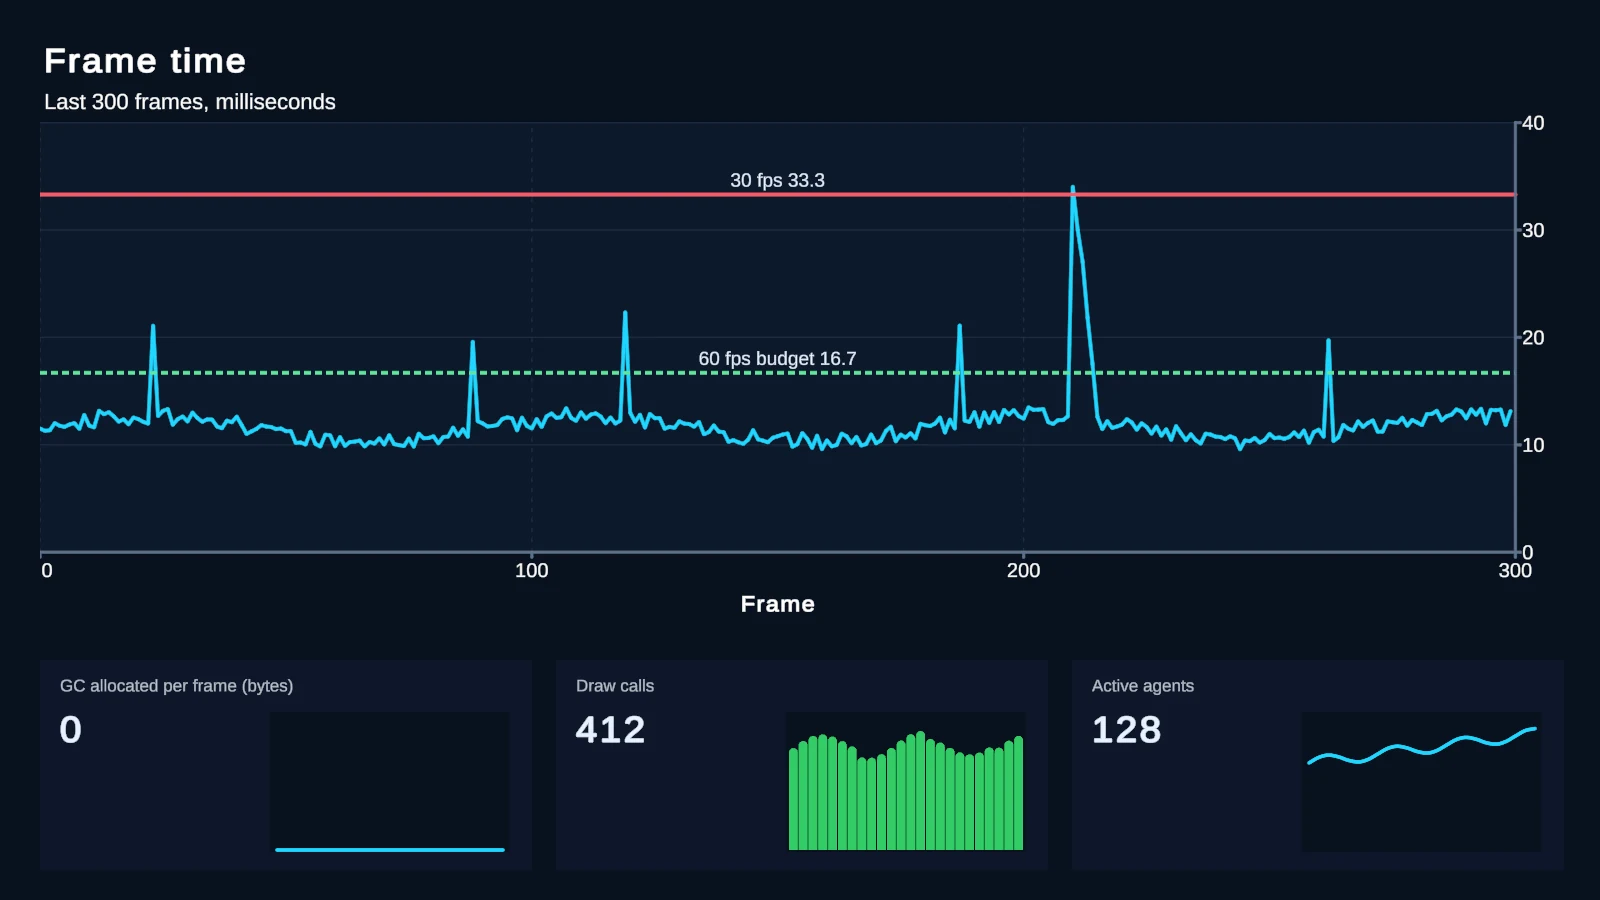 Use case
Debug overlays and gameplay graphs in Unity
For an FPS and memory monitor, use the free Graphy. Chart Guru is for graphs of your own values: push them into a ring buffer every frame, show sparklines in a corner and mark budgets such as 16.6 ms.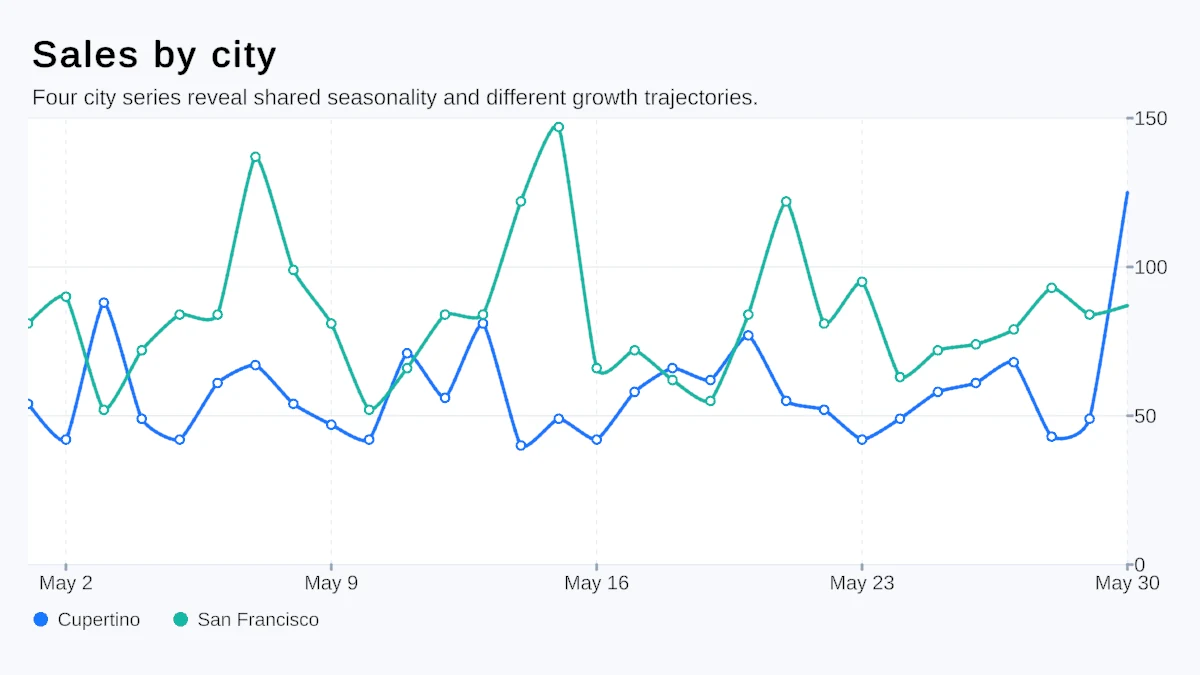 Article