Real-time graphs for live and high-volume data in Unity
Plot live sensor, telemetry and web data in Unity: a thread-safe ring buffer, web polling with backoff, adapters for MQTT, serial or OPC UA clients, and scrolling windows.
Live data in Unity usually starts with a LineRenderer updated every frame, a texture filled with SetPixels, or a mesh rebuilt for each sample, and forum threads about those approaches keep returning to the same performance problems. Chart Guru gives live data its own path: values go into a data source, the source publishes once per frame, and the chart updates its marks in place.
This page covers the pieces: a ring buffer for pushed samples, web polling, adapters for clients Chart Guru does not ship, scrolling windows, mock streams for testing, and two lessons to start from.
Push samples from any thread
RingBufferChartDataSource keeps a fixed number of samples. Push(y) appends a value at the next sample index and Push(x, y) appends one with an explicit X, such as the seconds since recording started. Pushing is thread-safe and O(1), the buffer publishes at most once per frame, and once it is full it updates its published frame in place, so steady streaming allocates nothing.
using ChartGuru;using UnityEngine;
public sealed class SensorFeed : MonoBehaviour{    RingBufferChartDataSource _buffer;
    void Awake()    {        // Charts on this GameObject, or below it without data of their own, read this source.        _buffer = gameObject.AddComponent<RingBufferChartDataSource>();        _buffer.Capacity = 600;        _buffer.SeriesName = "Temperature";    }
    // Call this from your sensor, serial or network callback, on any thread.    public void OnSample(float value) => _buffer.Push(value);}
Charts have no source field. A source on a chart’s GameObject feeds that chart, and a source on a parent feeds every chart below it that has no data of its own, so one buffer can drive a line chart and a sparkline at the same time. The ring buffer is added from code because it is hidden from the Add Component menu, and ClearData() empties it.
Poll a web endpoint
WebChartDataSource requests an HTTP or HTTPS endpoint and publishes CSV or JSON responses as typed tables. It handles the details that make polling dashboards fragile:
PollIntervalSecondssets the interval; zero means a single request. Transient failures back off instead of hammering the server.- A newer refresh supersedes an older one, so a late response never replaces newer data, and disabling the source cancels its work.
- Parsing runs on a worker thread and publishing on the Unity thread.
RefreshAsync(CancellationToken)lets you await a refresh, andRefreshStateChanged,IsRefreshing,LastRefreshErrorandLastRefreshUtcdrive a loading or error state in your UI. - Credentials go in through
SetRuntimeHeaderor a header read from an environment variable; runtime header values are never serialized. - Nothing is requested in Edit Mode unless you turn on
RunInEditMode, so opening a scene never sends silent traffic.
Files, JSON payloads and Google Sheets use the same refresh model; see live charts from Google Sheets, CSV and JSON.
Bring MQTT, serial or OPC UA through an adapter
Chart Guru does not ship an MQTT, serial port or OPC UA client, and it does not need to. Keep the client library you already use and forward its values in one of two ways:
- Push into a ring buffer from the client’s callback, as in the snippet above. This is the shortest path for single values or X/Y samples, and it is safe from any thread.
- Write a custom source for wider tables. Derive from
ChartDataSource, build aChartDataFrameinRefresh()and callPublish(frame). To stream into a table of fixed shape, keep the published columns, write new values withOverwriteValuesand callPublishValueChange()once; the charts update their marks in place without allocating. Publish a new frame when the columns or the row count change. Unlike the ring buffer, a custom source changes its frame on the Unity thread, so hand values over from the client thread first.
The Large Datasets lesson’s tide source is a complete custom source in about 60 lines. The data sources page documents the contract.
Scrolling windows and visible domains
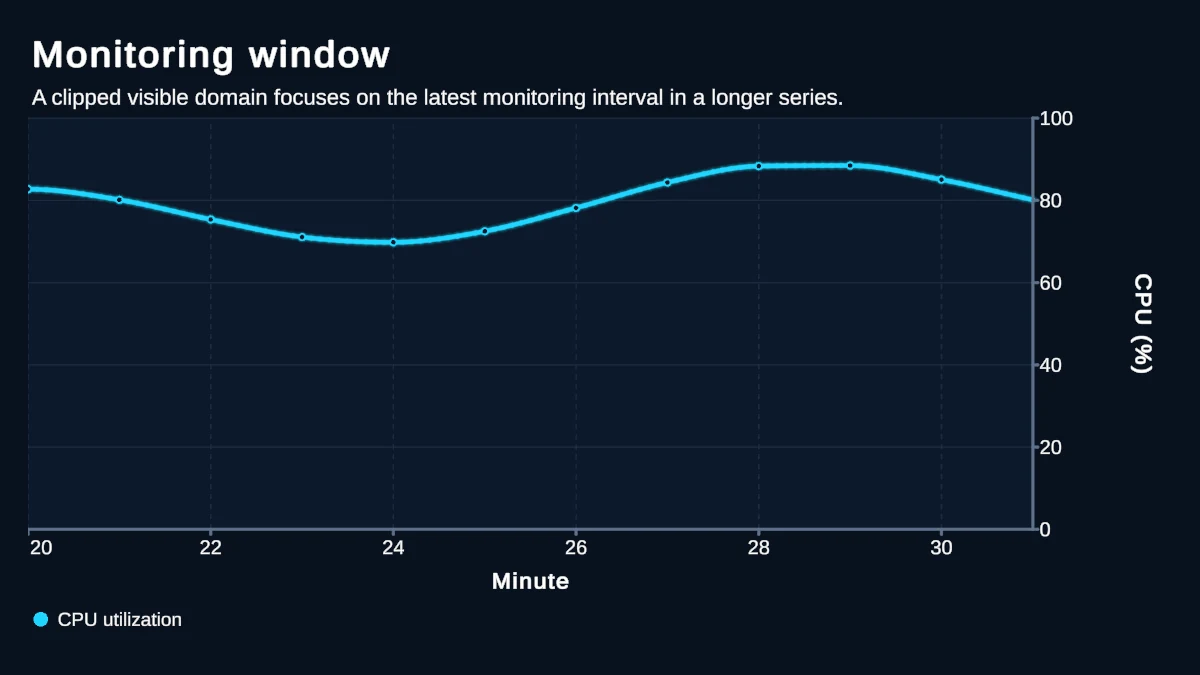
The ring buffer’s capacity is a sliding window: it keeps only the latest samples, so its charts scroll while the host updates the marks in place. When users need the history as well, keep the full series and show part of it. ChartScrollableAxes(ScrollableAxes.Horizontal) with ChartXVisibleDomain(length) in code, or the scrolling settings on the Inspector’s Behavior tab, make a chart show a window of the data that users can drag and zoom.
The Scrolling and Paging lesson pages through a year of daily demand peaks on the Texas grid thirty days at a time, and keeps ten years of the Mauna Loa carbon dioxide record in view. Drag the daily peaks sideways and they settle one page at a time.
Test before the hardware exists
You can design and stress-test a live chart before the sensor, broker or backend is ready. MockChartDataSource generates patterned data with the included Mock Magic tool and streams it: StartStreaming() emits rows at a constant, random, burst or drip rhythm, where drip sends single rows at irregular gaps like sensor reads or trades. Appending continues the pattern from the edge it extends instead of restarting it, and a deterministic seed replays the same sequence for repeatable tests. When the real feed arrives, swap the mock source for the real one and check the column mapping on the chart’s Marks tab.
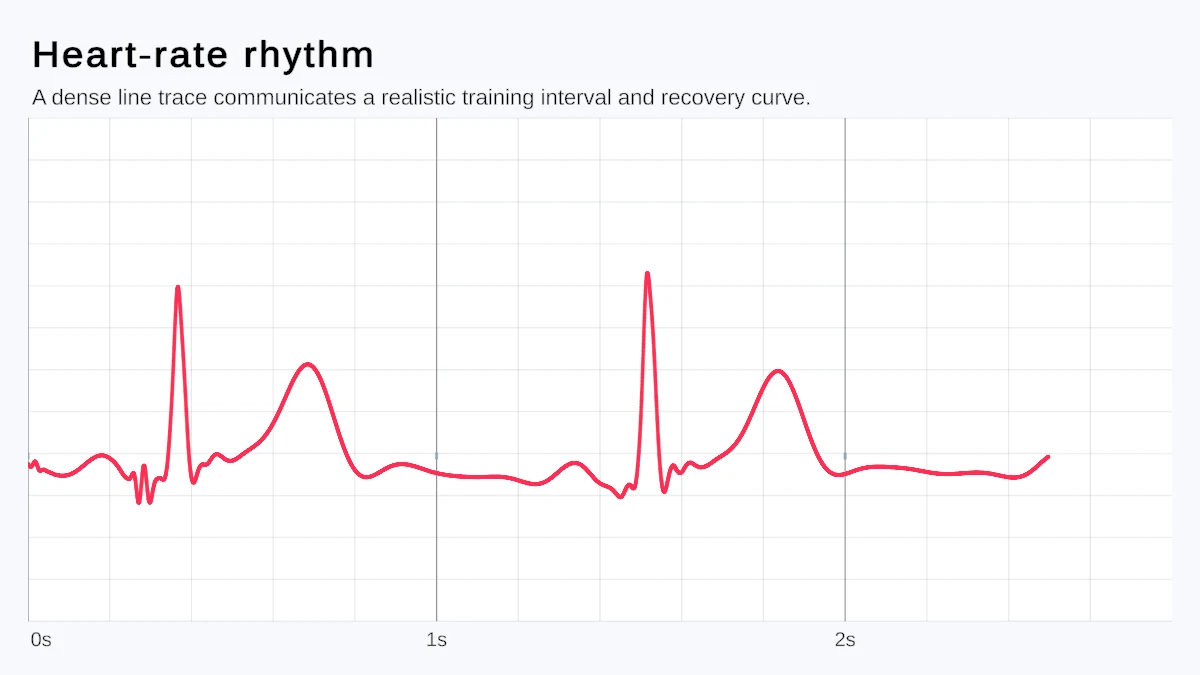
Mock Magic is also available on its own for test data outside charts.
Two lessons to start from
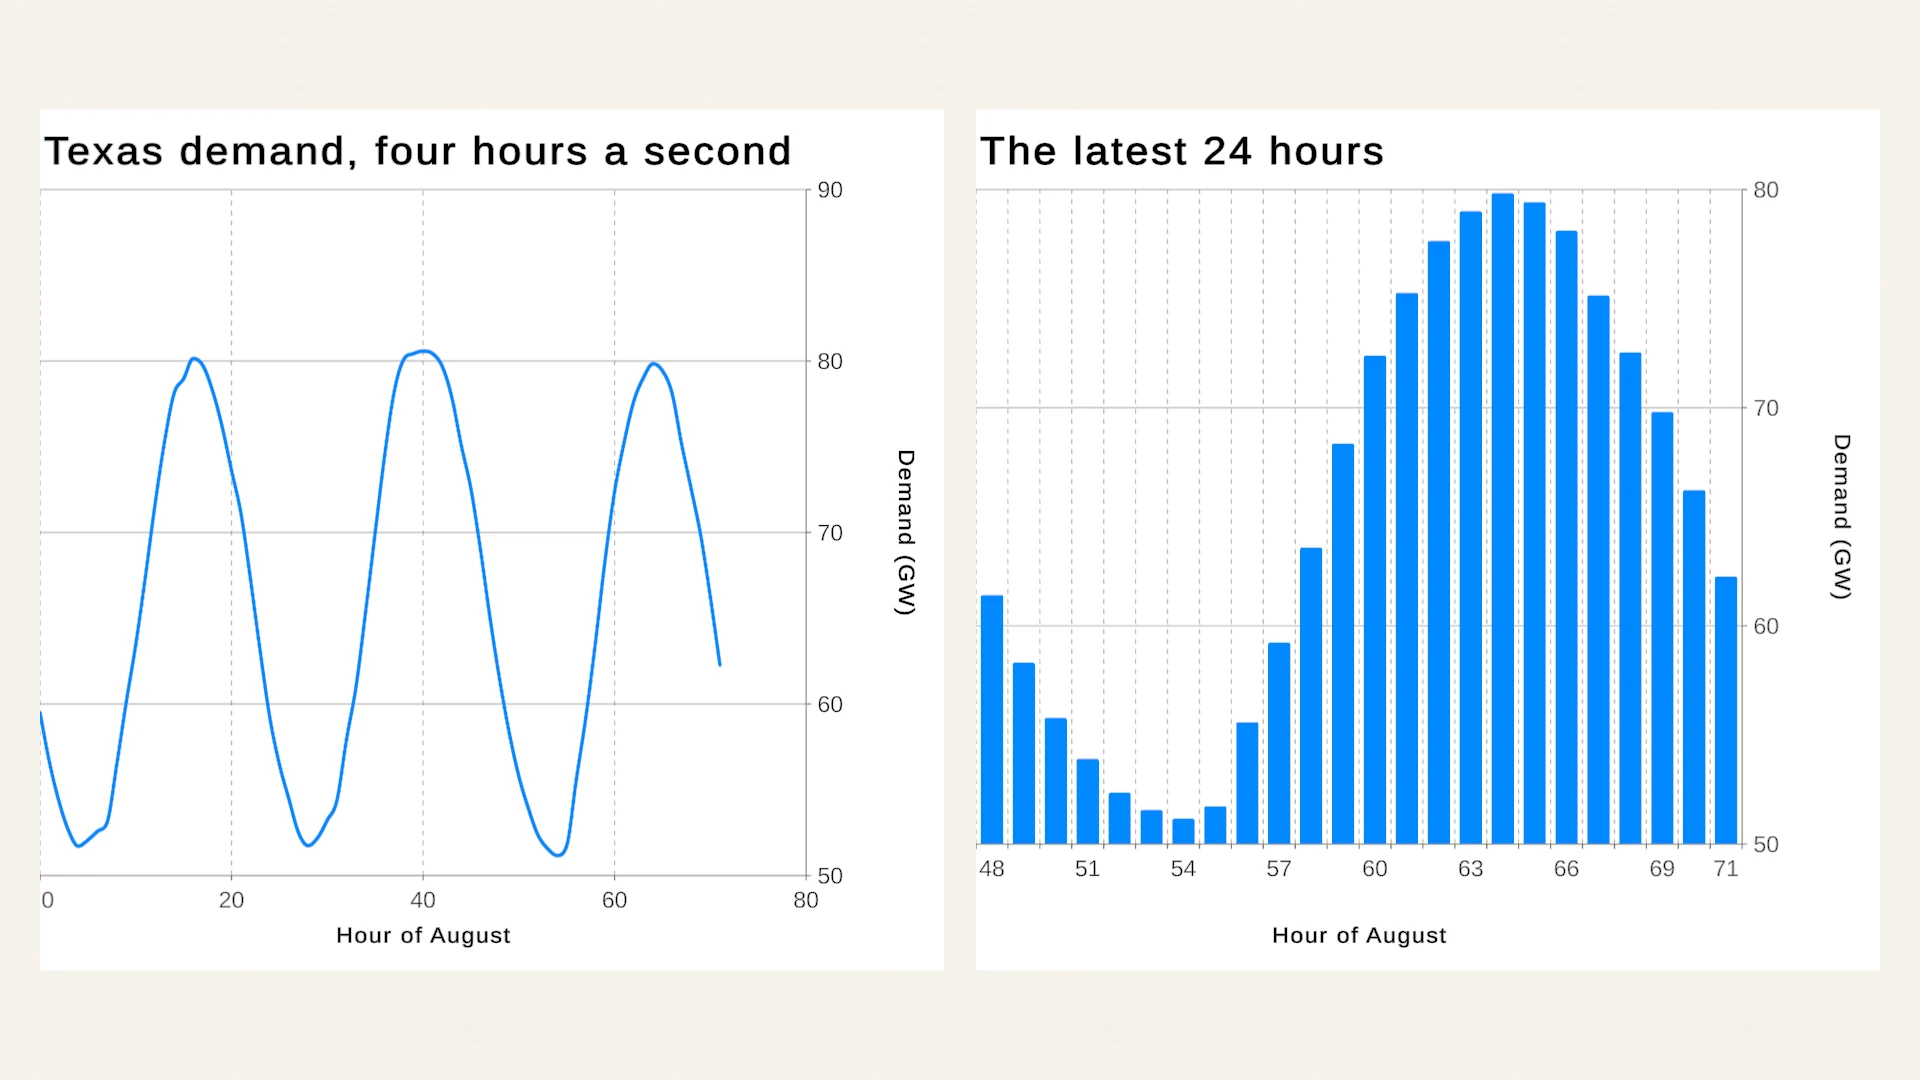
The Live Data lesson replays all 744 hours of August 2024 electricity demand on the Texas ERCOT grid, from the U.S. Energy Information Administration, into ring buffer sources at four recorded hours a second. One chart shows the latest 24 hours as bars, the other the running demand line, and both scroll as new hours arrive.
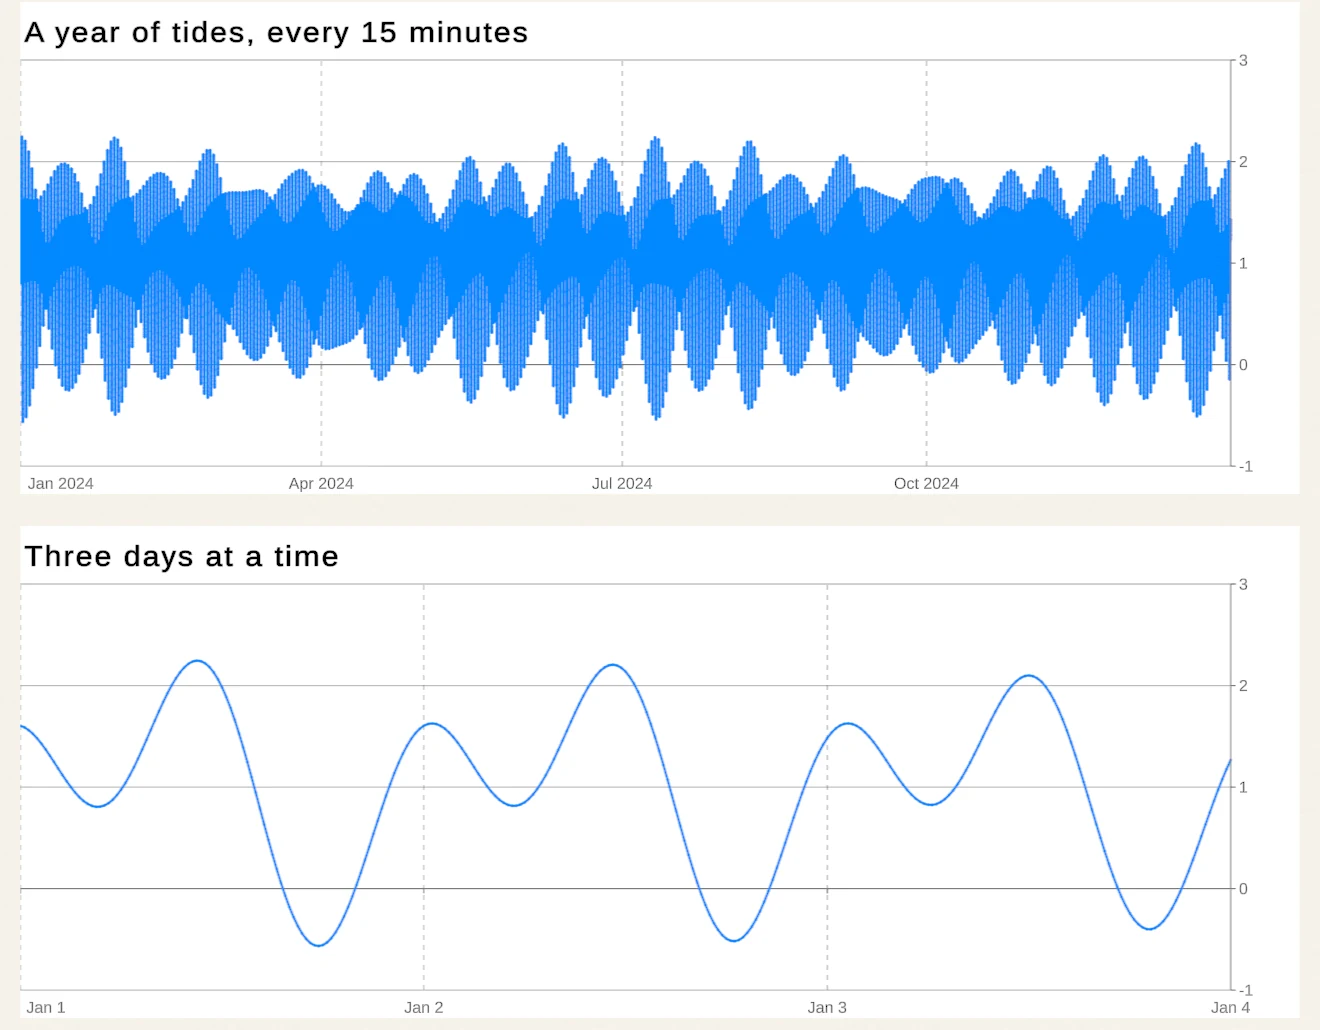
The Large Datasets lesson charts 35,136 points: a year of tides predicted every 15 minutes, computed the way tide tables are made from eight harmonic constituents. One chart draws the whole year, the other scrolls through it three days at a time.
What keeps updates cheap
- Value-only updates. When columns, row count and categories stay the same, hosts reuse them and change only the values. Use
SetData(frame, shapeChanged: false)on saved charts andSetValueson charts built in code. - Tested allocation behavior. Stable updates are covered by allocation tests that expect zero managed allocations after warm-up.
- Stable instances. Keep chart and host instances alive instead of rebuilding them, hide dense data labels, and coalesce events that arrive faster than you can show them.
There is no published points-per-second figure, so measure on the devices you ship to. The article on real-time graph performance explains what to measure, and performance guidance lists the update rules.
Limits
- No built-in MQTT, serial or OPC UA client; use an adapter as shown above.
- The ring buffer holds single values or X/Y samples. Multi-column live tables need a custom source.
- The web source polls; it does not hold a socket open. For push protocols, write an adapter.
The Chart Guru product page shows the rest of the package, and Chart Guru is available on the Unity Asset Store.
Frequently asked questions
Can I push samples from a background thread?
Yes. RingBufferChartDataSource.Push is thread-safe and constant time, so a network, serial or sensor thread can call it directly. The buffer publishes to its charts at most once per frame, in LateUpdate on the main thread, however many samples arrived since the last frame.
Does Chart Guru for Unity include MQTT, serial or OPC UA clients?
No. Its built-in network source polls HTTP or HTTPS endpoints that return CSV or JSON. For MQTT, serial ports or OPC UA, use the client library you already trust and forward its values into a ring buffer or a custom ChartDataSource.
How many points can a live chart handle?
No throughput benchmark is published. The Large Datasets lesson draws 35,136 points from one source, and stable updates are tested to allocate no managed memory after warm-up, but frame cost depends on chart type, visible labels and hardware. Measure on your target device; the real-time performance article explains what to measure.
Easy, reliable charts for Unity, from sparklines to multi-series 3D.
Keep reading
ArticleReal-time graphs in Unity without GC spikes
Texture redraws, per-point objects and per-frame allocations make live graphs stutter. How Chart Guru for Unity streams data through a thread-safe ring buffer and in-place updates, what its performance guidance recommends, and what a 35,136-point lesson shows.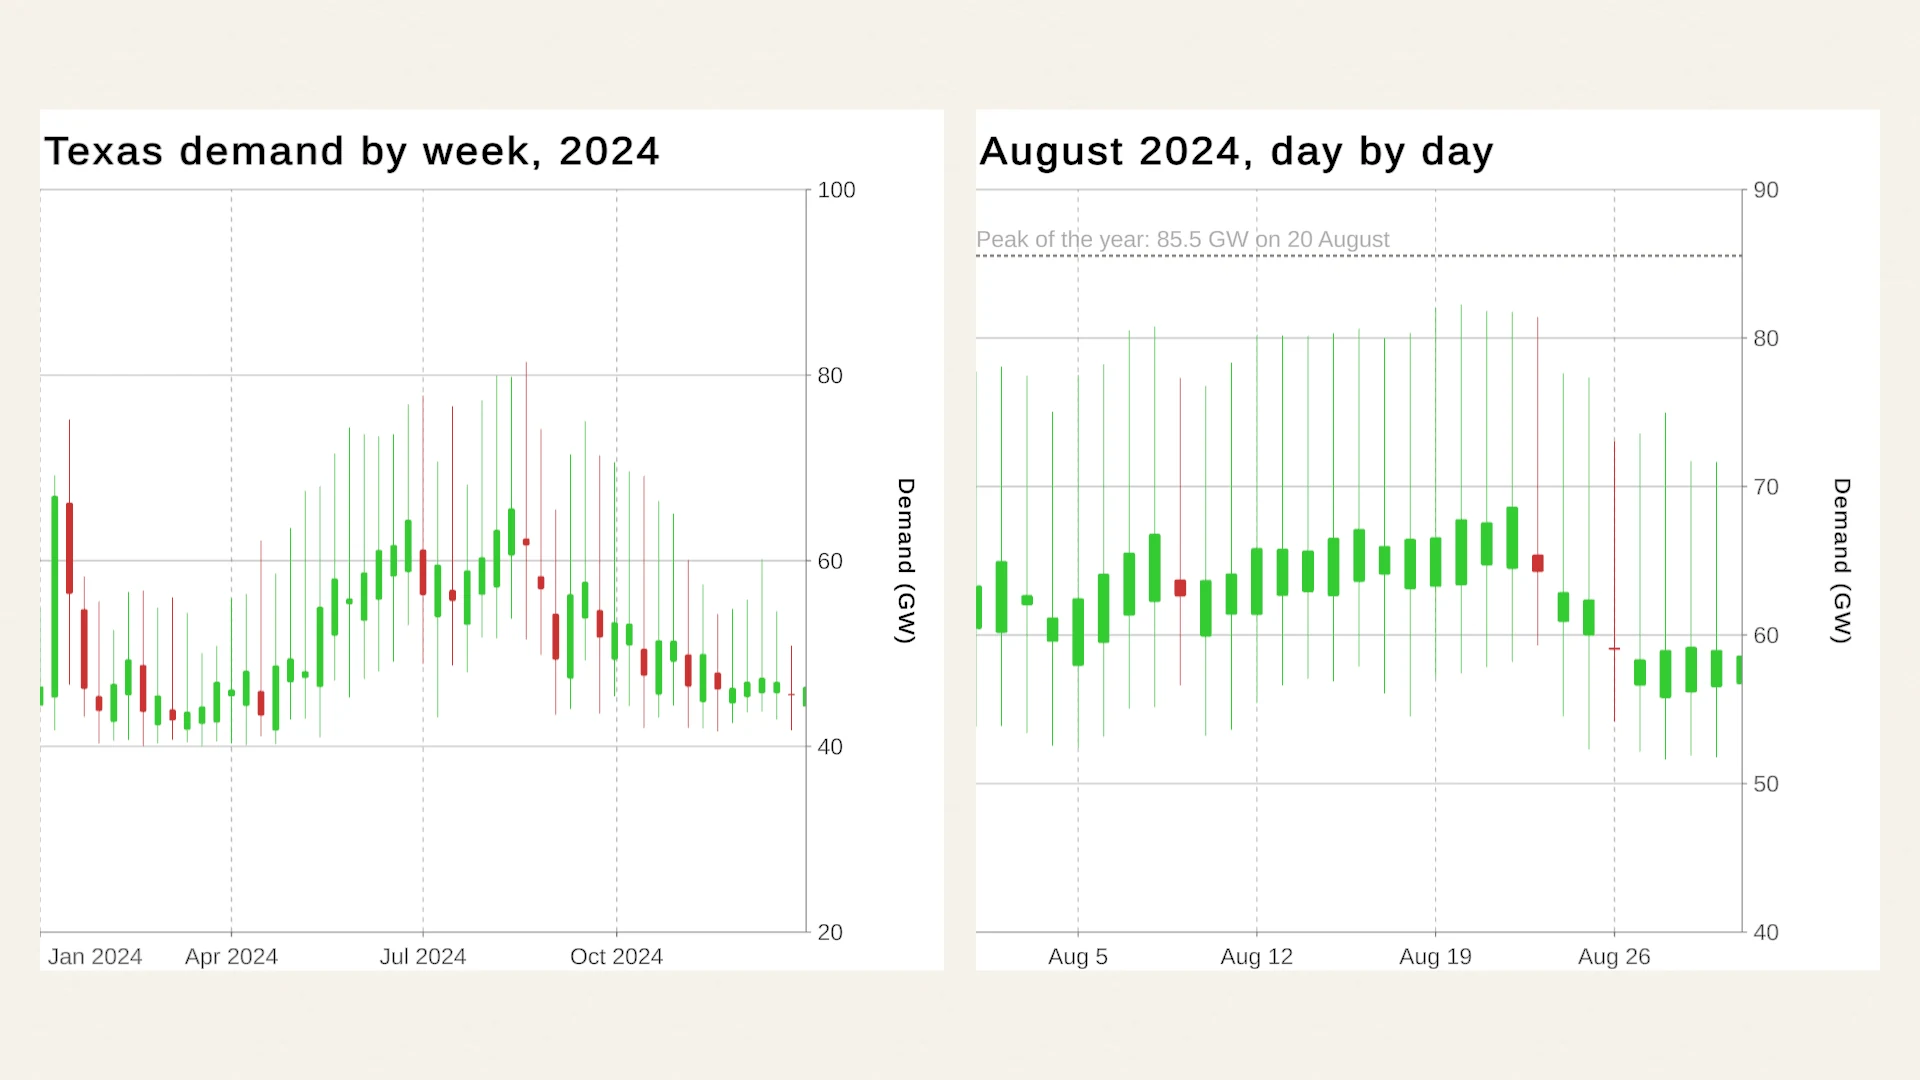 Use case
Live candlestick charts for trading games and finance apps
Chart Guru draws OHLC candlesticks in Unity from Yahoo Finance for prototypes, a licensed feed through the Web source, or mock streams that open at the previous close, with volume, waterfalls, scrolling, zoom and tooltips. Use case