Accessible charts in Unity
How to make Unity charts work for more people: colorblind-safe colormaps, chart descriptions, screen reader navigation on Unity 6, audio graphs and data export.
A chart is a picture of data, and for many people the picture alone is not enough. A player with low vision cannot read thin axis labels, a player with a color vision deficiency cannot tell a red series from a green one, and a screen reader has nothing to say about a texture full of colored pixels. Unity ships no chart control of its own, so whether your charts reach these people depends on the chart library you choose.
Chart Guru treats a chart as data with meaning, not only as pixels. The same chart can be seen, described in words, navigated with a screen reader on Unity 6, heard as an audio graph and exported as a table. This article goes through each of those layers and the API behind it.
Why chart accessibility matters in Unity
Charts in Unity are no longer limited to debug overlays. They show stats screens in games, progress in learning apps, sensor trends in digital twins and machine data on industrial HMIs. Each of these audiences includes people who read charts differently:
- Players and users with low vision need contrast, larger text and descriptions that do not depend on fine detail.
- People with color vision deficiencies need encodings that do not rely on hue alone.
- Screen reader users need a text alternative and a way to move through the data.
- Enterprise, education and public-sector teams often have to meet accessibility requirements for the software they ship, and charts are easy to overlook.
Apple’s Swift Charts supports per-mark accessibility labels, chart descriptors and Audio Graphs. Chart Guru follows the same model, so the accessibility rows of its Swift Charts parity inventory are covered, apart from SwiftUI’s alternate-view accessibilityRepresentation, which has no Unity counterpart.
Start with color that survives
The first rule costs nothing: never let color be the only thing that tells two series apart. Chart Guru gives you several second channels.
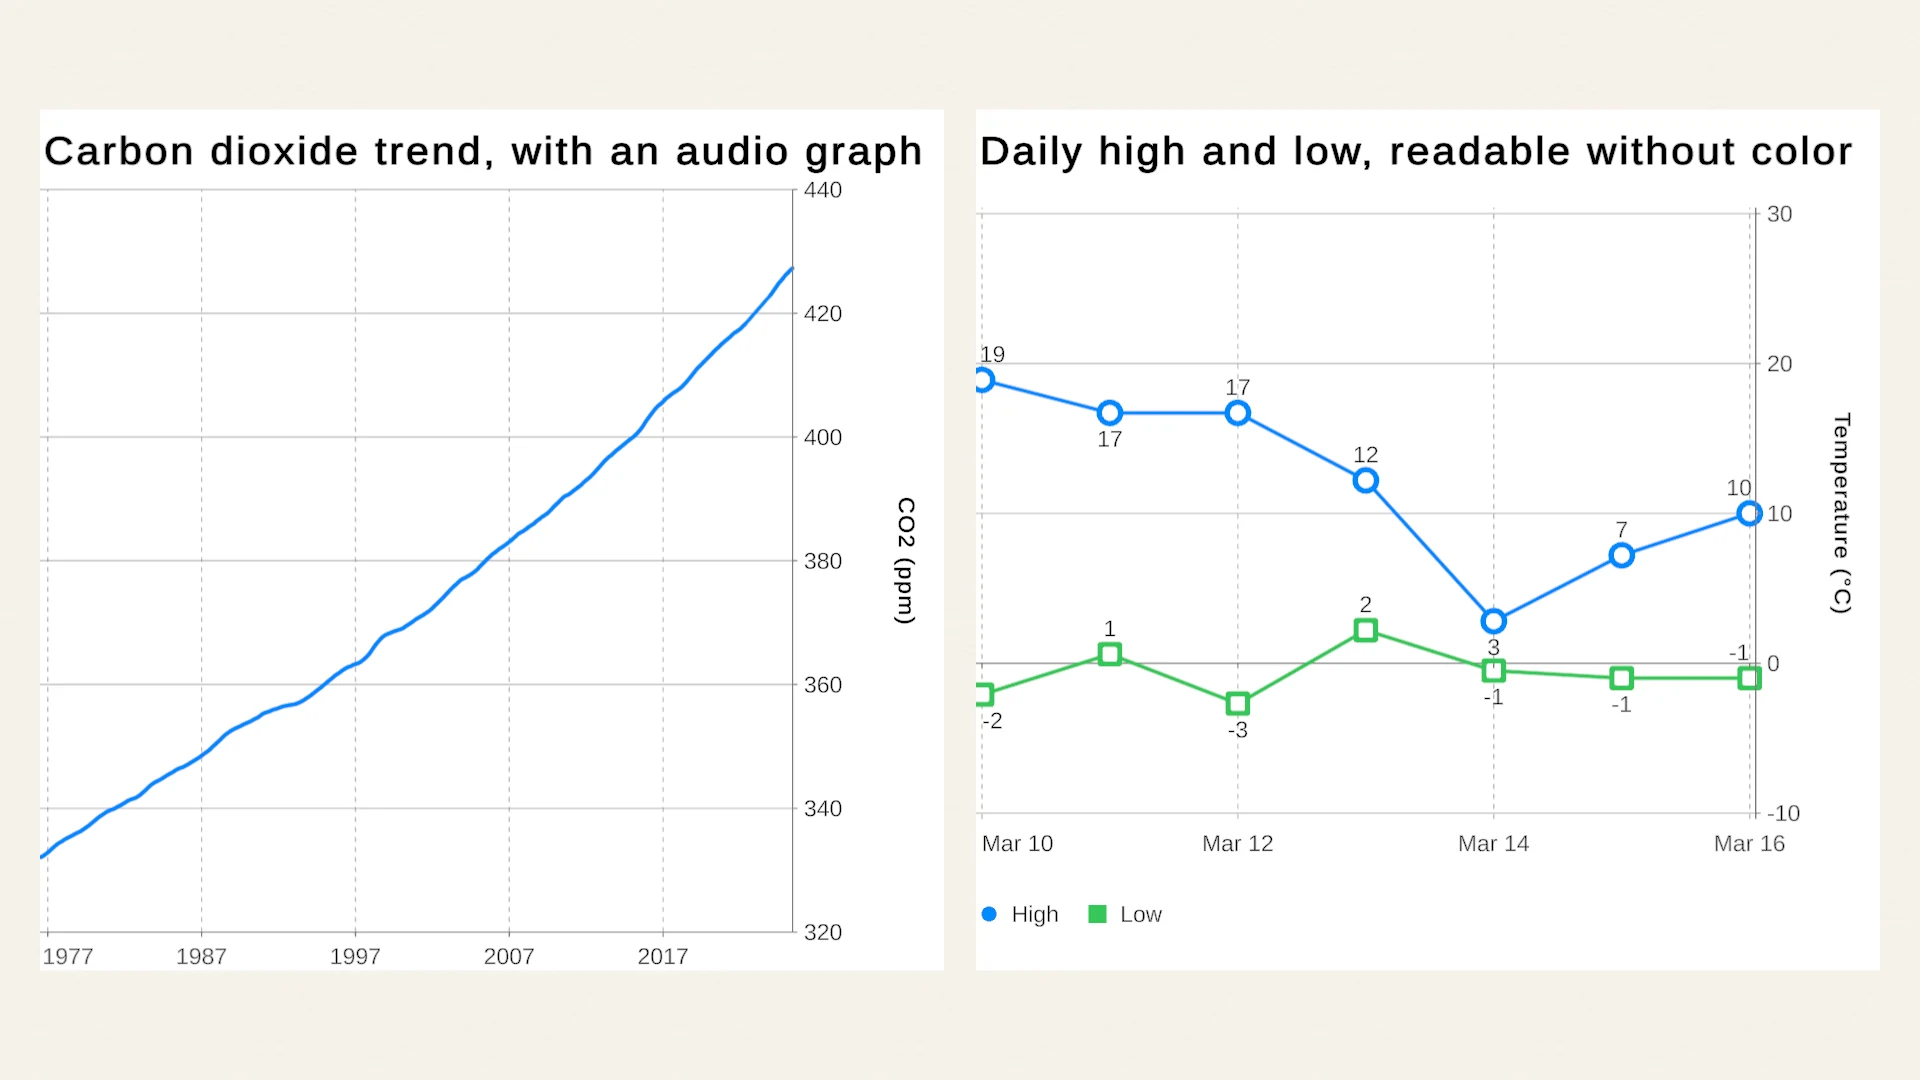
- Symbols. Bind the series column to the symbol channel as well as the color, so each series gets its own point shape. The Accessibility lesson does exactly this for daily highs and lows. Symbol encoding by value is rated Partial in the parity inventory because separate color and symbol legends are not fully represented yet, so check the legend in your layout.
- Line styles.
ChartLineStyleScalemaps series to dashed, dotted or solid strokes. - Direct labels. Data labels and annotations put the value or the series name right on the mark, which also helps everyone on a small screen.
For continuous values, such as heat maps and 3D surfaces, the colormap matters most. Chart Guru includes viridis, magma, plasma, inferno, cividis and turbo. The first five are perceptually uniform: equal steps in value read as equal steps in color, and they stay legible in grayscale and for common color vision deficiencies. Cividis, a blue to yellow map, is designed to look nearly the same with and without a color vision deficiency. Turbo is a vivid rainbow map, but its bright middle and steep hue changes are not perceptually uniform, so avoid it when values must be read from color.
float[,] values = demandByDayAndHour; // your own 2D arrayChart chart = Chart.Create() .HeatMap(values, ColorScale.Cividis(0f, 100f)) .Build();ColorScale.FromColormap with ChartColormap.Cividis does the same for any color scale, and 3D surfaces take a colormap for their height colors through the theme. Missing heat-map cells stay empty and are left out of the color domain, so a gap does not read as a low value.
Contrast comes from the theme. A ChartTheme asset holds the palette, typography, axes, grid, backgrounds and text scaling, and you can set axis label and title colors explicitly when a contrast requirement needs a deliberate choice. The High Contrast Presentation style in the online gallery is an ordinary theme built that way: a near-black background, white text, saturated series colors and larger title and legend text. It is not a shipped preset, but it shows how far one theme asset goes.
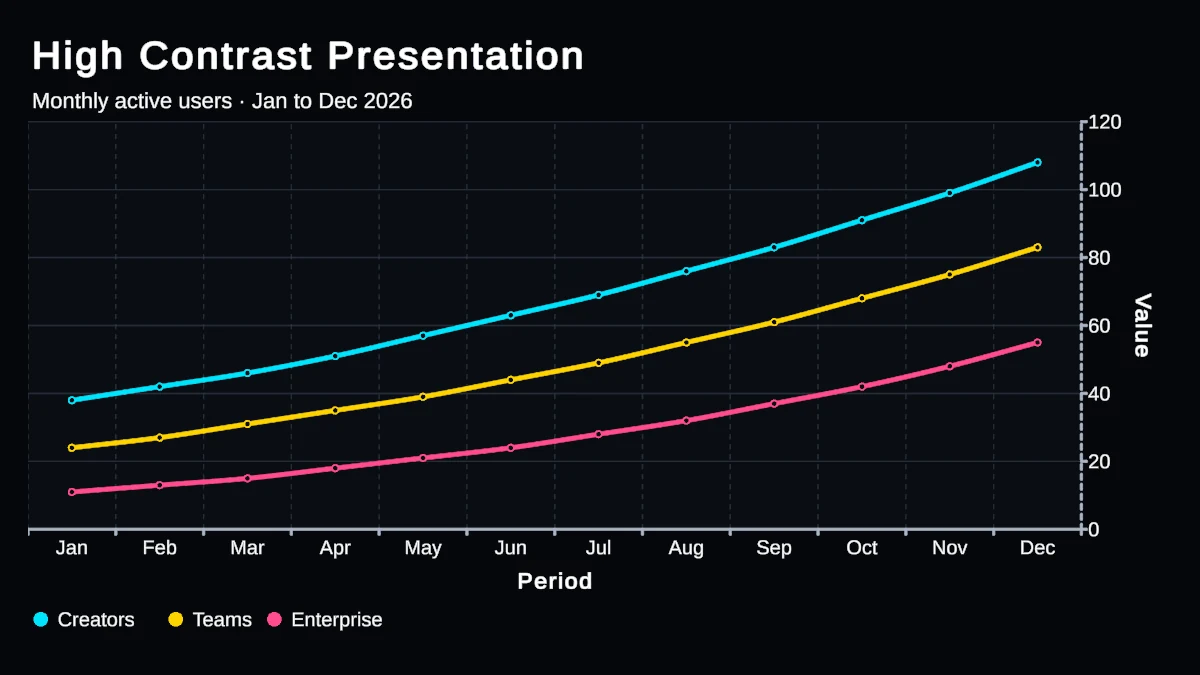
The gallery’s High Contrast Presentation style: one ChartTheme with strong accents and presentation-scale text.
Describe the chart in words
A description tells a screen reader user what a sighted user sees at a glance. Chart Guru has two levels.
The chart as a whole. ChartAccessibilityLabel sets the concise name announced for the chart, and ChartAccessibilityRepresentation sets a longer description of its data or purpose. If you set neither, GetAccessibilitySummary() generates a summary from the title, marks, series and axes, so even an unlabeled chart says something useful. A good description states the takeaway, not just the topic: the Accessibility lesson describes its chart as “Carbon dioxide at Mauna Loa, trend: rising from 332 ppm in 1976 to 427 ppm in 2025.”
Each mark. Visible marks receive synthesized accessibility semantics by default. AccessibilityLabel, AccessibilityValue and AccessibilityIdentifier override them, and AccessibilityHidden removes a decorative mark from assistive navigation without changing the picture. The identifier also gives linked selection a stable key when rows reorder.
Chart chart = Chart.Create() .ChartTitle("Carbon dioxide at Mauna Loa") .ChartAccessibilityLabel("Carbon dioxide at Mauna Loa") .ChartAccessibilityRepresentation("The trend rises from 332 ppm in 1976 to 427 ppm in 2025.") .Add(new LineMark(PlottableValue.Value("Year", 1976f), PlottableValue.Value("CO2 (ppm)", 332f)) .AccessibilityValue("332 parts per million")) .Add(new LineMark(PlottableValue.Value("Year", 2025f), PlottableValue.Value("CO2 (ppm)", 427f)) .AccessibilityValue("427 parts per million")) .Build();For your own accessible UI, GetAccessibilityDescriptor() returns a platform-neutral model of the chart: title, summary, the X, Y and optional Z axes, the series, and every visible point with its label, value, category and coordinates. Numeric, categorical, temporal and radial axes are all described. You can feed it into a data table view or your own narration. Hiding an axis title visually with Show Title keeps the axis name for tooltips and accessibility.
Let screen readers navigate the chart
On Unity 6, ChartAccessibilityHierarchyBridge adds a chart to Unity’s native accessibility hierarchy, the tree a screen reader moves through. The chart becomes a node with one child node per accessible mark, or per distinct X value when the chart selects whole X positions. The nodes stay in place across value and selection changes, and activating a node selects its mark, so screen reader users can explore the same data as pointer users.
The bridge is careful with the rest of your app. It never activates itself, and Activate() does not replace another active hierarchy unless you ask it to. If your app already has a hierarchy, pass it to the bridge instead. You supply the chart and mark frames in screen coordinates, call RefreshFrames() after layout, and dispose the bridge when the host goes away:
#if UNITY_6000_0_OR_NEWERpublic static ChartAccessibilityHierarchyBridge Activate( Chart chart, Func<Rect> chartScreenFrame, Func<int, Rect> markScreenFrame){ var bridge = new ChartAccessibilityHierarchyBridge( chart, chartFrameGetter: chartScreenFrame, markFrameGetter: markScreenFrame); if (bridge.Activate()) return bridge; bridge.Dispose(); return null;}#endifThe bridge needs Unity 6. On Unity 2022.3, the oldest version Chart Guru supports, descriptions, summaries, descriptors, audio graphs and export all work; only the native hierarchy is missing.
Hear the chart with an audio graph
Swift Charts offers Audio Graphs, which let people listen to a chart. Chart Guru brings the same idea to Unity with ChartAudioGraph: each visible mark becomes a note, so rising values rise in pitch and a trend becomes a melody. By default the sweep takes three seconds and spans 220 Hz to 880 Hz, two octaves.
SonificationOptions sets the pitch range, total duration, note length, volume, sample rate and waveform (sine, triangle or square). The generated audio uses click-free envelopes, FillNotes reuses a note buffer, and playback goes through an AudioSource you own. This is the pattern the Accessibility lesson uses when you click its chart:
ChartAudioGraph audioGraph = new ChartAudioGraph { AudioSource = audioSource };audioGraph.Play(host.Chart);
// When the owner is disabled:audioGraph.Dispose();
Sonify(chart) returns the notes if you want to play them your own way, CreateAudioClip(chart) renders a PCM clip, and DescribeTrend(points) writes a short, objective trend summary to go with the sound. The graph owns the clip it generates, so release it with ReleaseGeneratedClip() or Dispose(). Treat audio as a supplement: keep the text, units and navigation available beside it.
Export the data behind the picture
Some people simply prefer a table. ChartDataExporter.ToCsv(chart) and ToJson(chart) export what the chart shows, and WriteCsv and WriteJson write it to a file. The export is deterministic and culture-invariant, and it is semantic: it includes mark types, series, categories, raw ranges, optional Z values and the accessibility labels and values, not just raw numbers. A user can open the CSV in a spreadsheet or screen reader-friendly viewer, and an auditor can check that the chart matches its source.
For reports, ChartGraphic.EncodeOutputPng(includeText) and SaveOutputPng(path, includeText) export a Canvas chart as PNG including its exact labels, titles and legends. Because the image is read back from the GPU, run it on an explicit action rather than every frame. The Exporting Charts lesson shows PNG, CSV and JSON export from one button.
Try it in the Accessibility lesson
The package’s Accessibility lesson, under Examples/02_DataAndInteraction, puts these pieces together on real data:
- Carbon dioxide trend, with an audio graph. NOAA’s Mauna Loa record from 1976 to 2025, with the spoken description quoted above. Enter Play Mode and click the trend to hear it. The small
Chart Sonificationcomponent behind it sets the accessibility label and plays the audio graph on click or tap, and its code is short enough to copy. - Daily high and low, readable without color. A week of Denver temperatures from March 2024, where the two series differ by symbol as well as color.
The 27 lessons article describes the other lessons and their datasets, and the Interaction, Animation, and Live Updates chapter of the manual covers the accessibility API in more depth.
A short checklist
- Give every chart a title and an accessibility label or representation that states the takeaway.
- Put units in mark values: “332 parts per million” reads better than “332”.
- Never encode meaning with color alone; add symbols, line styles or direct labels.
- Use cividis or another perceptually uniform colormap for continuous values, and avoid turbo when values must be read from color.
- Check contrast in your theme and set label colors explicitly where needed.
- On Unity 6, connect the hierarchy bridge to your app’s accessibility hierarchy.
- Offer the audio graph on demand, next to text, and a CSV or JSON export for people who prefer tables.
Chart Guru is available on the Unity Asset Store. Descriptions, descriptors, audio graphs and data export work on the chart model itself, so they apply to Canvas and UI Toolkit charts alike; PNG export is a Canvas feature.
Easy, reliable charts for Unity, from sparklines to multi-series 3D.
Keep reading
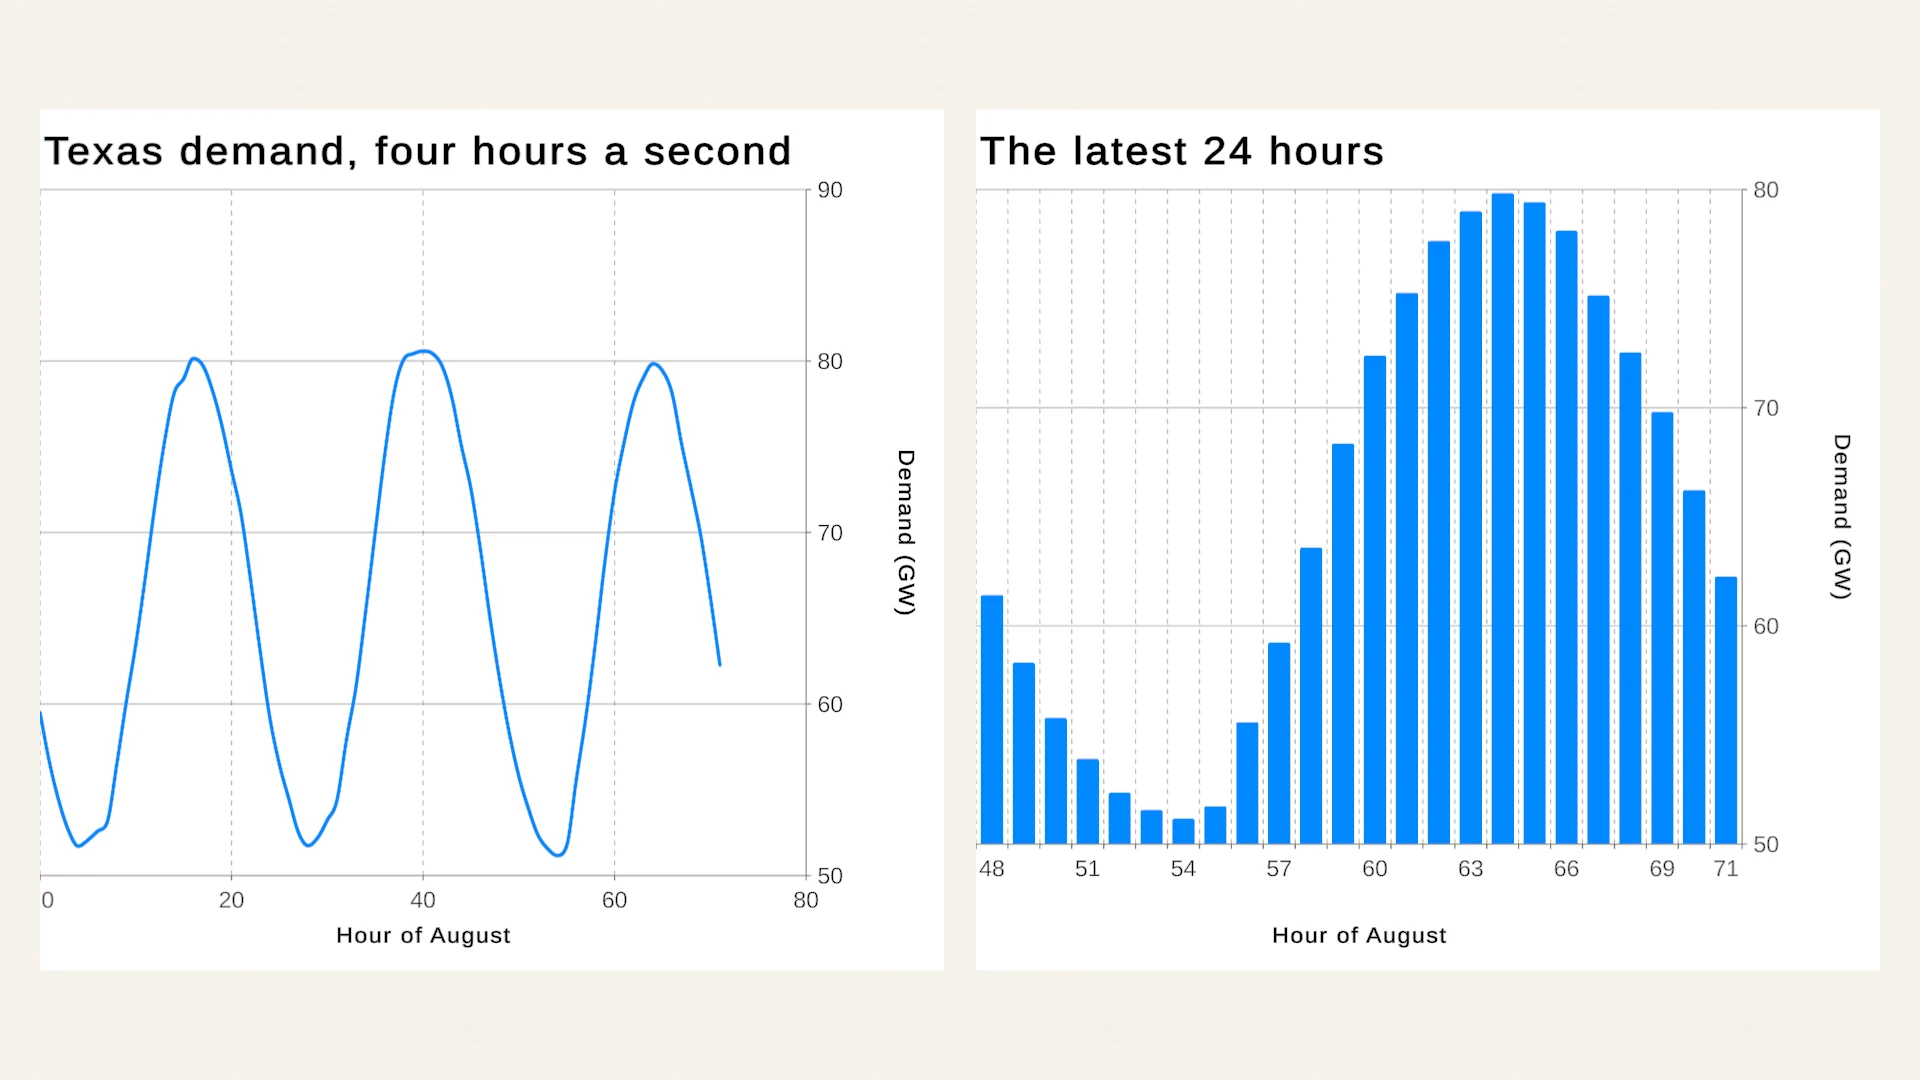 Article
Learn Unity charts with real data: the 27 lessons
How the Chart Guru examples teach charts in Unity: tracks from a showcase to production apps, credited public datasets with their licenses, and why real data exposes layout problems that tidy demo numbers hide. Use case
Charts in UI Toolkit and UI Builder
Unity ships no chart control for UI Toolkit, only a Painter2D pie chart tutorial. Chart Guru adds ChartGuruElement for UXML, UI Builder, runtime panels and editor windows, with data binding, tooltips and live updates.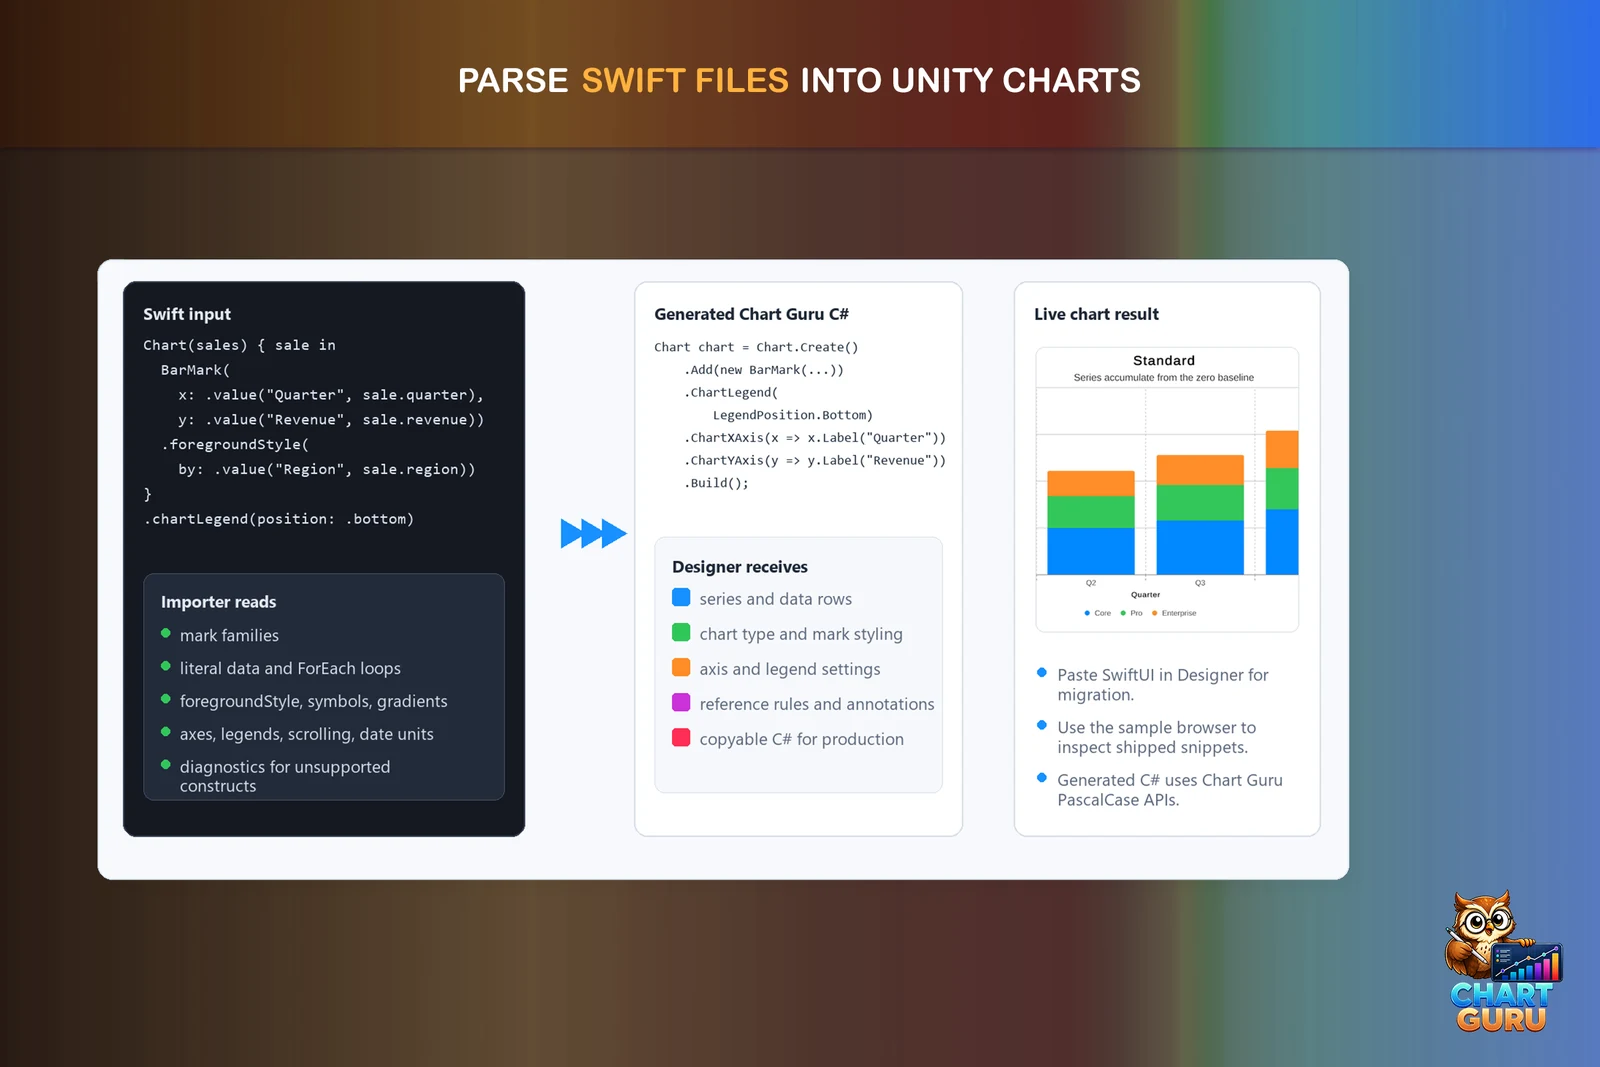 Article