Interaction, Animation, and Live Updates
Selection and gestures
ChartGraphic implements pointer, hover, drag, and scroll interfaces. The Chart model exposes selected point, selected X or Y value, selected angle, selected ranges, hovered index, and selection indicator styles such as Highlight, Lollipop, and RuleMark.
- Use point selection for dashboards and drilldown.
- Use range selection for time windows and brushing.
- Use angle selection for pie and donut slices.
- Use scrollable axes and visible domains when only part of a large data set should be visible.
Animation and morphing
Animations can run on initial display, value changes, explicit replays, and morph transitions. Use Animation.Default, Linear, EaseIn, EaseOut, EaseInOut, Spring, SpringResponse, Bouncy, Smooth, Snappy, InterpolatingSpring, TimingCurve, or FromEasing, then add Delay, Speed, RepeatCount, or RepeatForever modifiers as needed. Morphing transitions between chart types at runtime and can use CrossFade, Scale, or Semantic styles. Semantic morphing is supported for Bar, MiniBar, Line, Sparkline, Area, Point, Bubble, Scatter, Pie, Donut, MiniPie, MiniDonut, and HeatMap. If either side of a requested semantic morph is outside that set, Chart Guru automatically resolves the transition to Scale so the morph remains visible.
chart.MorphTo(ChartType.Line, new MorphOptions
{
    Animation = Animation.EaseInOut(0.6f),
    Style = ChartMorphStyle.Semantic
});
chart.SetValues(newValues);      // fastest Y-only update when shape is unchanged
chart.SetData(newMarks);         // full replace when mark shape changes
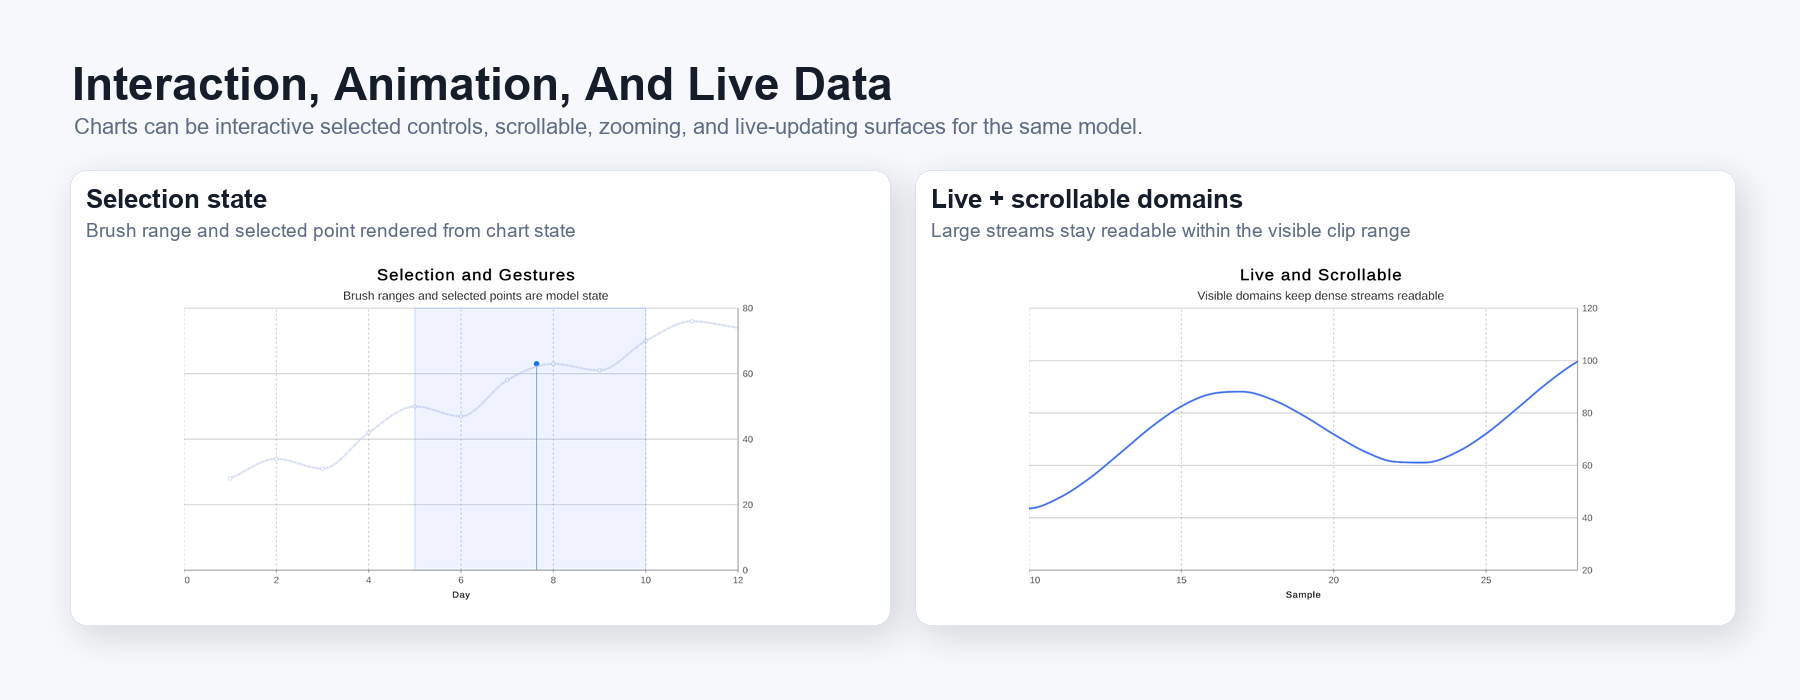
Figure 5. Interaction and live data: selection ranges, selected points, visible domains, scrolling, zooming, and streaming updates share the same chart model.