Learn Unity charts with real data: the 27 lessons
The 27 Chart Guru lessons for Unity use real public data, from Mauna Loa carbon dioxide and Texas grid demand to Palmer penguins, plus three production examples.
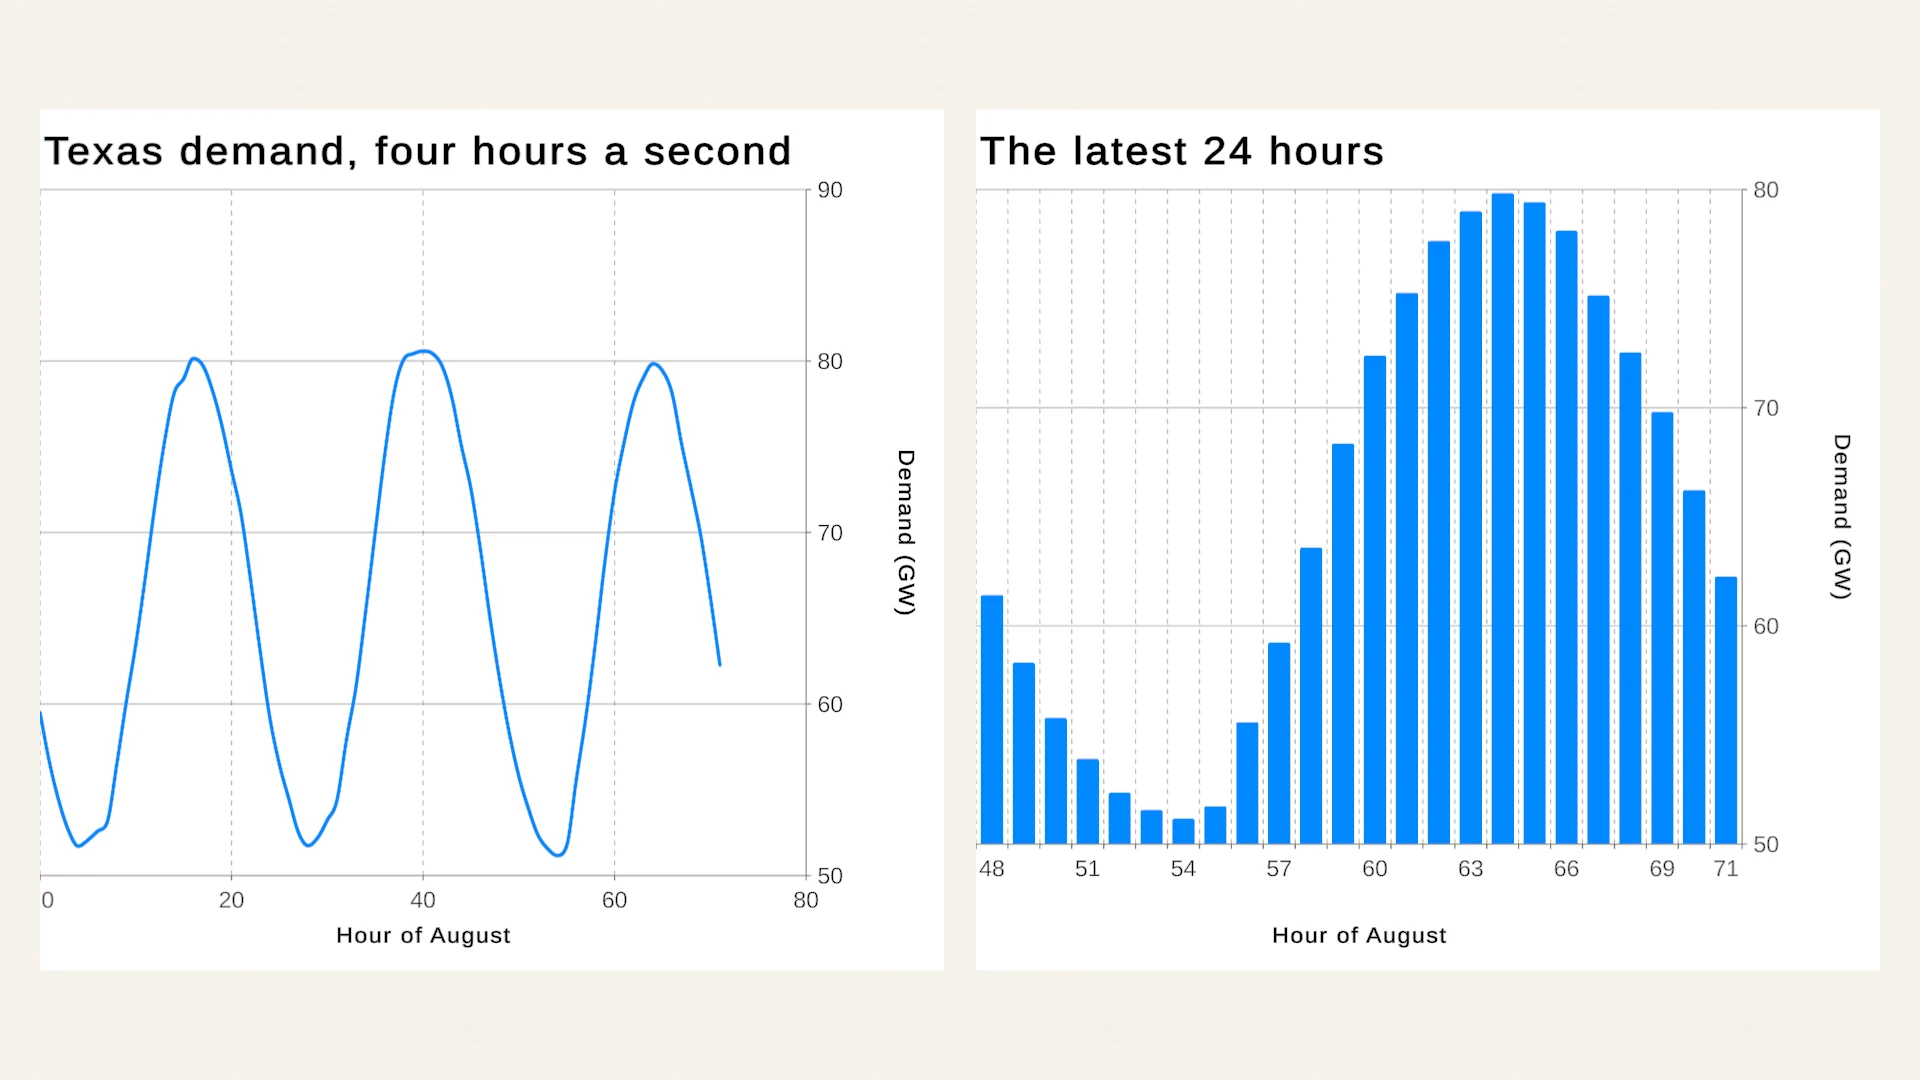
Most chart demos run on invented numbers: five tidy bars, a smooth sine wave, sales that grow a little every month. The examples in Chart Guru use real public records instead: carbon dioxide measured at Mauna Loa, a March week in Denver that turned from spring warmth to a snowstorm, a year of electricity demand on the Texas grid, 342 Antarctic penguins, one chess game and a month of a Fitbit wearer’s days. This article explains how the lessons are organized, where the data comes from, and how to learn the most from them.
Why real data makes better lessons
Tidy demo data flatters a chart. Real records show what your own data will do to it, which is why they are the better teacher:
- Gaps. NOAA’s Mauna Loa record has no values from December 2022 to June 2023, when the eruption of Mauna Loa cut the observatory’s power. Those months stay empty instead of being filled with guesses, and the chart has to show a gap honestly.
- Missing readings. In the Denver week, the hour of 14 March 14:00 had no routine report, and calm or variable winds have no direction. Among the penguins, nine birds have no recorded sex.
- Real units and ranges. Gigawatts, parts per million, degrees Celsius, grams and seconds on the clock each need their own axis format and domain.
- Time quirks. The Denver hours are local standard time without an offset: the record ignores the switch to daylight time on 10 March.
- Length. 744 hourly values, 600 monthly values or 1,961 daylight rows test label spacing, scrolling and performance in ways five bars never do.
- Events. A snowstorm week, the record day of a month of grid demand and a blunder at move 20 of a chess game are exactly the moments a chart must make visible.
Chart Guru’s data handling is built for these cases. CSV and file sources turn placeholders such as N/A, null or - into empty cells, heat maps keep missing values as empty cells, and dates without a time zone are read as UTC. When you need synthetic stress tests on top, the bundled Mock Magic generates and streams test data.
The tracks at a glance
The examples live in numbered folders that go from a first look to finished applications:
| Track | Lessons | What you learn |
|---|---|---|
00_Entry | Chart Guru Showcase | One week of weather at Denver International Airport as a field notebook |
01_ChartTypes | Bars and Histograms; Lines and Areas; Points, Bubbles and Trend Lines; Pies, Donuts and Radar; Candlesticks; Heatmaps; Compact Charts; Composed and Function Plots | Each 2D chart family, mostly on public records |
02_DataAndInteraction | Data Sources; Live Data; Large Datasets; Data Frames and Facets; Time Axes and Date Bins; Selection and Tooltips; Scrolling and Paging; Accessibility | Getting data in, keeping it live, and letting people explore it |
03_StyleAndMotion | Axes and Scales; Annotations; Themes; Gradients and Mark Effects; Animation and Morphs | Making charts readable, branded and animated |
04_Workflows | Charts from Code; Swift Import; Exporting Charts; UI Toolkit Charts; UI Toolkit Data Binding; plus the Swift Selection example | Code, Swift import, export and UI Toolkit |
05_ProductionExamples | Match Summary; Phone Health App; Data Explorer | Small applications that combine charts, data and interface |
A separate Guides/Inspector Charts folder shows a chart drawn inside a custom inspector, for tool builders.
The chart titles tell you what each lesson is about, because they describe the data rather than the feature: “Body mass in 250 g bins”, “Texas demand, four hours a second”, “Carbon dioxide, ten years in view”, “Excess over 280 ppm, logarithmic” or “Fifty annual means, drawn in”. The Chart Types track also feeds the catalog of chart types, which explains when to use each family.
Lessons to open first
These lessons show the most in a few minutes of Play Mode:
- Live Data replays August 2024’s hourly Texas demand into ring buffer sources at four recorded hours per second. Each source keeps only its latest samples, so the charts scroll while the hosts update their marks in place. The real-time graphs use case builds on the same approach.
- Large Datasets draws “A year of tides, every 15 minutes”: 35,136 points beside a view of three days at a time. The tides are computed the way tide tables are made, as the sum of eight harmonic constituents with amplitudes typical of a mixed semidiurnal coast, so the lesson needs no download. They are a model, not measurements.
- Selection and Tooltips links two daily charts: select a day in one and it is selected in the other. Hover any chart in the examples to read its values.
- Scrolling and Paging lets you drag the Texas daily peaks sideways; they settle one page of thirty days at a time.
- Animation and Morphs: click the penguin chart to morph it into another chart type, and the carbon dioxide chart to replay its entrance.
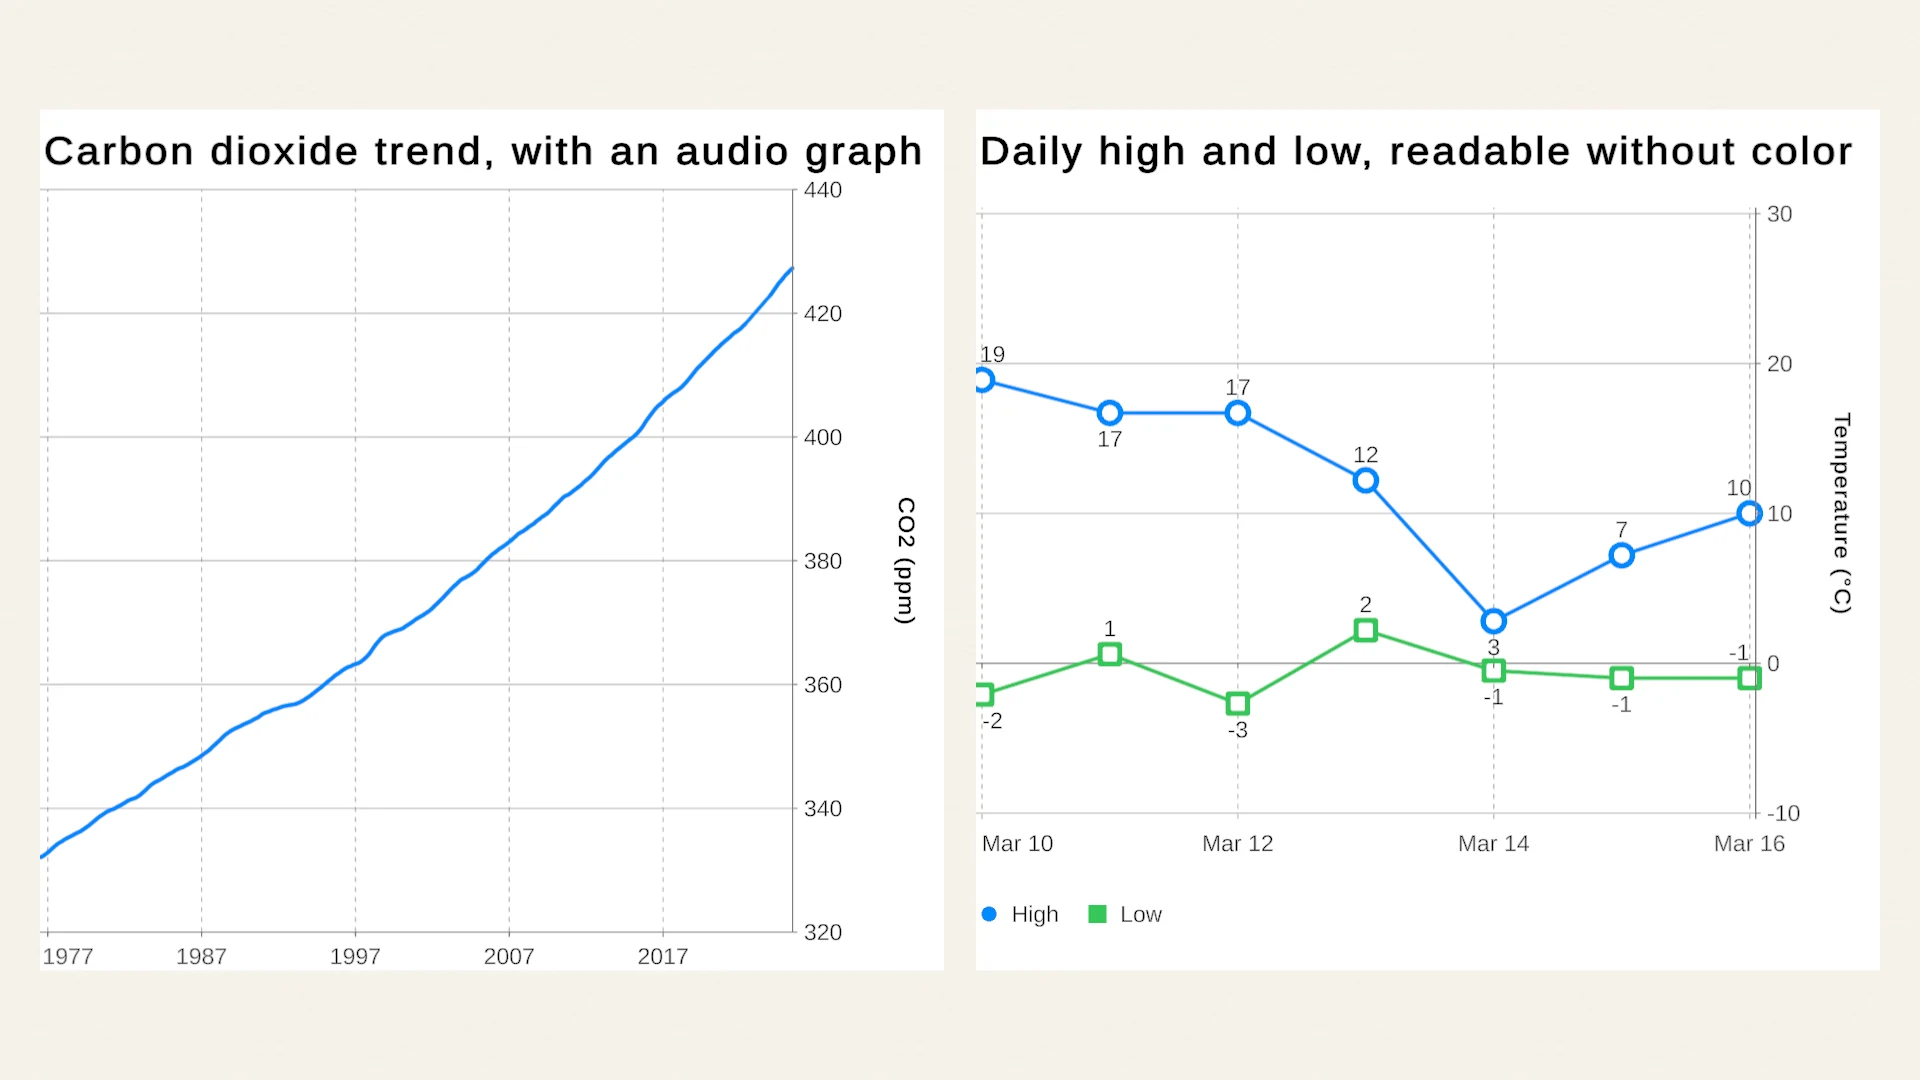
- Accessibility: click the carbon dioxide trend to hear it as an audio graph. The accessible charts article explains the API behind it.
- Data Sources reads offline snapshots by default. Enable the disabled NOAA web source to replace the offline table with NOAA’s live Mauna Loa record.
- Exporting Charts writes each chart as PNG, CSV and JSON to
Application.persistentDataPath/Chart Guru Exportswith one button.
The production examples
Track 05 contains three small applications. Each sits in its own folder with its scripts, so you can read one end to end.
Match Summary
The end-of-match screen of a rated 8 minute rapid game on Lichess, a King’s Indian Defense played on 6 October 2026, which White won in 77 moves after both sides blundered at move 20. It shows the advantage after each move, the seconds spent on each move and a radar of each player’s accuracy by piece. Hover a move on the advantage graph to light up the seconds spent on it, or hover a bar of the move times to find that move on the graph. It is a good model for game stats screens where two charts tell one story.
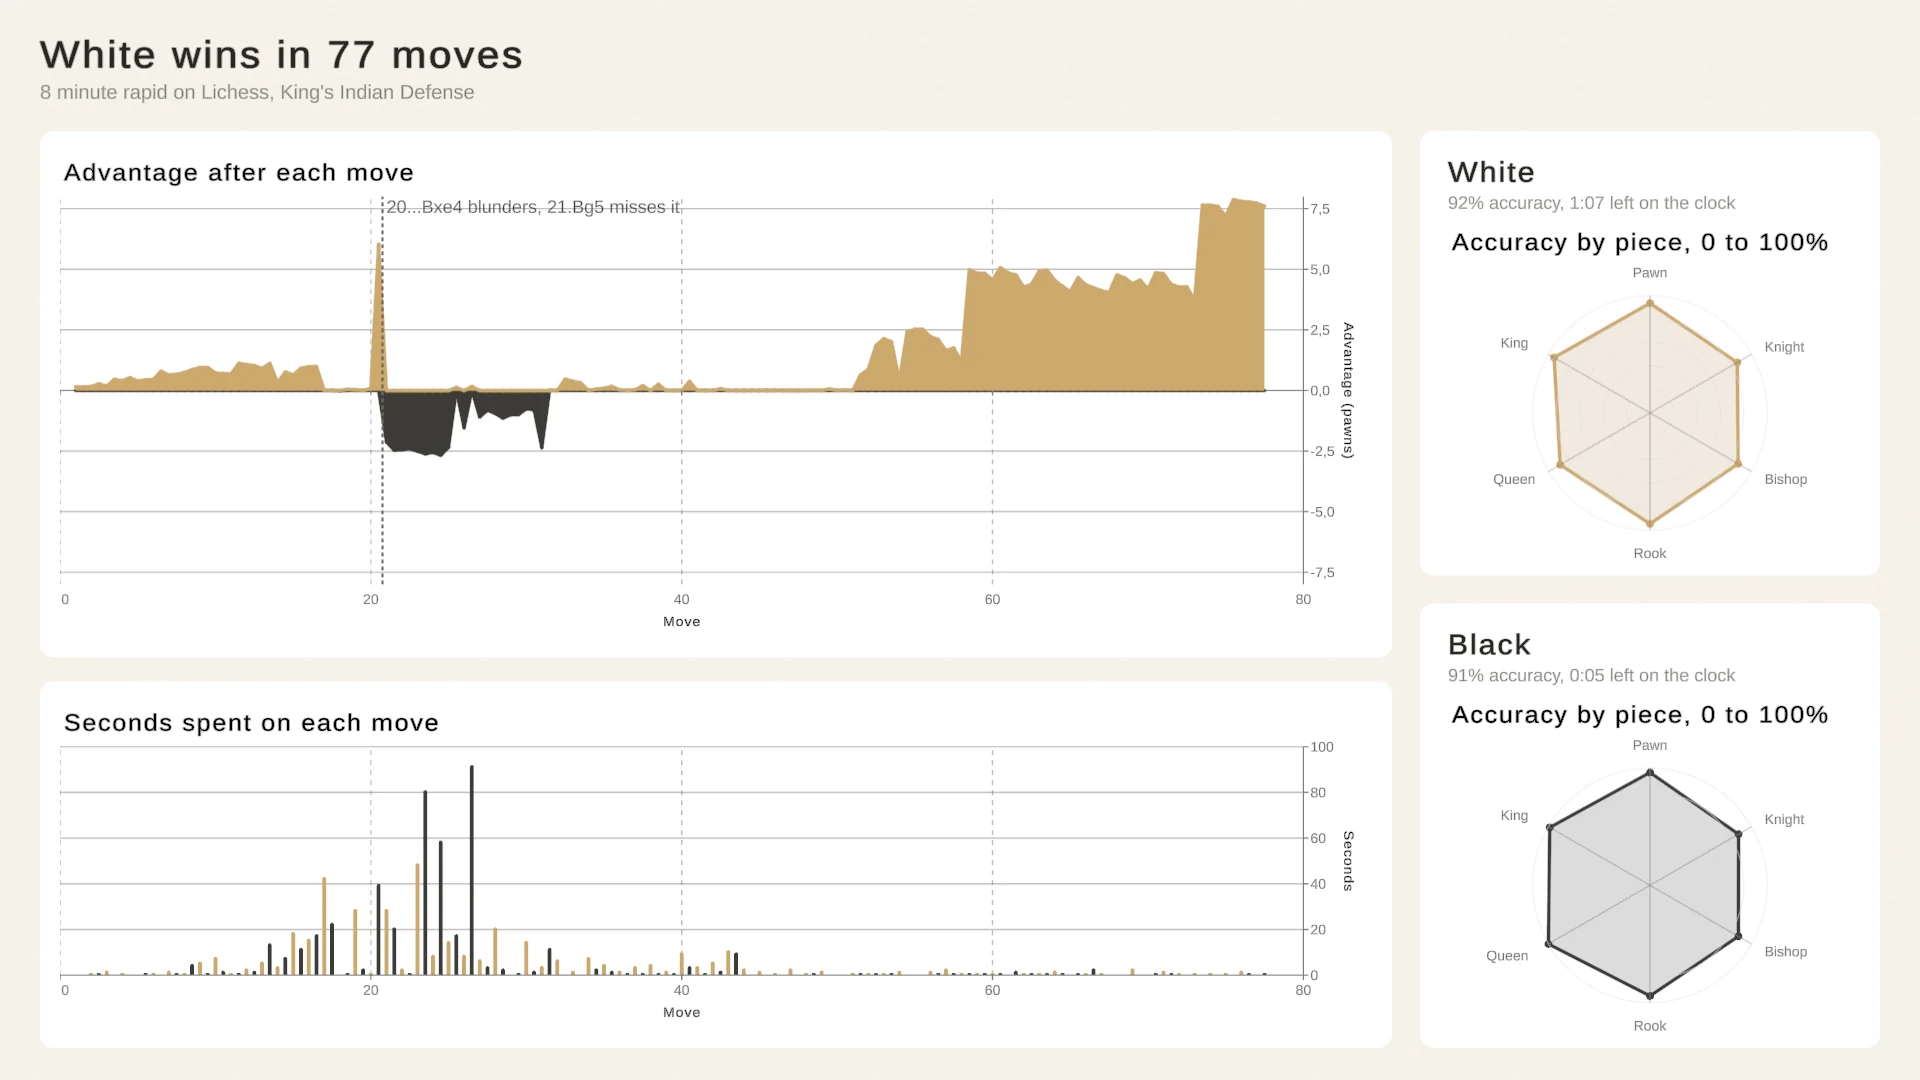
Linked charts on an end-of-match screen, from a real game record.
Phone Health App
A portrait UI Toolkit app over one LifeSnaps participant’s July 2021 on a Fitbit Sense. Rings show progress toward the day’s step, active minute and active hour goals, the week’s steps pick the day when you tap a bar, the night’s sleep stages appear as a timeline and the day’s heart rate as a range band with its average. The arrows step between weeks. Play it in a portrait Game view, such as 1080x1920.
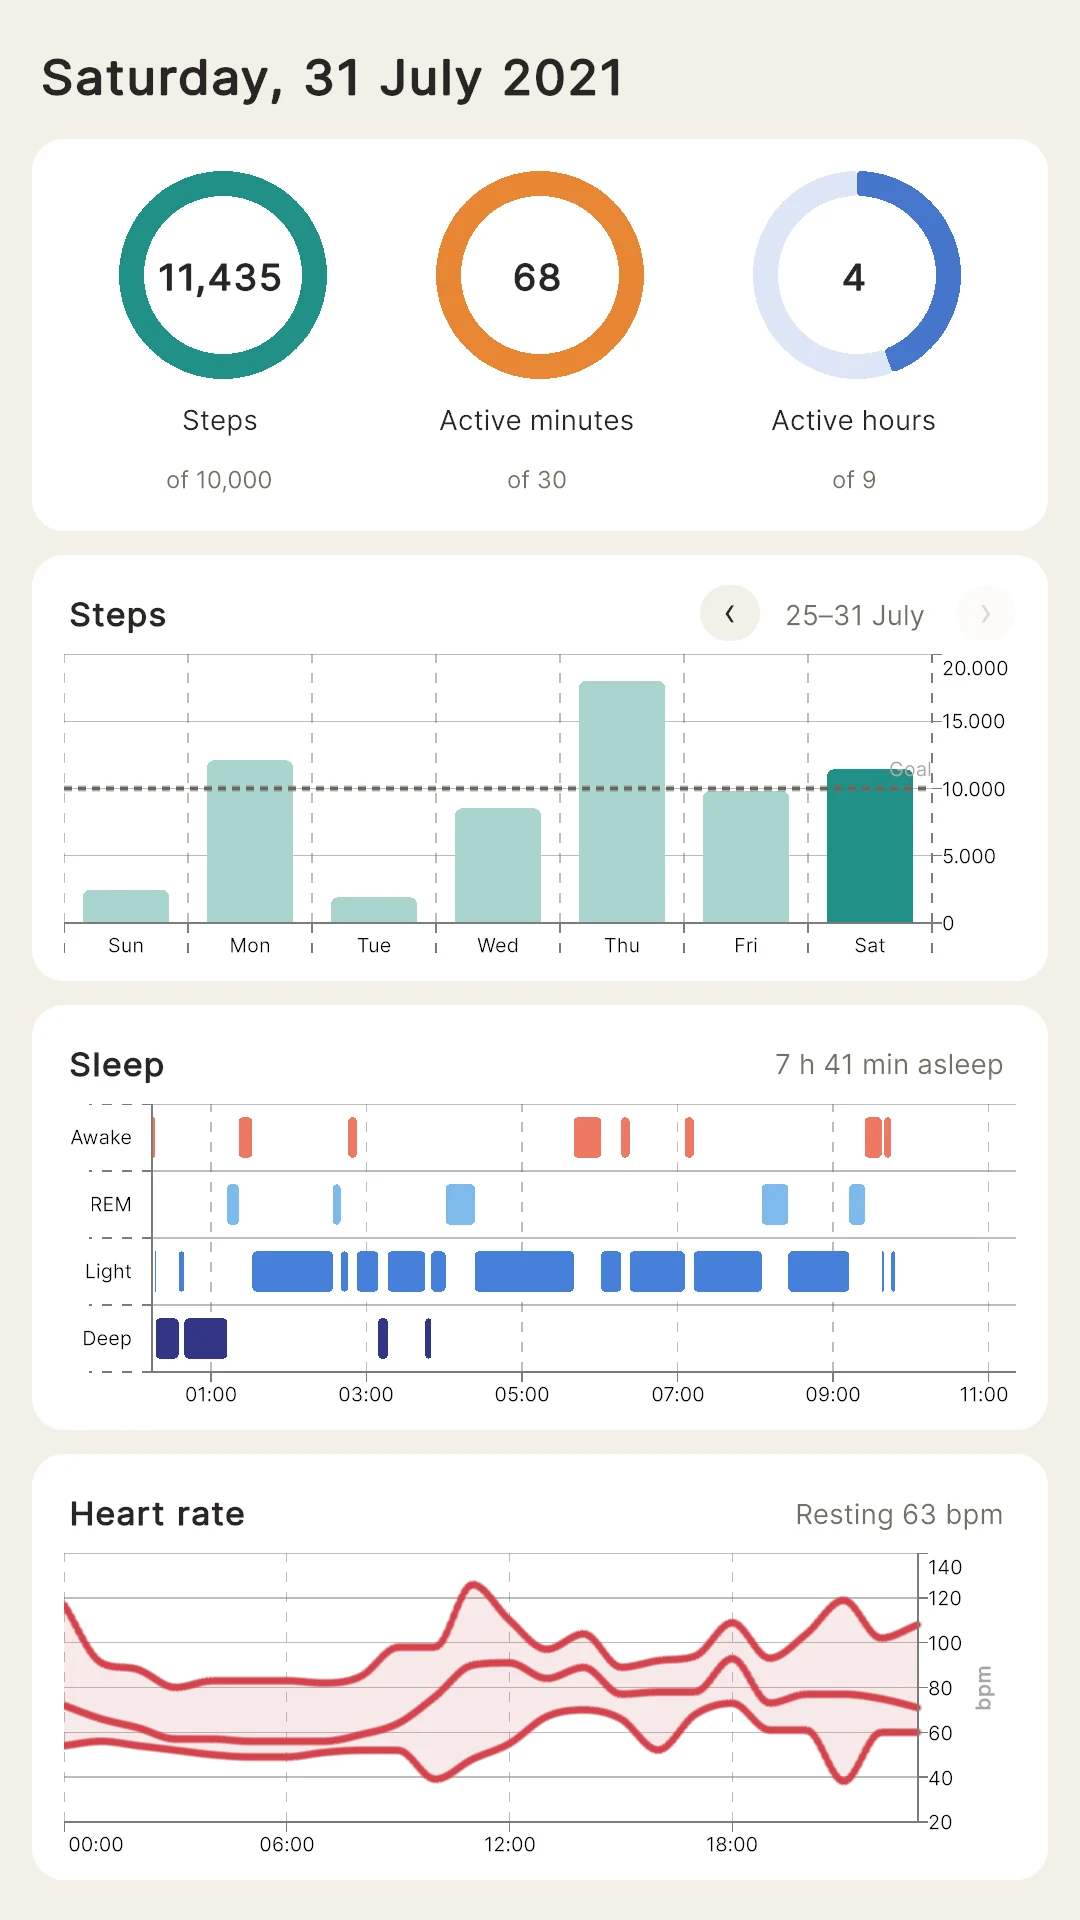
A phone-sized UI Toolkit screen, built from ordinary chart elements.
Data Explorer
A small tool for one CSV file. A CSV Chart Data Source loads penguins.csv; you pick a measurement, switch species off and on, split the birds by island or year, choose bars, lines or areas, and save the charts as PNG or CSV. The explorer gives each facet value its own chart, counts the chosen measurement in bins that every chart shares, and morphs the charts when you change their type. It is a compact template for internal analysis tools.
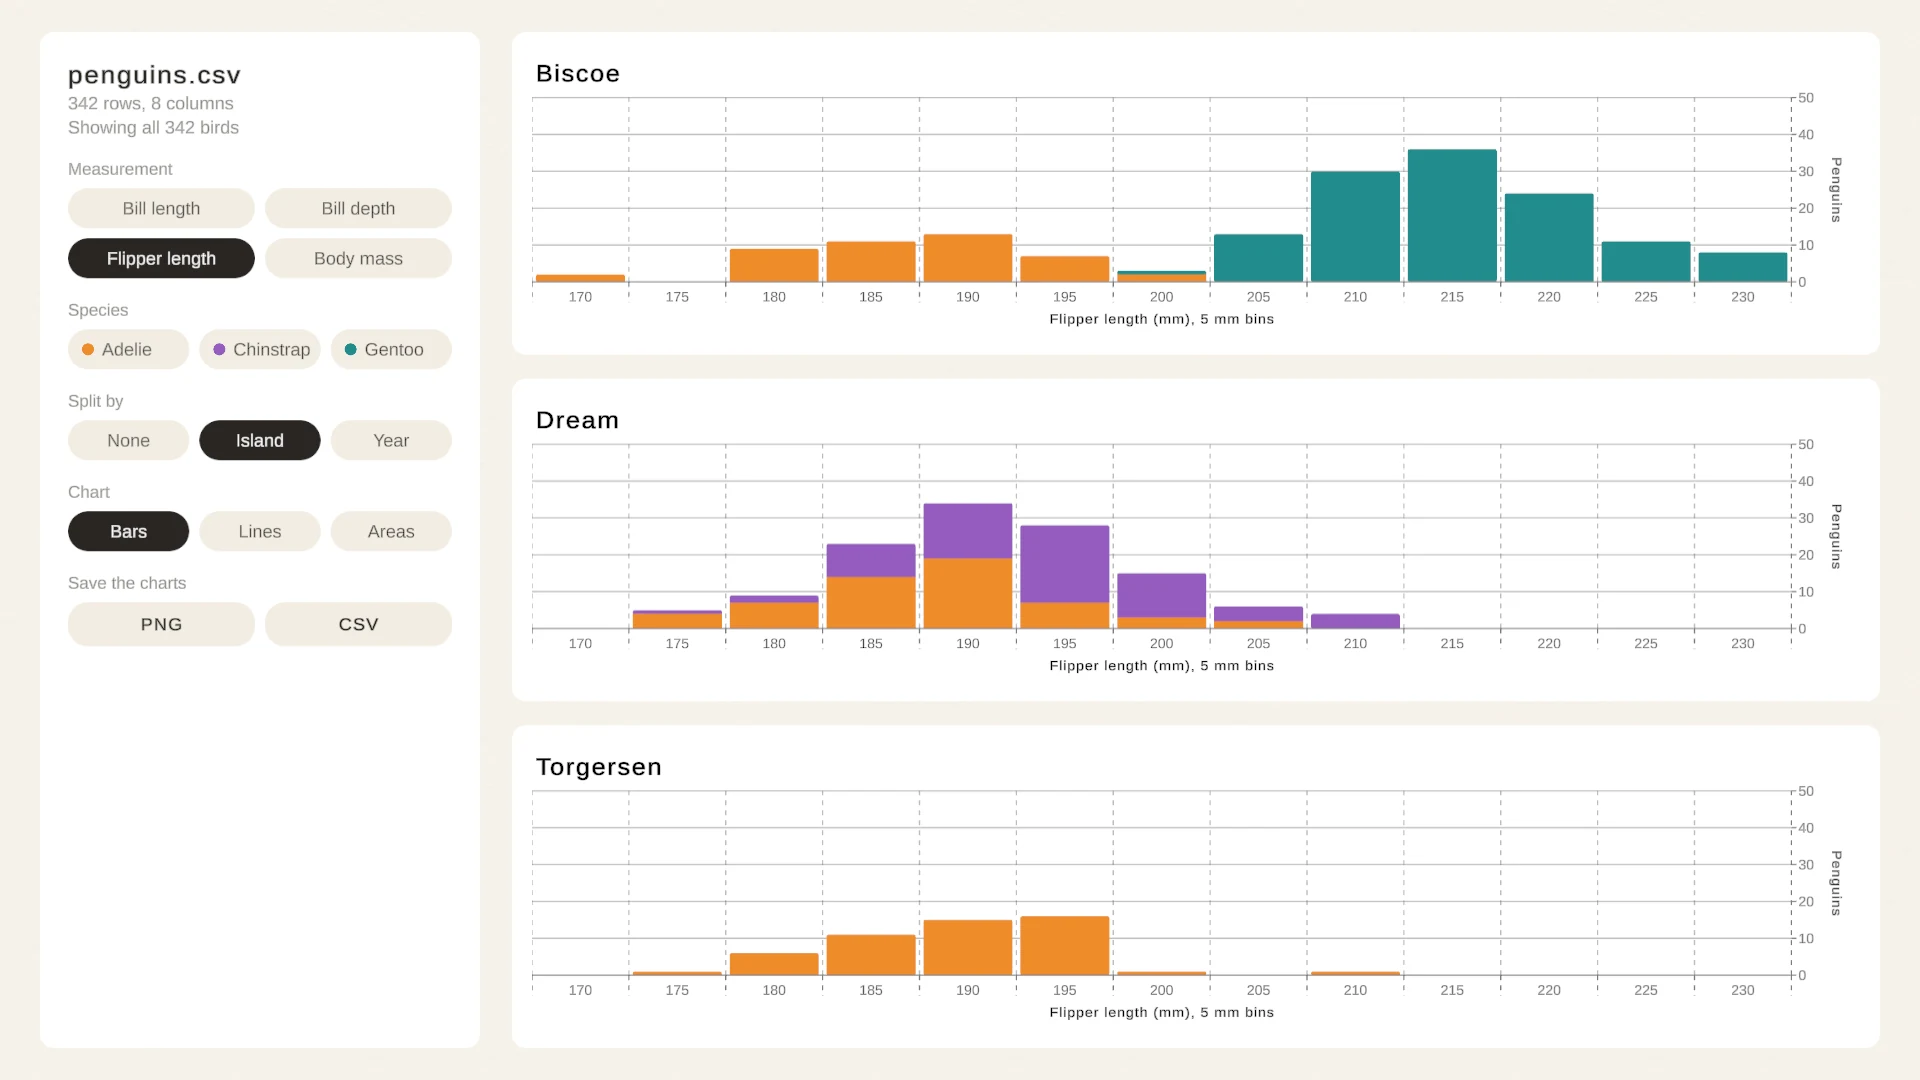
Filters, facets, chart morphs and export over one CSV file.
The datasets and their sources
Each dataset is a small, fixed slice of a public source, or is computed for Chart Guru where noted. The package’s Shared/Data/README.md lists the source, license, retrieval date and every edit for each asset.
| Dataset | Contents | Source | License |
|---|---|---|---|
| Mauna Loa CO2 | Monthly mean carbon dioxide in ppm with a centered 12 month trend, January 1976 to December 2025: 600 months | NOAA Global Monitoring Laboratory, continuous measurements at Mauna Loa, doi:10.15138/yaf1-bk21 | CC0 1.0 |
| Denver Weather (daily, hourly, wind rose) | 10 to 16 March 2024 at Denver International Airport: daily highs, lows, rain, snow and wind, 168 hours of hourly observations, and hours of wind by direction and speed | NOAA National Centers for Environmental Information, GHCN Daily and Local Climatological Data, National Weather Service observations | Public domain (U.S. Government work) |
| ERCOT Daily Demand | Open, high, low and close of each day’s hourly demand on the Texas grid in gigawatts, all 366 days of 2024 | U.S. Energy Information Administration, Hourly Electric Grid Monitor (Form EIA-930), ERCOT balancing authority | Public domain (U.S. Government work) |
| ERCOT Hourly Demand August | Demand for every hour of August 2024: 744 hours | U.S. Energy Information Administration, Form EIA-930, ERCOT | Public domain (U.S. Government work) |
| Palmer Penguins | Bill, flipper and body mass measurements of 342 Adelie, Chinstrap and Gentoo penguins on three islands, 2007 to 2009 | Horst, Hill and Gorman (2020), palmerpenguins, doi:10.5281/zenodo.3960218; data collected by Dr. Kristen Gorman and the Palmer Station, Antarctica LTER | CC0 1.0 |
| Lichess Rapid Game | All 154 half-moves of one rated rapid game with evaluations, accuracy and clock times; players named only by color | Lichess (lichess.org), game 5ai5dSgm with the server’s Stockfish analysis | CC0 1.0 |
| LifeSnaps (daily activity, heart rate, sleep stages) | One participant’s 27 days in July 2021 on a Fitbit Sense: daily steps and active minutes, 637 hours of heart rate and 737 sleep stage periods | Yfantidou S, Karagianni C, Efstathiou S, Vakali A, Palotti J, Giakatos DP, Marchioro T, Kazlouski A, Ferrari E, Girdzijauskas Š (2022), LifeSnaps: a 4-month multi-modal dataset capturing unobtrusive snapshots of our lives in the wild, doi:10.5281/zenodo.7229547, described in Scientific Data 9, 663, doi:10.1038/s41597-022-01764-x | CC BY 4.0 |
| Daylight Hours | Hours from sunrise to sunset for every 5 degrees of latitude on every 7th day of the year: 1,961 rows | Computed for Chart Guru with NOAA’s solar equations | Original to Chart Guru |
U.S. Government works carry no copyright in the United States, and CC0 data is dedicated to the public domain, so neither requires credit; the sources ask to be cited, and the package’s data README cites them. The LifeSnaps data is licensed under CC BY 4.0, which requires credit: the authors are named above, and the data README lists every change made for Chart Guru, such as keeping one participant and rounding heart rates to whole beats per minute. The tide data in the Large Datasets lesson is not a dataset file; a small script computes it when the scene opens.
How to learn with the lessons
The lessons are designed to be read, not only watched. A good routine:
- Open the scene in Edit Mode. Every chart already shows its saved data, because each one is a chart host with an inline definition. Data reaches it through its own Data Asset or table, or from a data source on the chart or a parent object.
- Select a chart and read its definition. The Inspector shows the Chart card with the type, theme and Chart asset, then the Data, Marks, Axes, Labels, Style, Behavior and Output tabs. Change a setting and the live preview follows, so you learn what each control does by trying it.
- Press Play and interact. Hover, select, drag and click as the lesson suggests. In these scenes, selection, tooltips and scrolling respond to the pointer in Play Mode.
- Read the code where code is the lesson. Most charts need no code, so the lessons keep scripts only where runtime code is the point: live data, animation and morphs, linked selection, charts from code, function plots, scroll behaviors, audio graphs and data frame transforms. Those components keep their steps in comments and sit under the
Chart Guru/Examplescomponent menu. - Take a chart with you. Copy its C# or Swift from the Inspector, or point its Data Asset at your own data and keep the design.
The Samples and Concepts chapter of the manual describes the same tracks, and Feature Concepts Guided by the Examples maps the concepts you will meet along the way.
The same approach in 3D
The included Chart Guru 3D module teaches the same way, with 17 scenes in matching tracks: the 2023 Tonga earthquakes by depth and magnitude, Mount St. Helens and U.S. Treasury yield curves as surfaces, Texas grid generation by source, hour and month, charts that lift from 2D into 3D, and production examples such as a terrain survey, a live sound spectrogram and a greenhouse game level where each bed carries its own harvest chart. The Chart Guru 3D page covers the module.
Chart Guru is available on the Unity Asset Store, with all lessons, datasets and the 3D module in one package.
Easy, reliable charts for Unity, from sparklines to multi-series 3D.
Keep reading
 Article
Accessible charts in Unity
Accessibility with Chart Guru for Unity: color choices that survive color vision deficiency, descriptions and per-mark labels, Unity 6 screen reader support, audio graphs you can hear, and semantic CSV and JSON export.Use caseReal-time graphs for live and high-volume data in Unity
Chart Guru streams live values into Unity charts through a fixed-capacity ring buffer you can push from any thread, web sources that poll with backoff, and your own adapters. Stable updates are tested to allocate nothing after warm-up. Article