Feature Concepts Guided by the Examples
The Programmatic examples are also a concept map. Use them to learn how features fit together, not only how to type a builder call. The same concepts apply whether the chart is made in the Inspector, Designer, Gallery, UI Toolkit, Swift import, or fluent C#.
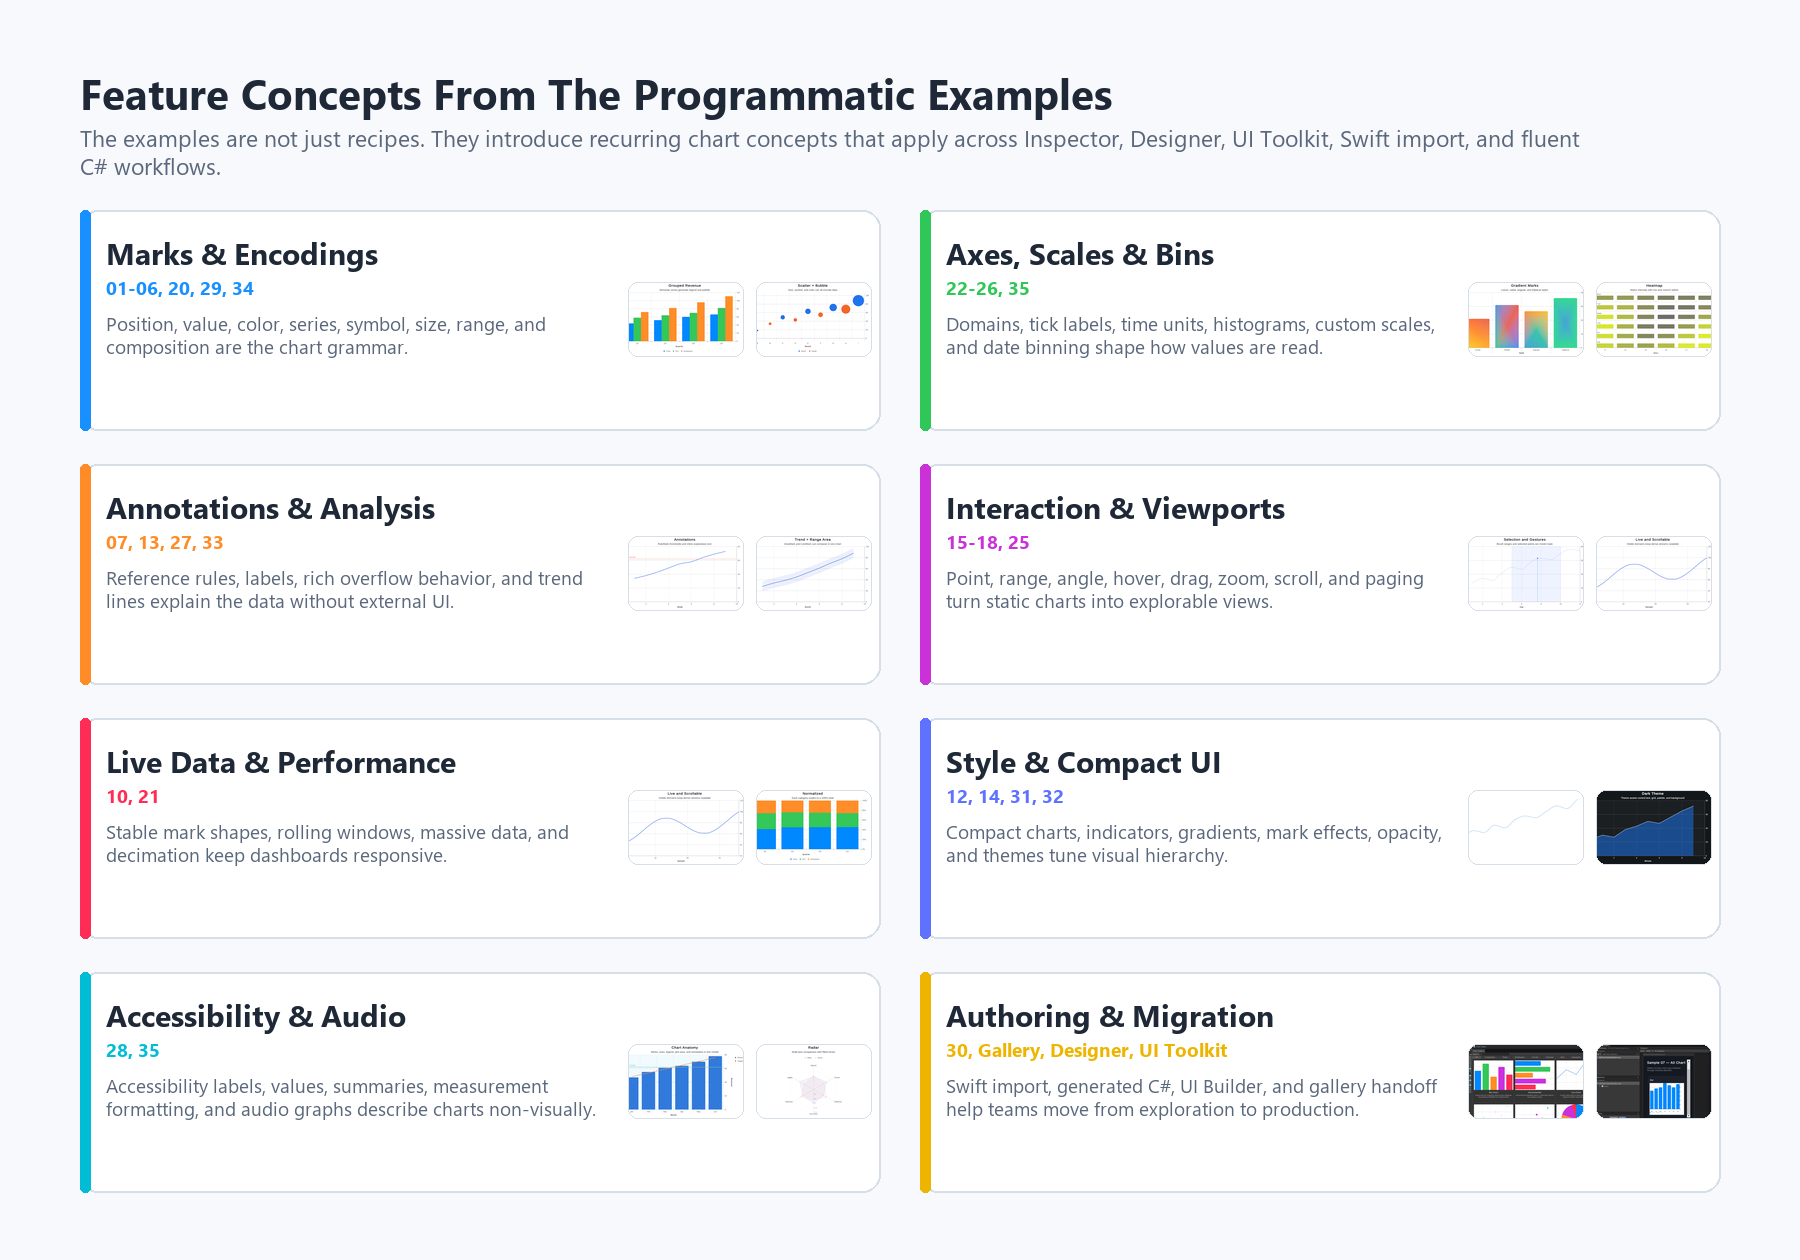
Feature concept atlas. Programmatic examples grouped by the recurring concepts they teach across authoring workflows.
Concepts to look for while reading examples
- Marks and encodings: BarMark, LineMark, AreaMark, SectorMark, PointMark, RectangleMark, RuleMark, and composed marks describe what is drawn. Encodings such as X, Y, ForegroundStyle, Symbol, size, label, and series describe what the data means.
- Chart type versus mark grammar: chart type chooses the default visual family, but marks still carry the semantic intent. This is why composed charts can combine bars, lines, points, rules, overlays, and annotations in one chart.
- Axes and scales: domains, ticks, labels, time units, custom scale transformers, range padding, and binning decide how values are read. These concepts matter as much as the visual chart type.
- Annotations and analysis: reference rules, trend lines, rich labels, overflow behavior, and accessibility descriptions turn a chart from a picture into an explanation.
- Interaction and viewports: selection, brushing, angle selection, hover, drag, zoom, scrolling, paging, and visible domains create explorable charts without adding separate UI controls.
- Live data and performance: use stable mark shapes, SetValues, ring buffers, rolling windows, LOD, and decimation when data changes frequently or arrives at high volume.
- Styling and compact UI: themes, gradients, mark effects, opacity, symbol choices, compact charts, indicators, and data labels tune information hierarchy for dashboards and repeated UI cells.
- Accessibility and sonification: measurement formatting, per-mark labels/values, chart summaries, trend descriptions, and audio graphs help charts communicate beyond the visual rendering.
When a feature is unclear, find the closest Programmatic example first, then decide whether to reproduce it in code, adapt it in the Designer, import a matching Swift Charts snippet, or express it as a ChartGuruElement in UI Toolkit.