Live charts on LED walls and scoreboards
Mirror live Chart Guru charts onto LED Studio boards in Unity with an optional integration package, for scoreboards, control-room walls and venue displays.
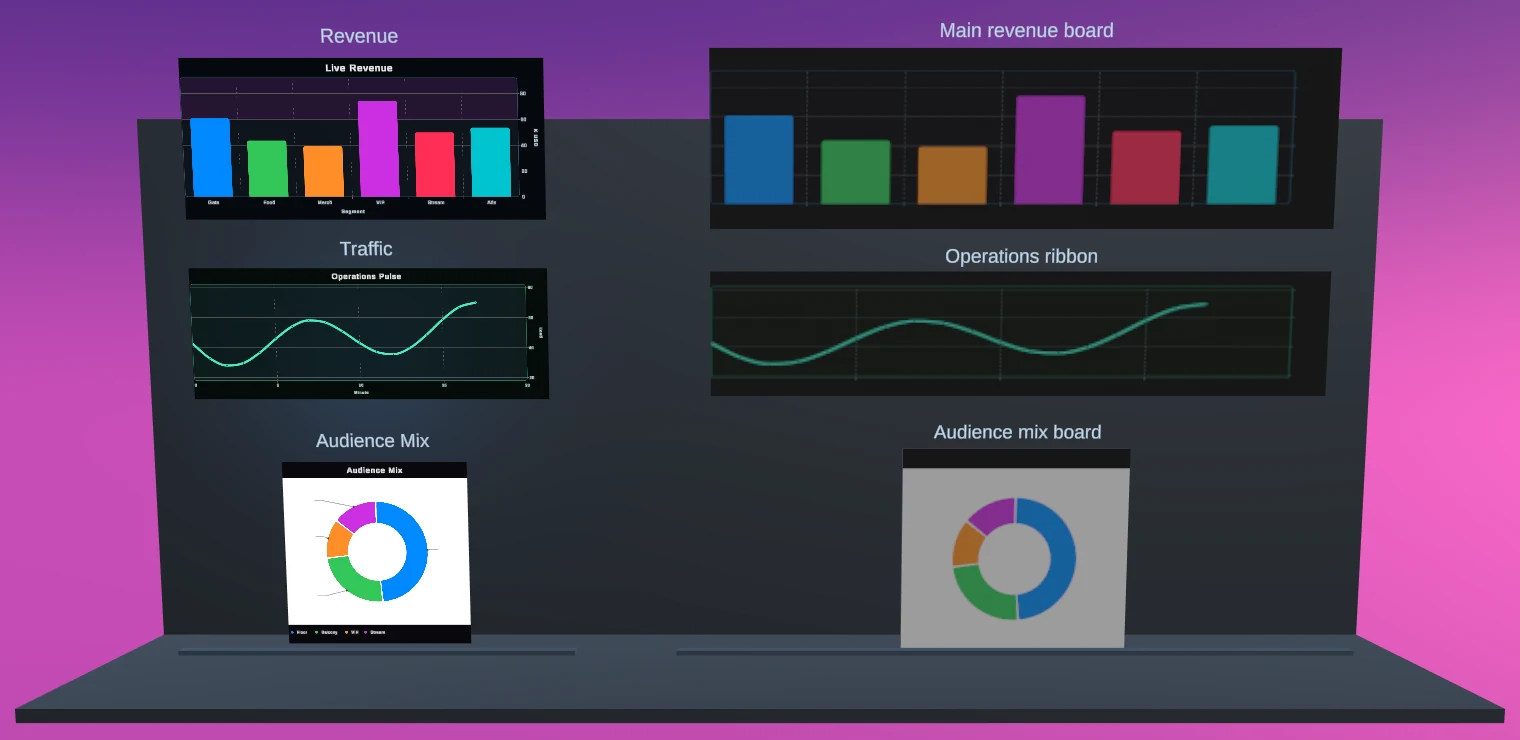
A chart on a monitor is just a chart. The same chart on a stadium ribbon, a control-room wall or a venue screen has to read like it is made of LEDs. LED Studio, our separate tool for realistic LED walls, displays and signage in Unity, simulates the board. Chart Guru draws the chart. A small optional integration package connects the two, so a live chart keeps updating while LED Studio shows it on the board.
What the integration does
The package adds one component, LedChartDataSource, which appears in Add Component as LED Studio > Data Sources > Chart Guru Source. Put it on an LED Studio board, assign a Chart Graphic, and the board shows that chart’s rendered texture. The chart stays an ordinary Canvas chart in your scene: you design it in the Inspector or the Chart Designer, feed it from any data source, and its updates reach the board. The source takes a new texture from the chart only when the chart has changed or a setting was toggled.
Include Text decides whether the board shows the chart’s titles, axis labels, data labels and legends. Turn it off for a faster texture with the chart geometry only, for example when LED Studio’s own text sources draw the labels around the chart.
Set it up
- Install Chart Guru 1.1.0 or newer and LED Studio 1.2.0 or newer.
- Import the
ChartGuru_LEDStudio_Integrationpackage from Chart Guru’s Integrations folder. Importing activates the integration; no scripting define symbols are needed. - On the LED board, add Chart Guru Source from LED Studio > Data Sources and assign your Chart Graphic.
- Feed the chart: a
RingBufferChartDataSourcefor values pushed from code, aWebChartDataSourcefor an HTTP feed, or streaming mock data from the bundled Mock Magic while you design.
The integration references both tools directly, so import it only into projects that have both installed. The data sources documentation covers every way to feed the chart, and real-time graphs in Unity covers streaming in depth.
The sample: three live charts on a venue wall
The integration’s sample scene places three Chart Graphic sources on a rail and mirrors each onto its own board:
| Board | Chart |
|---|---|
| Main revenue board | Live Revenue: bars per segment for Gate, Food, Merch, VIP, Stream and Ads |
| Operations ribbon | Operations Pulse: a line of load per minute |
| Audience mix board | Audience Mix: a donut of Floor, Balcony, VIP and Stream |
The source charts are ordinary world-space Canvas charts standing beside the boards, so source and board can be compared side by side. The sample’s script builds each chart in code on a timer, shows it with SetChart and turns on AutoContrastText, which switches data and axis label colors for contrast against the mark or background behind them, then asks each board to refresh its sources.
Open it to see how a chart’s size, theme and text read once LED Studio turns them into emitters. The board shows the chart at its own resolution, so check text sizes and line widths on the board itself rather than on the source Canvas.
Choosing charts for a board
- Few categories. Bars and donuts with a handful of segments, as in the sample, read more easily at board resolution than dense charts.
- Compact types for ribbons. Sparkline, MiniBar and Indicator hide axes and padding, which suits long, low ribbon boards.
- Text where it belongs. Keep Include Text on when the chart’s own titles and labels should appear; turn it off when LED Studio’s text sources label the board.
- One theme for the wall. A
ChartThemesets palette, fonts, grid and backgrounds for every chart at once, so all boards match. The styling documentation lists its settings.
Where live charts on LED boards fit
- Scoreboards. LED Studio’s Score, Timer and Text sources show the numbers, and Chart Guru adds charts that update during play, such as momentum lines, possession splits or stat bars. Stats screens and match summaries shows chart patterns that carry over.
- Control-room walls. A digital twin or a training simulation can show its trends, timelines and KPI charts on a virtual wall. See charts for digital twins and HMIs.
- Venue and event displays. Revenue by segment, audience splits and operations load, as in the sample, fed from a live source.
Live updates work the same as on screen. A ring buffer accepts pushes from any thread and publishes at most once per frame, and once full it updates in place without allocating, so a wall of charts can follow a fast feed. Animated data changes and chart-type morphs play on the source chart and appear on the board with it.
3D charts and other limits
- The Chart Guru Source takes 2D Canvas charts only. Chart 3D, Chart 3D Image and Chart 3D Texture are not supported inputs.
- To show a 3D chart, render a camera that sees the chart into a Render Texture and feed that to LED Studio’s RenderTexture Source.
- Pixel pitch, emitter shapes, curved and cylindrical boards, moire and LED defects are LED Studio topics, covered on the LED Studio page.
The Chart Guru product page shows the chart types you can put on a board. Chart Guru is available on the Unity Asset Store; LED Studio is sold separately.
Frequently asked questions
Do I need LED Studio to use Chart Guru?
No. The LED Studio integration is an optional package, and Chart Guru works on its own in Canvas, UI Toolkit and world space. LED Studio is a separate product that you only need to show charts on simulated LED boards.
Can I show a 3D chart on an LED board?
Not through the Chart Guru Source, which takes 2D Canvas charts. Render a camera that sees the 3D chart into a Render Texture and feed that to LED Studio's RenderTexture Source instead.
Easy, reliable charts for Unity, from sparklines to multi-series 3D.
Keep reading
 Use case
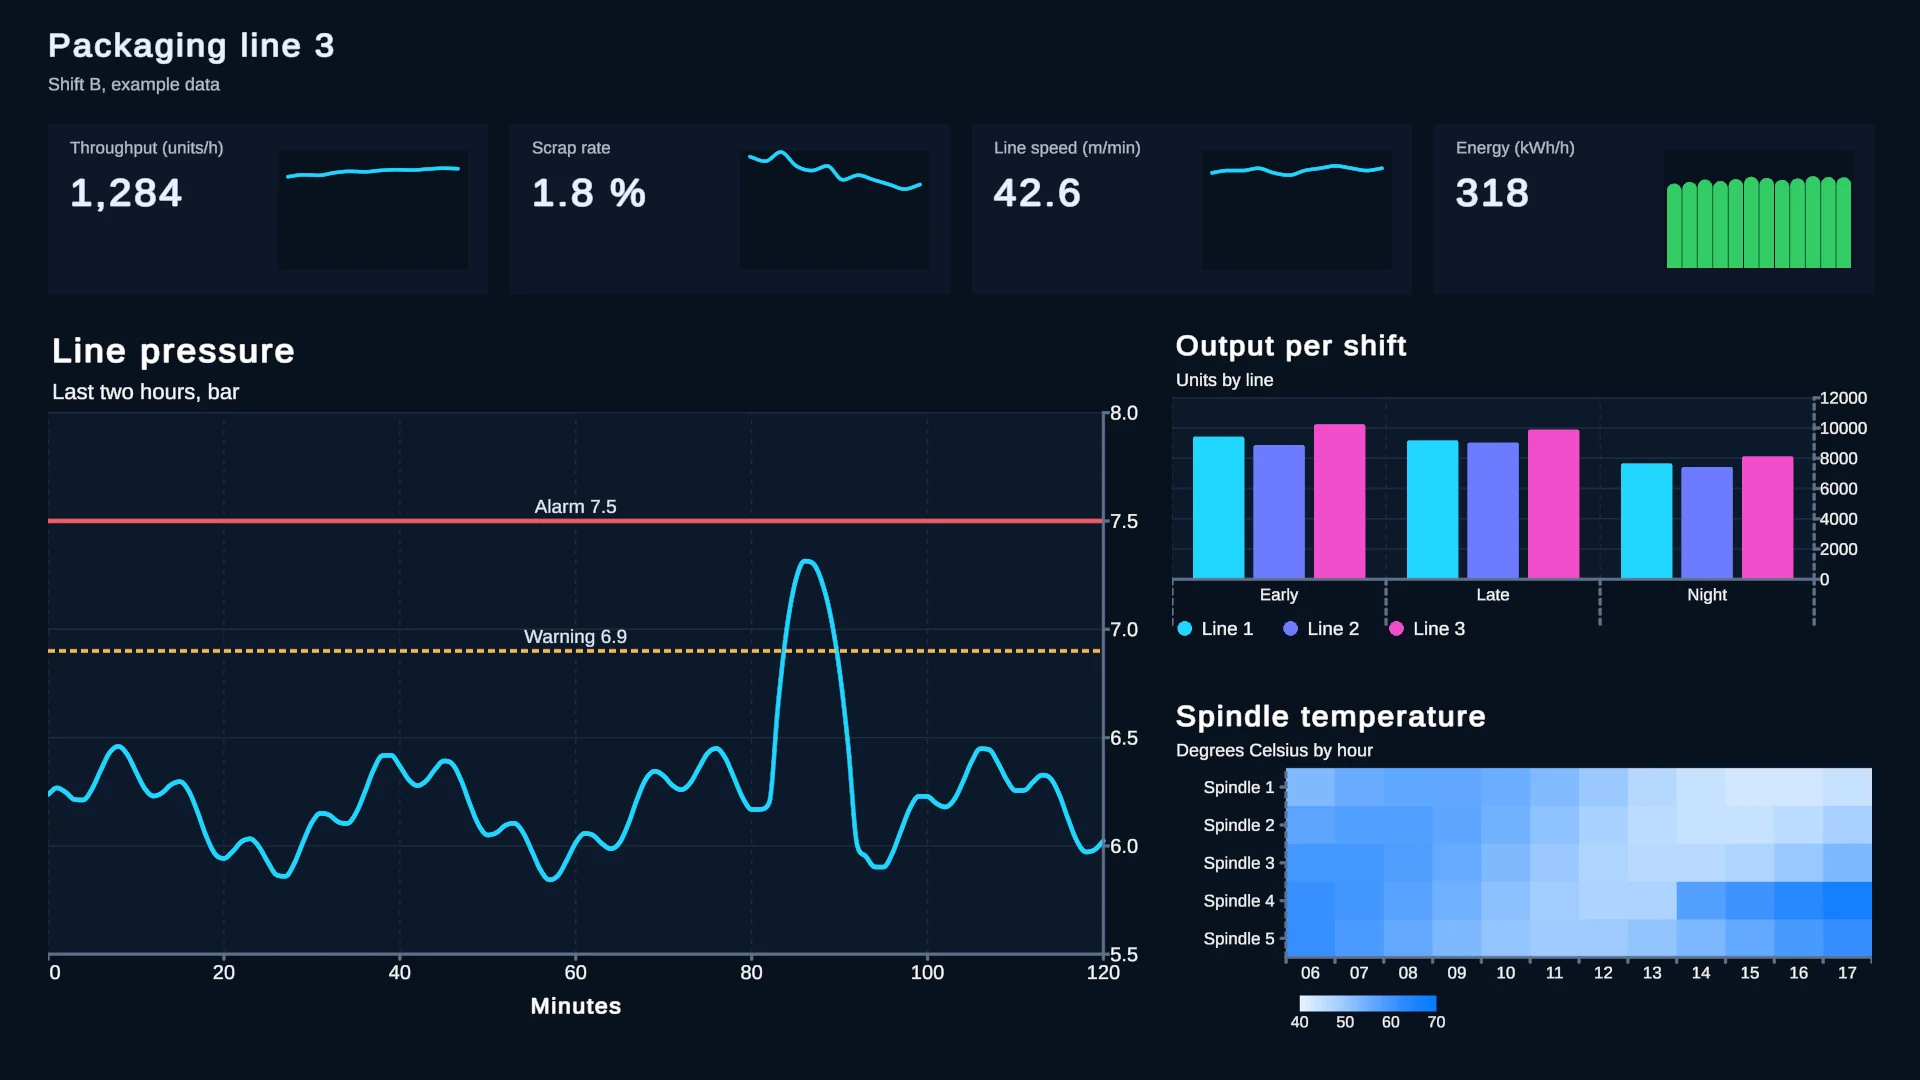
Charts for digital twins, HMIs and control rooms in Unity
Unity's industrial samples bind live values but draw no charts. Chart Guru adds trends with threshold rules, alarm and shift timelines, KPI sparklines, heat maps and world-space charts, fed by your own MQTT or OPC UA client.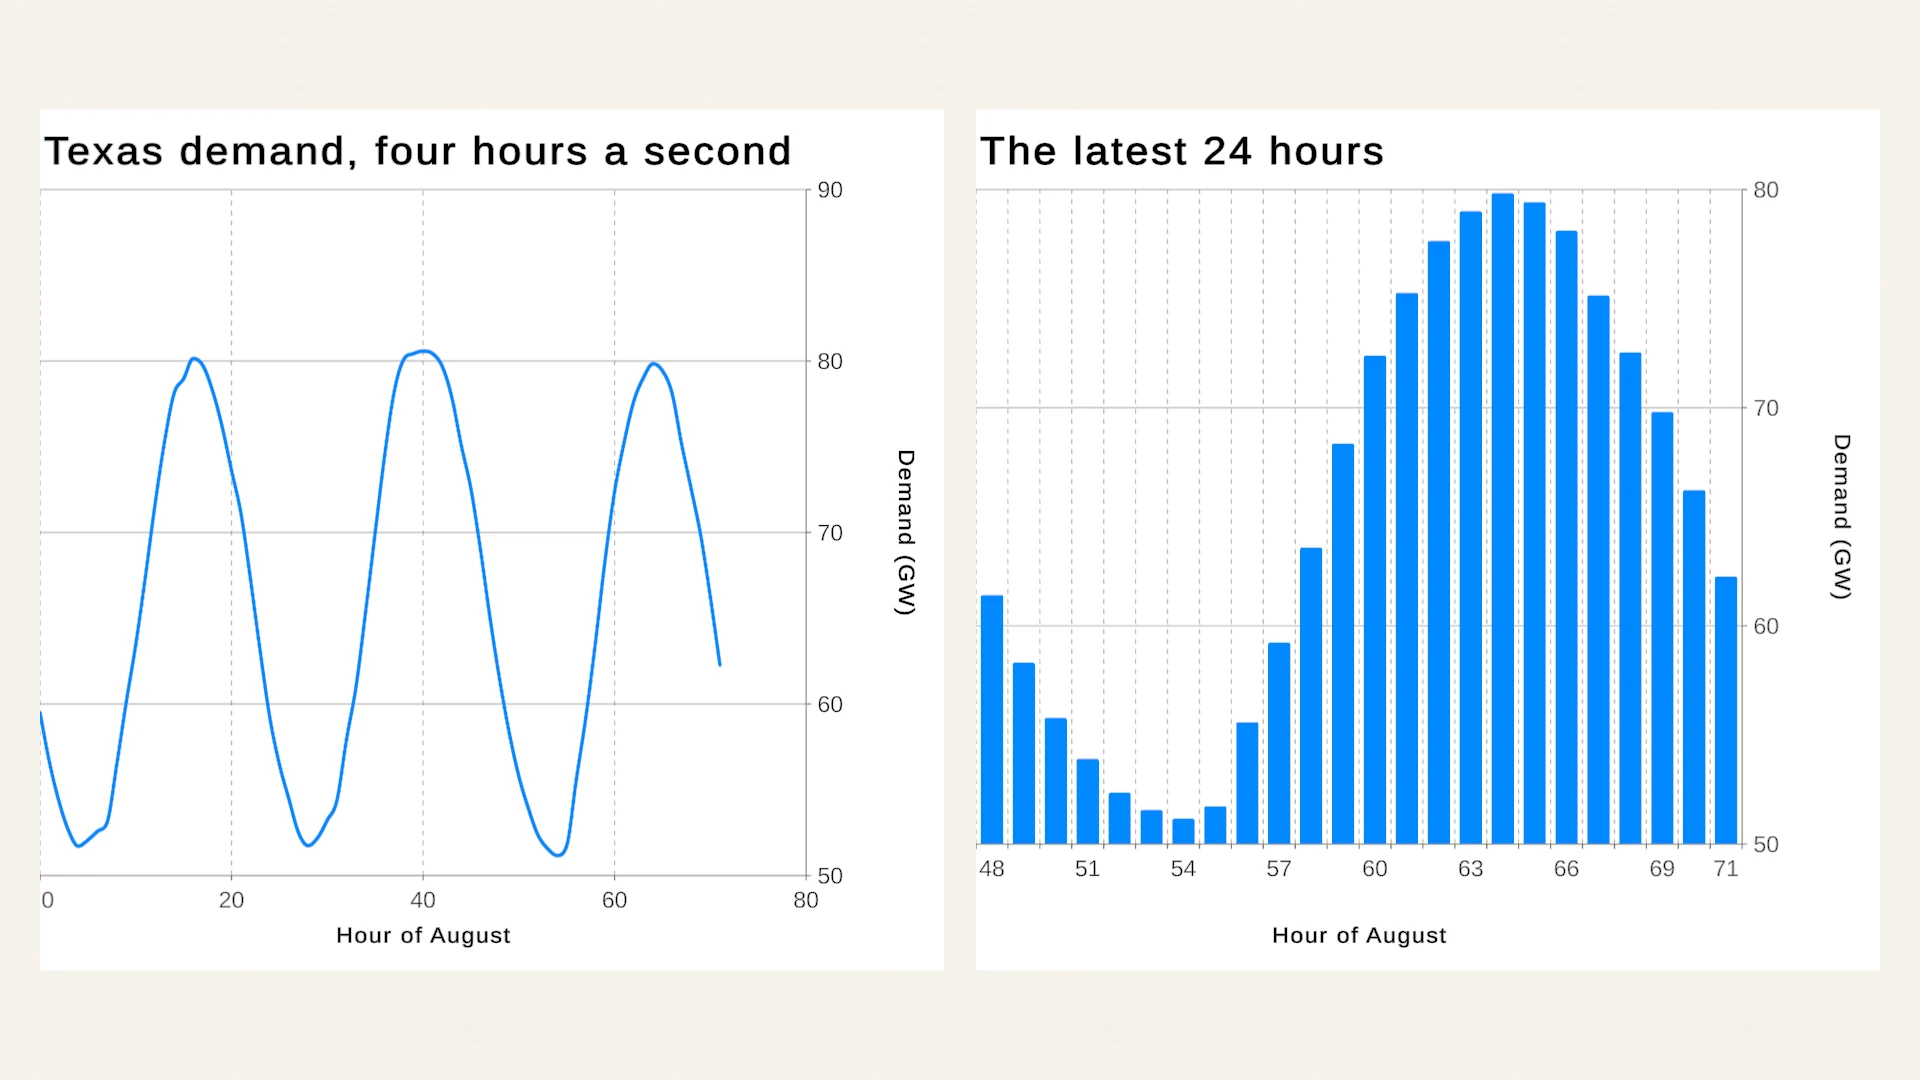 Use case
Real-time graphs for live and high-volume data in Unity
Chart Guru streams live values into Unity charts through a fixed-capacity ring buffer you can push from any thread, web sources that poll with backoff, and your own adapters. Stable updates are tested to allocate nothing after warm-up. Use case