Styling, Layout, and Labels
Themes
ChartTheme is a ScriptableObject that controls palette, text sizes, axis colors, grid colors, background, plot styling, shadows, glow, animation defaults, and text scaling. Assign a theme in the builder, ChartGraphic, ChartComponent, or ChartGuruElement.
Chart chart = Chart.Create()
    .Theme(myTheme)
    .ChartTitle("Revenue")
    .ChartLegend(LegendPosition.Bottom)
    .Build();
Chart area and plot area
Use the chart area settings for the outer background and border. Use plot area settings for the data region background, border, corner radius, and padding. This distinction matters when you want a card-like chart frame but a clean data plot inside it.
Axes and scales
Axes can be automatic or explicitly configured. Use domains when the chart should keep a stable range. Use categorical or band axes for named categories, time axes for dates, logarithmic or symmetric-log scales for broad numeric ranges, and power scales when a non-linear transform is needed.
Chart chart = builder
    .ChartXAxis(x => x.Label("Month").TickCount(6))
    .ChartYAxis(y => y.Label("Revenue").Domain(0, 100).TickFormat("F0"))
    .ChartYScale(0, 100)
    .Build();
Titles, labels, and annotations
Use the chart title for the main message and subtitle for context. Data labels show values on marks. Annotations attach explanatory text to a mark or reference line. RuleMark is the preferred way to add targets, thresholds, or baselines.
RuleMark target = RuleMark.Horizontal(100f).LineStyle(new[] { 8f, 4f });
target.ForegroundStyle(Color.green);
target.Annotation(AnnotationPosition.TopLeading, "Target");
builder.Add(target);
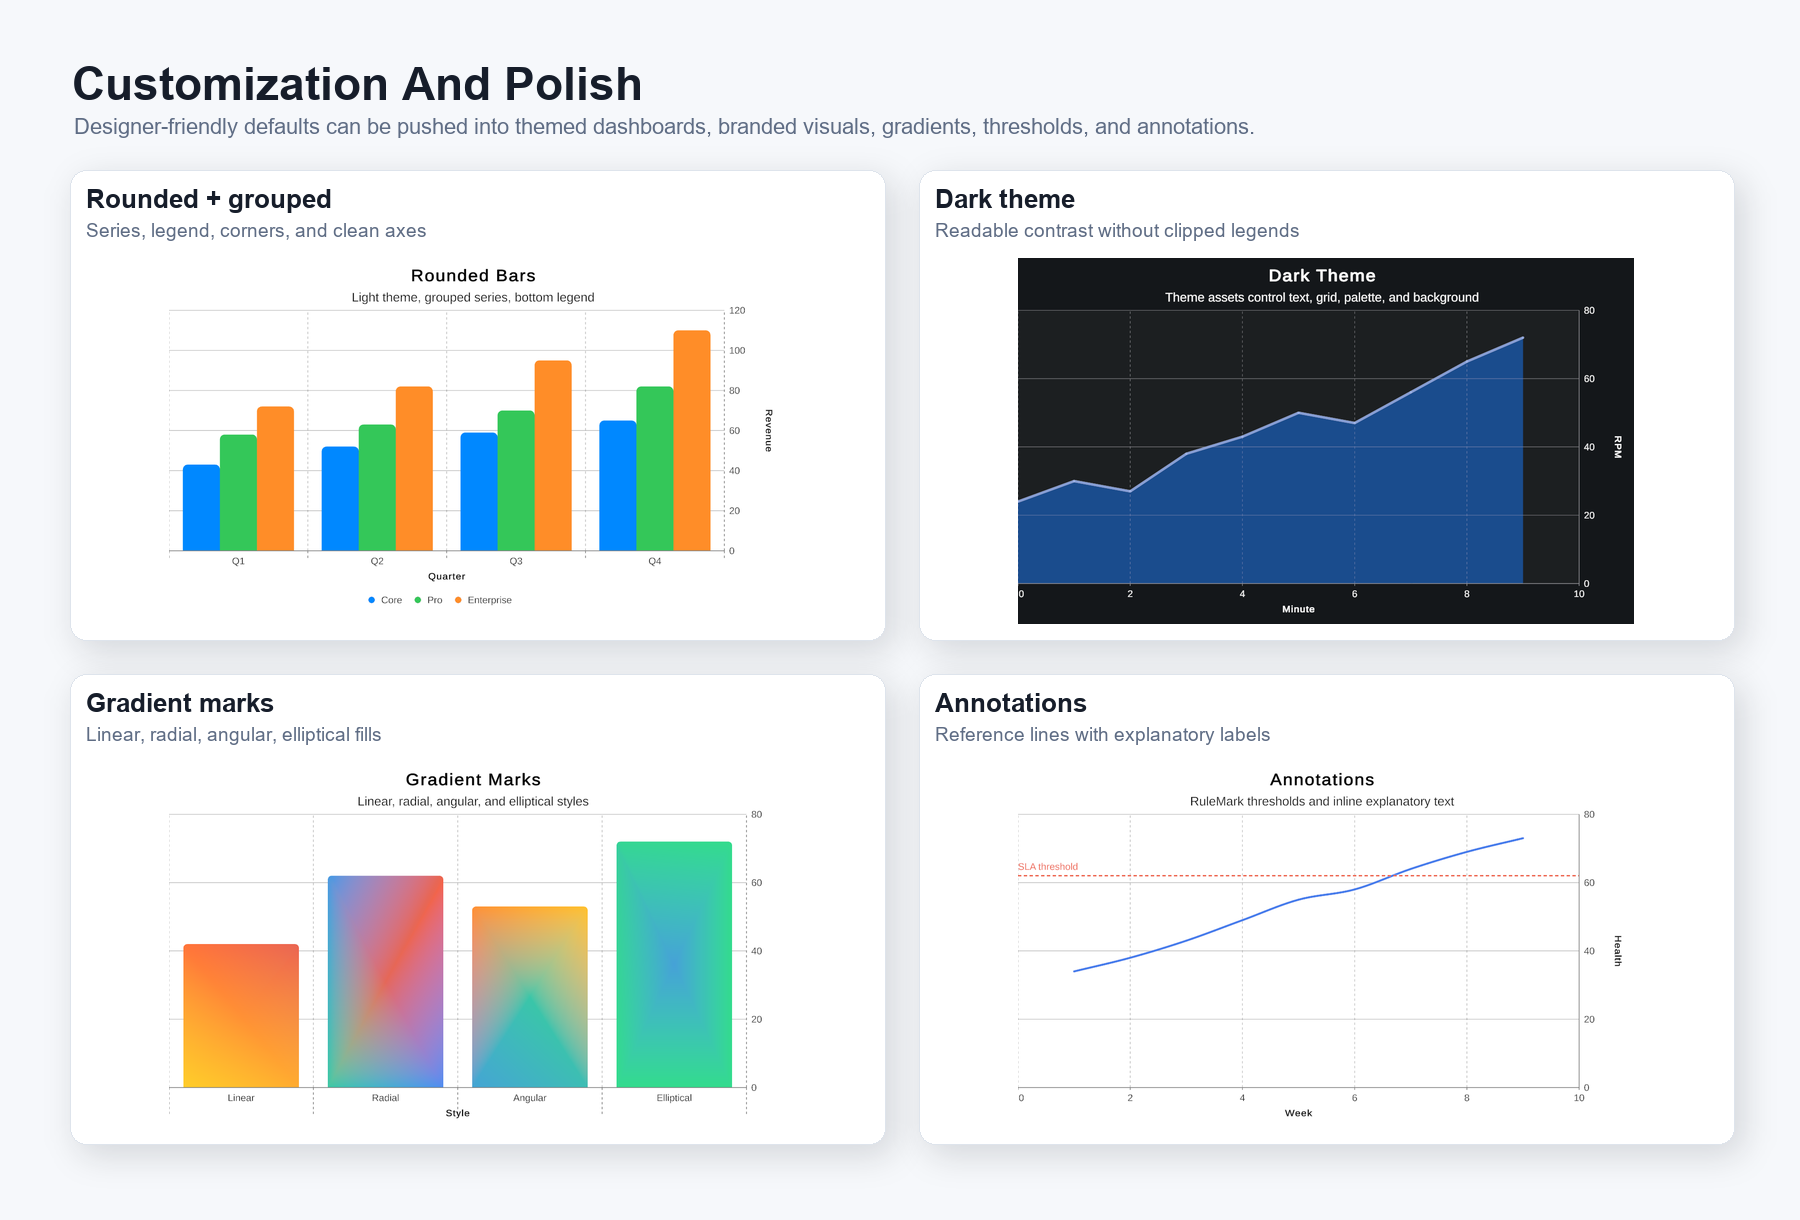
Figure 4. Customization gallery: rounded layouts, dark themes, gradient marks, and target annotations can be mixed without changing the data model.