Live candlestick charts for trading games and finance apps
Build live candlestick charts in Unity for trading games and finance apps: OHLC candles from Yahoo Finance, a licensed feed or mock streams, plus volume and waterfalls.
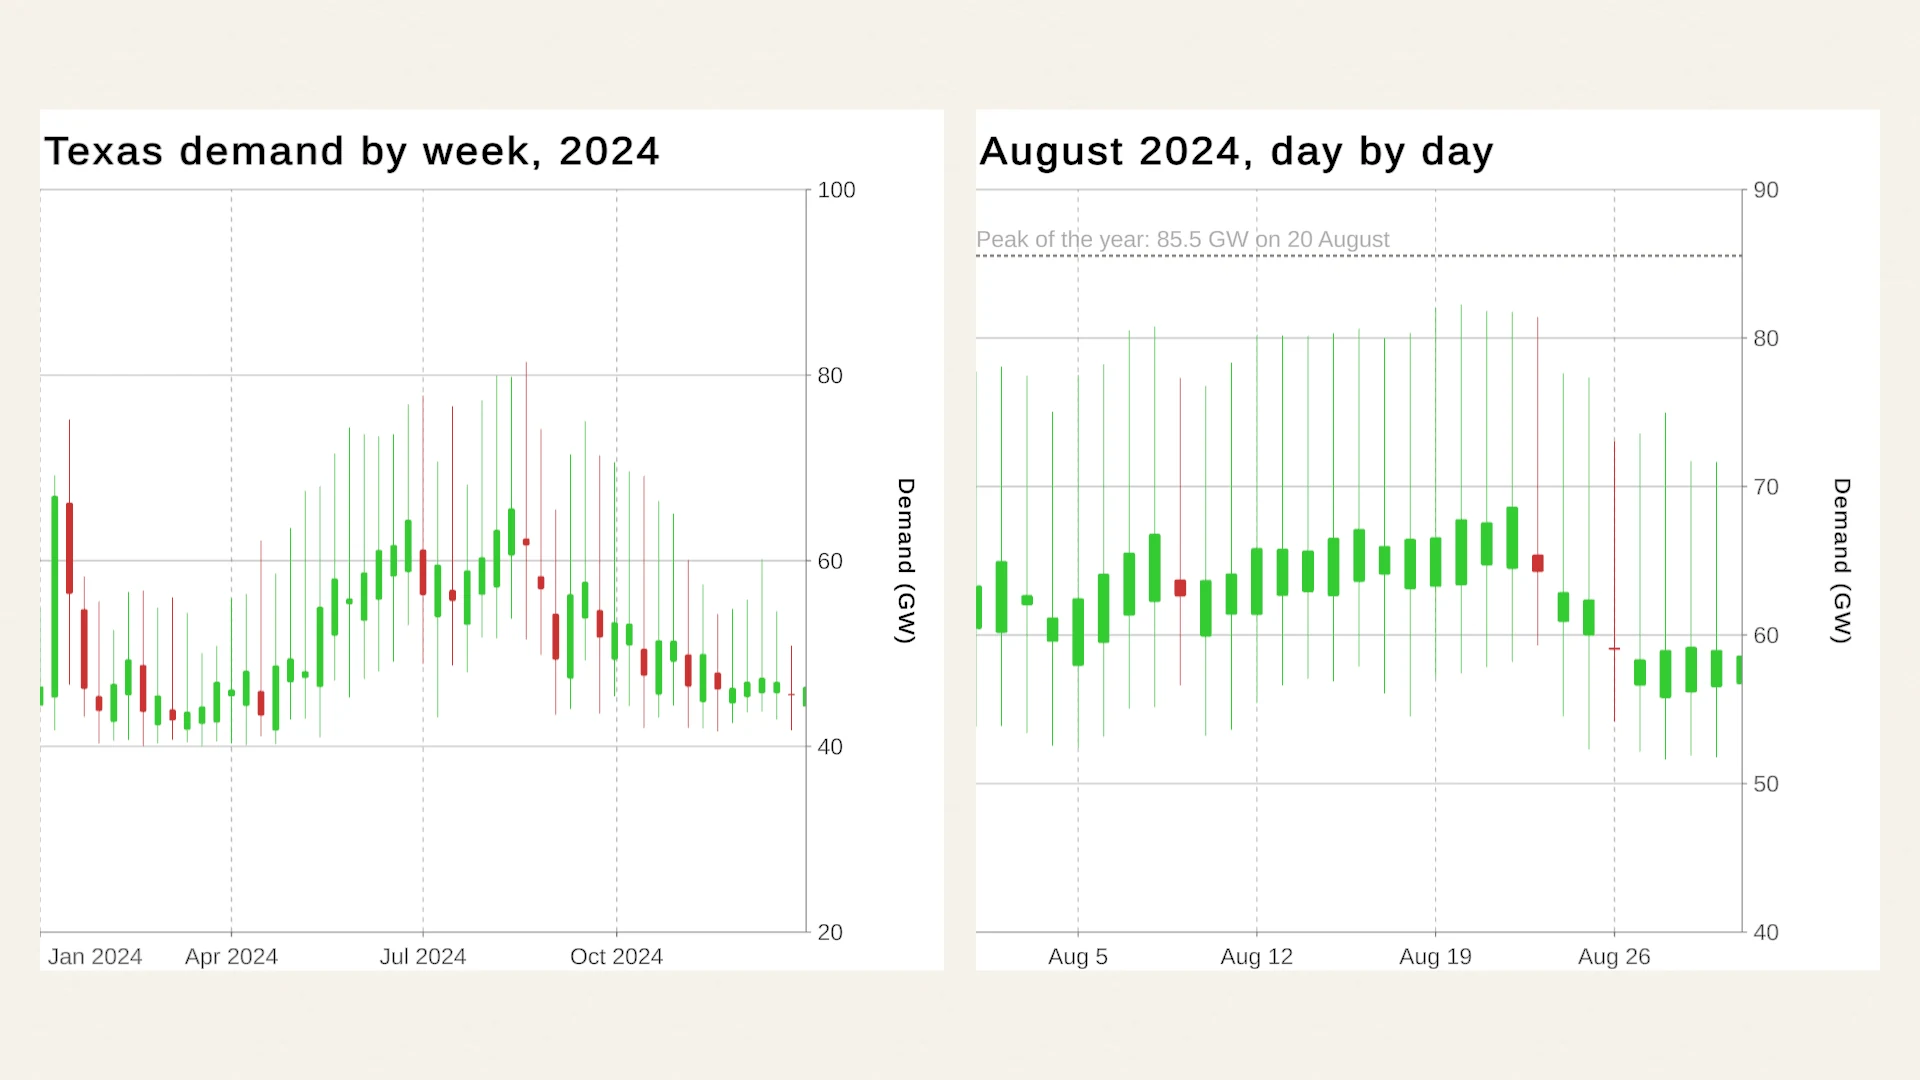
A trading game, a stock market simulation or a finance app needs the same chart: candles that show how each period opened, peaked, dipped and closed, updating while the player watches. Chart Guru draws them as a built-in chart type and feeds them from a market endpoint, your own feed or a simulated market, with the scrolling, zoom and tooltips players expect.
Candlesticks as a chart type
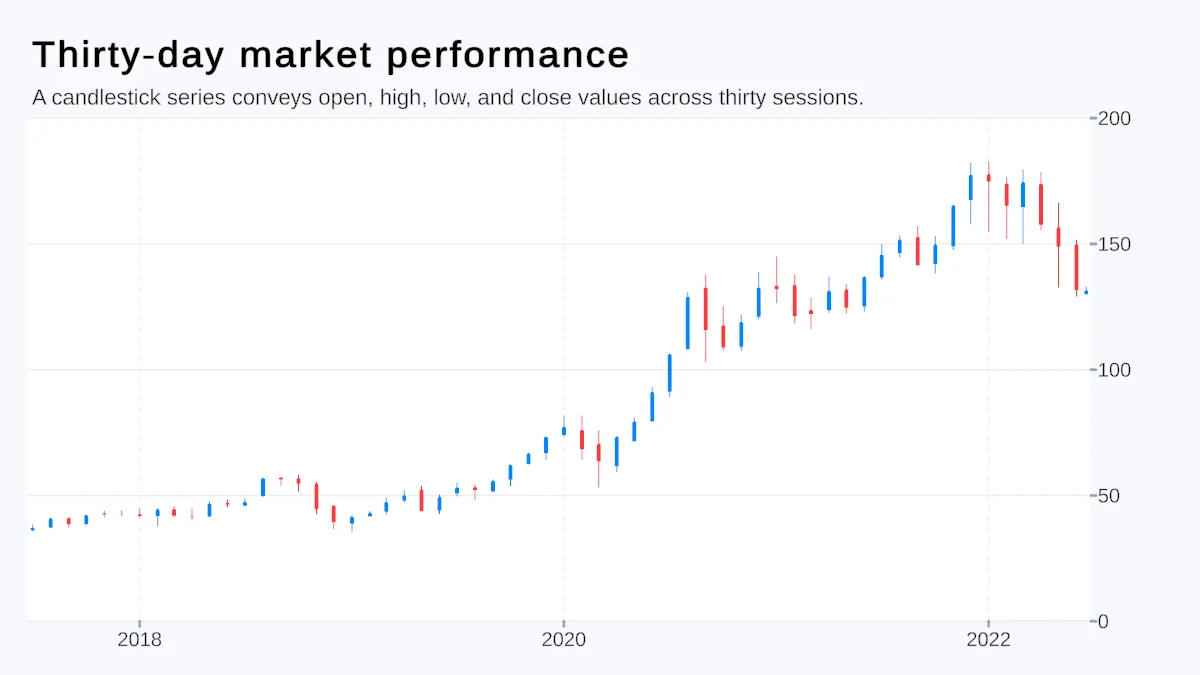
Candlestick is one of Chart Guru’s eleven full 2D chart types. Each CandleStickMark takes an X position plus open, high, low and close values and draws a body for the open to close range and a wick for the high to low range, colored by whether the period rose or fell. You can set the rising and falling colors, the body width, the wick width and a corner radius.
The 2D Gallery has a candlestick template to start from. In the Inspector you bind the source’s columns to the Open, High, Low and Close channels on the Marks tab, and the Chart Designer has a dedicated Candles view for editing OHLC rows. Hover tooltips list the open, high, low and close of the candle under the pointer.
Three ways to feed candles
| Source | What it gives you | Use it for |
|---|---|---|
YahooFinanceChartDataSource | Date, Open, High, Low, Close and Volume columns for a symbol | Prototypes and demos |
WebChartDataSource or a custom ChartDataSource | Any HTTP CSV or JSON feed, or any client library you write an adapter for | Shipped products with a licensed feed |
MockChartDataSource with the Candles shape | Generated candles that stream at a rhythm you choose | Games, simulations and testing |
Yahoo Finance for prototypes
Set Symbol, Range and Interval on the Yahoo Finance source and the mapping configures itself for a candlestick chart on first use. Ranges run from one day to the maximum history, and intervals from one minute to three months. Long ranges only accept coarse intervals: Yahoo rejects one-minute candles for ranges longer than seven days, so keep the defaults when you are unsure.
Be clear about what this source is. It reads Yahoo’s public chart endpoint, which is unofficial, rate-limited and subject to Yahoo’s terms. Chart Guru’s API reference says not to poll it faster than once per minute in production and points live trading dashboards to a paid market-data provider. For anything you ship, connect a licensed feed through WebChartDataSource, which handles polling, backoff, cancellation and credentials kept out of saved assets, or through a custom source.
Simulated markets for games
A trading game rarely wants real prices. The mock data source, built on the included Mock Magic tool, generates candles in which each new candle opens at the previous close and keeps its high and low inside the value range you configure, so a streamed market never jumps between candles:
using ChartGuru;using MockMagic;using UnityEngine;
public sealed class MarketSimulation : MonoBehaviour{    void Start()    {        MockChartDataSource market = gameObject.AddComponent<MockChartDataSource>();        market.Shape = MockDataShape.Candles;        market.PointsPerSeries = 60;        market.Rhythm = StreamRhythm.Drip;        market.EmissionInterval = 2f;        market.MaxDataPoints = 120;        market.Regenerate();        market.StartStreaming();    }}
The drip rhythm emits single candles at irregular gaps that average the interval, like trades arriving, and appending drops the oldest candle once 120 are on screen. A deterministic seed replays the same market, which helps when you balance a game around it.
Price, volume and other compositions
Chart Guru composes compatible marks in one chart, so a finance screen is not limited to candles:
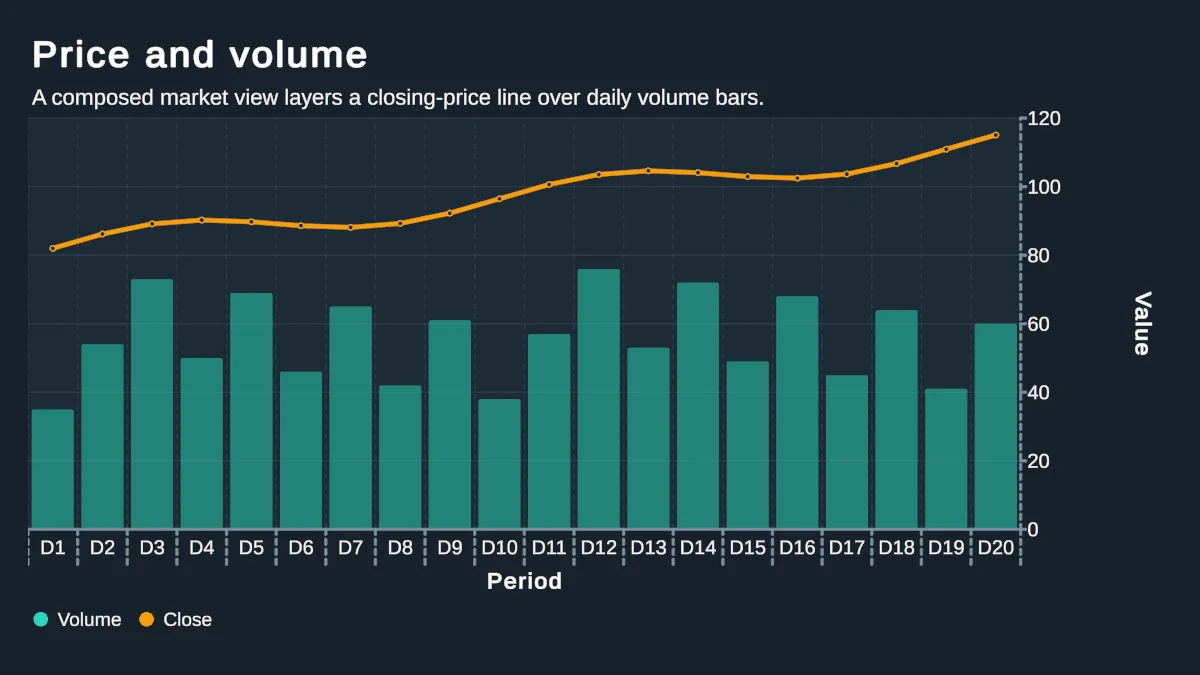
- Price and volume. A closing-price line drawn over daily volume bars, as in the first example below.
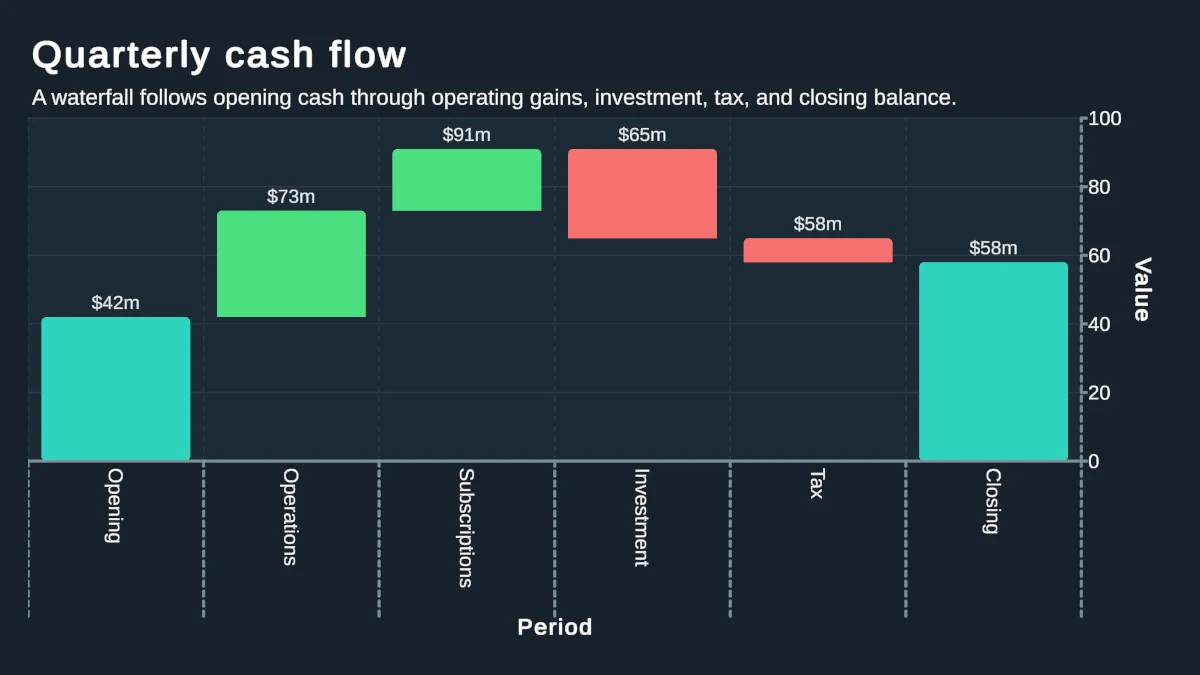
- Waterfalls. A cash flow or profit bridge is a composed bar chart in which each step starts where the previous one ended.
- Range bars. Start and end channels draw daily low to high ranges or trading sessions as bars.
- Reference rules. A
RuleMarkmarks a strike price, a stop-loss or a target, with an annotation.
Scrolling, zoom and tooltips
Long histories need a window. ChartScrollableAxes set to ScrollableAxes.Horizontal, together with ChartXVisibleDomain(length), shows part of the series and lets users drag through the rest, and pinch zooms on touch screens. The Behavior tab of the Inspector holds the same settings for saved charts. Tooltips can follow the pointer or pin on tap, which suits a mobile trading screen where hovering is not an option. The interaction and live updates page covers selection, brushing and linked charts, for example a candle chart linked to a volume chart.
Real data to learn from
The Candlesticks lesson draws electricity demand on the Texas ERCOT grid from the U.S. Energy Information Administration as candles: 2024 by week, and August 2024 day by day. Demand behaves like a price here, with each period opening, peaking, dipping and closing, so the chart reads the way a market chart does. The package also includes the full year as 366 daily open, high, low and close rows, which the Scrolling and Paging lesson pages through thirty days at a time.
Ticks and live updates
Candles change less often than trades. To show every trade, push its price into a RingBufferChartDataSource from your feed’s thread; the buffer publishes at most once per frame and allocates nothing once full. Because the ring buffer holds single values, aggregate ticks into candles in your own code and publish the candle table through a custom source, or update a code-built chart with SetData. The real-time graphs guide covers both paths.
Limits
- The Yahoo Finance source is for examples and prototypes, not for production market data.
- Chart Guru ships no broker or exchange connectors; licensed feeds come in through the Web source or your own adapter.
- Technical indicators such as moving averages are not built-in presets.
ChartDataTransforms.Rollingadds a trailing-window mean or another statistic as a new column, which you draw with standard marks; anything more specialized is your own code.
See the data sources documentation for every source setting and the Chart Guru product page for the full feature list. Chart Guru is available on the Unity Asset Store.
Frequently asked questions
Can I use the Yahoo Finance source in a shipped product?
Treat it as a prototyping source. It reads Yahoo's public chart endpoint, which is unofficial, rate-limited and subject to Yahoo's terms, and the source's own API reference advises against polling it faster than once per minute in production. For a product, connect a licensed market-data feed through WebChartDataSource or a custom ChartDataSource.
How do I simulate a market for a trading game?
Add a MockChartDataSource with the Candles shape and start streaming. Each generated candle opens at the previous close and keeps its high and low inside the configured value range, and in append mode the oldest candles drop off once MaxDataPoints is reached, so the chart scrolls like a live market.
Can I show every trade as it happens?
Yes, as a price line. Push each trade into a RingBufferChartDataSource from any thread; it publishes at most once per frame and allocates nothing once full. The ring buffer holds single values, so build candles from ticks in your own code and publish them through a custom source.
Easy, reliable charts for Unity, from sparklines to multi-series 3D.
Keep reading
 Use case
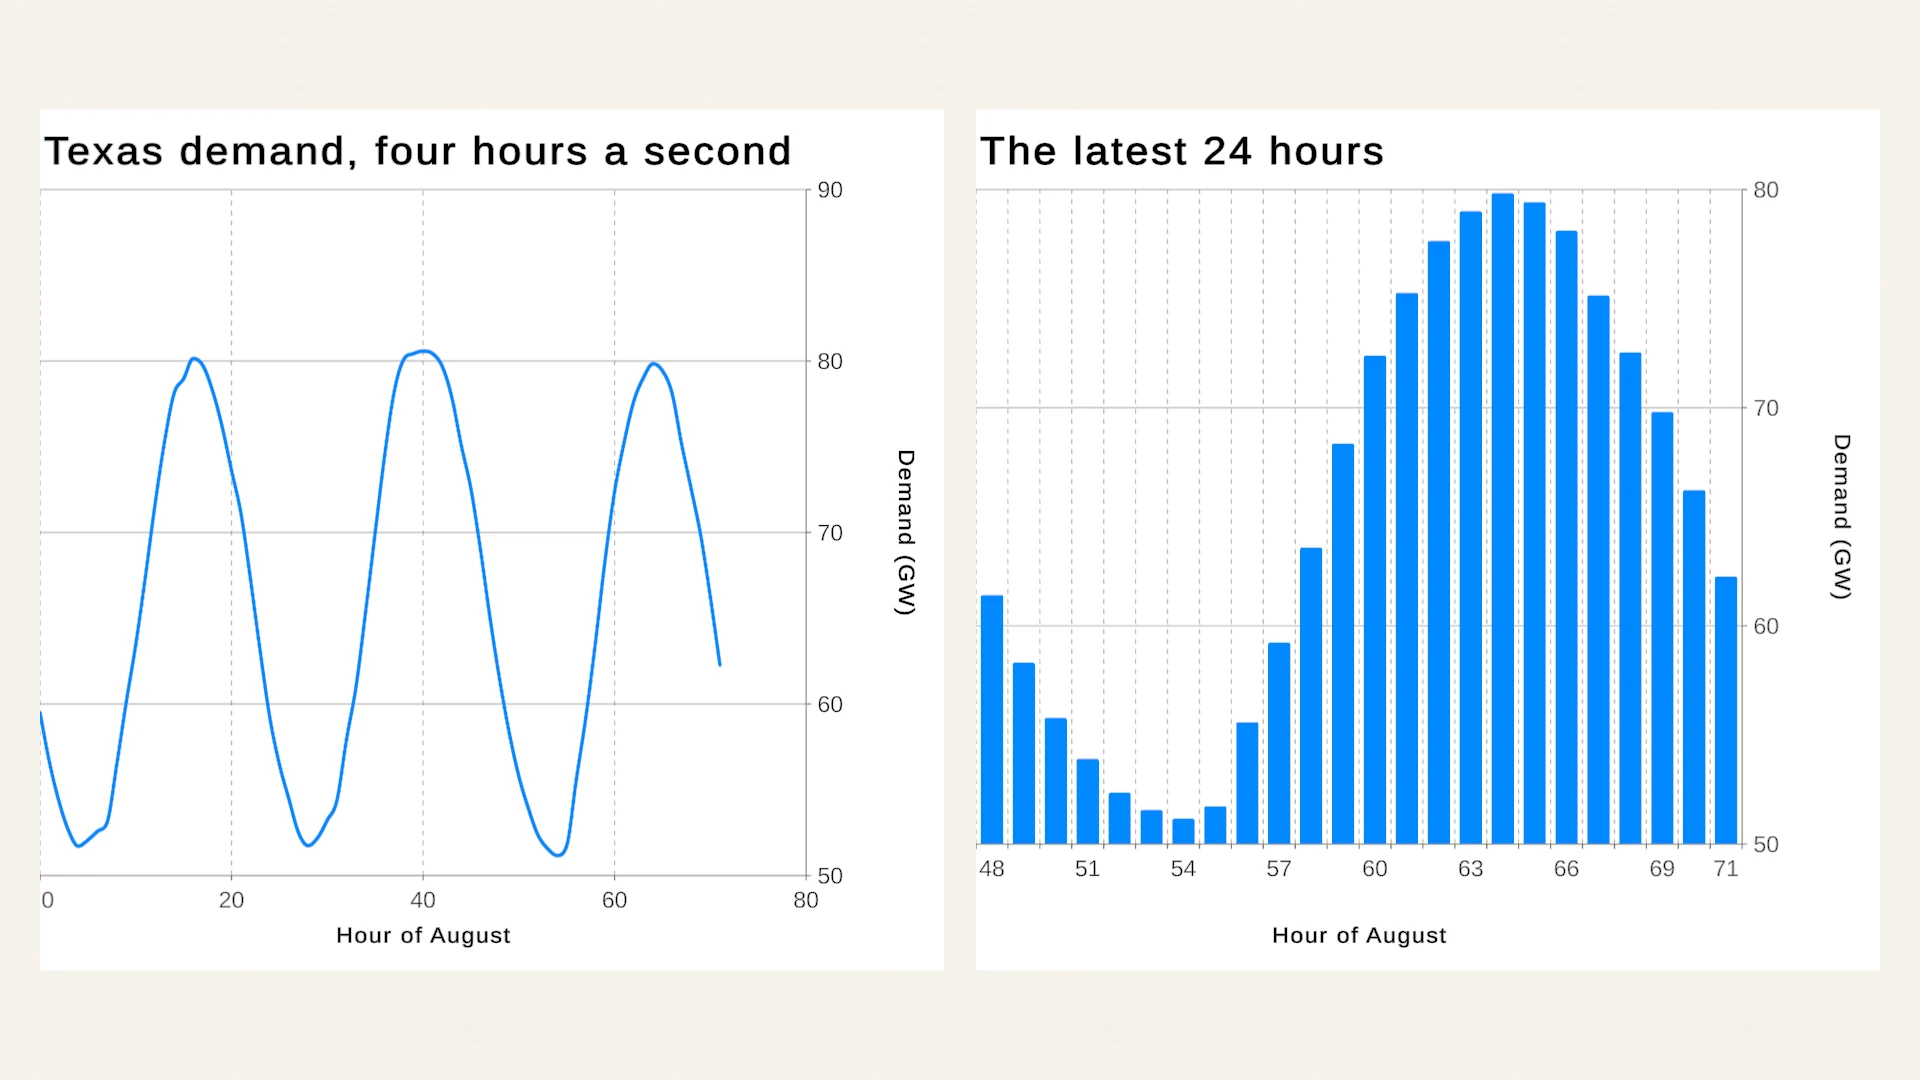
Real-time graphs for live and high-volume data in Unity
Chart Guru streams live values into Unity charts through a fixed-capacity ring buffer you can push from any thread, web sources that poll with backoff, and your own adapters. Stable updates are tested to allocate nothing after warm-up.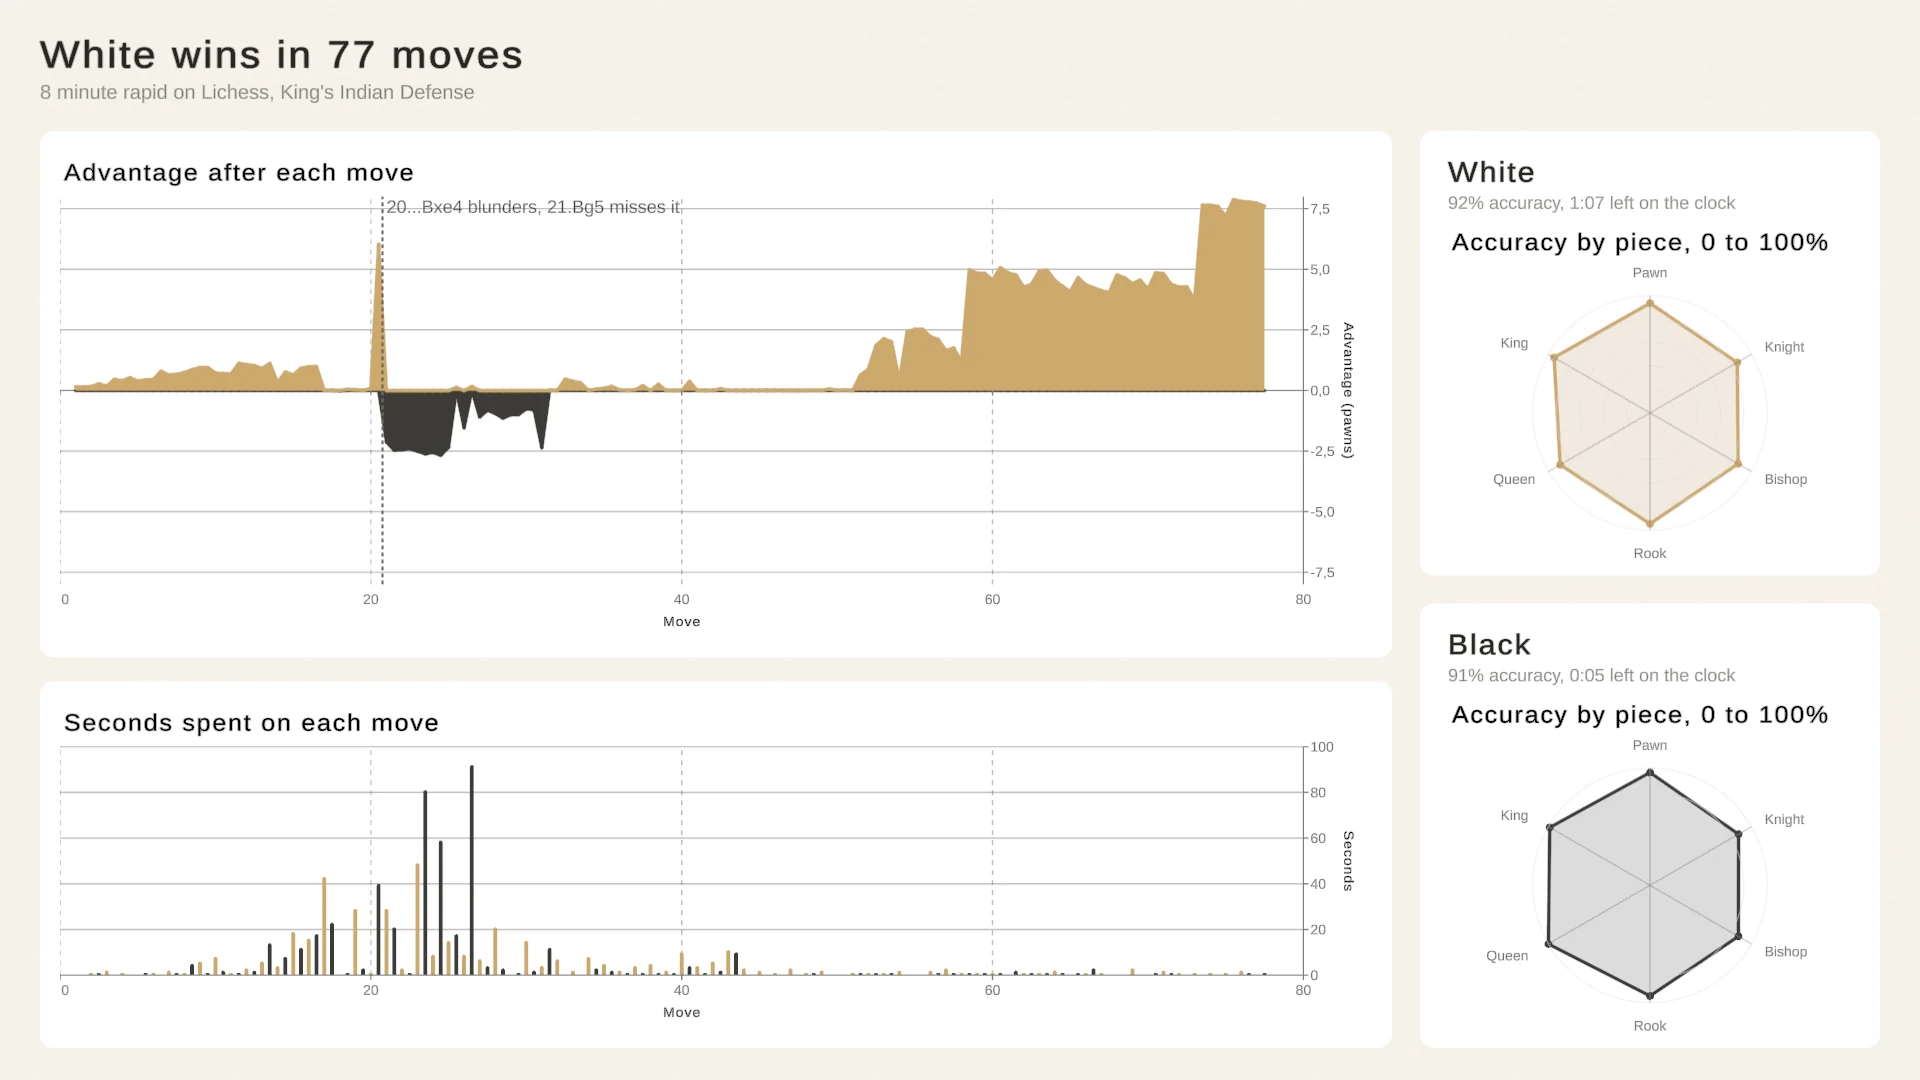 Use case
Stats screens and match summaries for games
A stats screen tells the story of a match or a season. Chart Guru's Match Summary example turns a real Lichess game into linked charts, and the same parts build progression, economy and profile screens. Article