Test charts and dashboards with patterned data
Generate chart-ready series in Unity: 15 patterns such as seasonal, random walk and bell curve, with labels, noise, negative values and up to 10 series, then export or stream.

A chart has to survive data that nobody tidied up: a series that dips below zero, three lines that cross twice, month labels that repeat after December, a quarter with no sales at all. Hand-typed demo arrays rarely contain any of that. Mock Magic’s Series workspace generates labeled data in 15 shapes, so you can test a chart, a dashboard tile or a sparkline against those cases before the real data source exists. The tool began as the data generator for Chart Guru’s own examples, and the story of porting Swift Charts to Unity puts the reason in one line: “Good chart examples require uncomfortable data.”
What to test a chart against
- Shapes. Steady climbs, curves that accelerate or flatten, plateaus, a single peak, sudden drops.
- Ranges. Values far from zero and values on both sides of it, with a baseline in the middle.
- Several series that cross, which tests overlap, legend order, colors and multi-value tooltips.
- Labels. Short ones such as Q1 2020, long department names, and repeats: 24 points with month labels run from Jan to Dec twice, which catches code that keys categories by label.
- Sparse data. Mostly zeros with a few spikes, which trips up automatic scaling and logarithmic axes.
The 15 patterns
Each pattern spreads values between Minimum and Maximum. For most patterns, Noise adds a random offset of up to that fraction of the range to each point, and every value is clamped to the range at the end, so noisy peaks flatten at the edges instead of leaving it.
| Pattern | What the values do | Good for testing |
|---|---|---|
| Random | Independent values spread evenly across the range; Noise has no effect | Axis auto-range, scatter plots, jumpy lines |
| Linear | A straight line from Minimum to Maximum | Tick spacing, trend lines |
| Exponential | Starts at Minimum and curves upward ever faster, reaching Maximum on the last point | Growth charts, crowded labels near the top |
| Logarithmic | Climbs steeply at first, then flattens toward Maximum | Saturation and adoption curves |
| Sine | One full wave around the midpoint, touching Maximum and Minimum | Smooth joins, zero crossings with a negative range |
| Cosine | One full wave that starts at Maximum and bottoms out halfway | Peaks at the chart edge |
| Trending Up | A jittery climb from Minimum to about 70 percent of the range | KPI tiles, positive deltas |
| Trending Down | A jittery fall from Maximum by about 70 percent of the range | Negative deltas, warning colors |
| Seasonal | Two full cycles around the midpoint on top of a rise of a quarter of the range | Two years of monthly sales, moving averages |
| Stepped | Equal plateaus climbing from Minimum, about three points each | Step lines, threshold bands |
| Sparse | About seven in ten values are zero, the rest random | Gaps, empty bars, log axes |
| Random Walk | Starts at the midpoint, each point moves up to 15 percent of the range from the last | Stock-style lines, crossing series |
| Bell Curve | Rises from near Minimum to Maximum at the center and falls back symmetrically | Distributions, peak labels |
| Sawtooth | Ramps up from Minimum and drops back, about three times per series | Sharp drops, interpolation artifacts |
| Gaussian Noise | Normally distributed values around the midpoint; Noise sets the spread | Histograms, scatter density, noisy sensor lines |
Every series made in one go uses the same pattern, so smooth shapes such as Sine or Linear give near-identical lines that differ only by noise; for lines that cross, use Random Walk or Random. Sparse idles at zero, or at the nearest edge when the range excludes zero.
Generate a series in the Editor
- Open Tools > Mock Magic > Generator and select the Series workspace.
- Choose a Pattern. A one-line description below it summarizes the shape.
- Choose Labels from 17 presets, including months, quarters, weekdays, regions, departments, countries and cities. Custom shows a text field for your own labels, separated by commas or line breaks; they repeat when there are more points than labels.
- Set Points (3 to 1,000), Series count (1 to 10), Minimum, Maximum and Noise (0 to 0.5).
- Click Generate Series. The Preview draws every series scaled to the generated values and labels the lowest and highest value plus the first and last point label.
To test a baseline in the middle of the plot, set Minimum to -50 and Maximum to 50:
 A range from -50 to 50: the preview adds a zero line as soon as the data crosses it.
Without Unity at hand, the free chart data generator runs the same 15 pattern formulas in your browser and exports the same CSV, JSON, text and C# formats.
Generate series in code
MockSeries builds the same data at runtime or in Editor scripts. GenerateMultiSeries returns one array per series, and Generate returns a single series with optional custom labels:
using MockMagic;using UnityEngine;
public class SalesChartData : MonoBehaviour{    void Start()    {        // Three random walks over 24 months that cross zero.        MockDataPoint[][] regions = MockSeries.GenerateMultiSeries(            SeriesPattern.RandomWalk,            seriesCount: 3,            pointCount: 24,            min: -50f,            max: 50f,            noise: 0.1f,            labelPreset: LabelPreset.MonthsShort,            seriesNames: new[] { "North", "South", "West" });
        // One seasonal series whose four custom labels repeat.        MockDataPoint[] visitors = MockSeries.Generate(            SeriesPattern.Seasonal,            count: 8,            min: 1000f,            max: 5000f,            labelPreset: LabelPreset.Custom,            customLabels: new[] { "Spring", "Summer", "Autumn", "Winter" });
        foreach (MockDataPoint point in regions[0])            Debug.Log($"{point.SeriesName} [{point.SeriesIndex}] {point.Label}: {point.Value:F1}");
        Debug.Log(MockExport.ToJson(visitors));    }}
Each MockDataPoint carries a Label, a float Value, a SecondaryValue that generated data leaves at 0, the zero-based SeriesIndex and a SeriesName. Multi-series data without names gets Series 1, Series 2 and so on.
For a different shape per series, call Generate once per series and pass seriesIndex and seriesName yourself, for example a Seasonal series named Revenue next to a Trending Up series named Costs. Shortcuts such as MockSeries.Seasonal(24) and MockSeries.BellCurve(20) need fewer arguments; Seasonal uses month labels by default.
Export the data
Export… in the Series workspace shows the result as C# Code, CSV, JSON or Text, with Copy and Save to File…. The same formats are one call away in code through MockExport:
- C# Code writes one label array and one float array per series, named after the C# variable field; Save to File… wraps them in a static class named after the file, so the file compiles on its own.
- CSV has the columns
Label,Value,SecondaryValue,SeriesIndexandSeriesNameand repeats the series on every row. - JSON lists a single series as an array of points and groups several series under their names.
Every format writes numbers with a period as the decimal separator, so files read back the same on every machine. Save a CSV or JSON file under your project’s Assets folder and Unity imports it as a TextAsset that a chart can read. The export guide shows each format in full.
Feed a chart directly
Chart Guru includes Mock Magic, and its Mock Chart Data Source component fills a chart with generated series or a live stream without an export step, as the Chart Guru integration page explains. To load exported files instead, see CSV, JSON and Google Sheets data; for dashboards of small charts, see sparklines and KPI tiles.
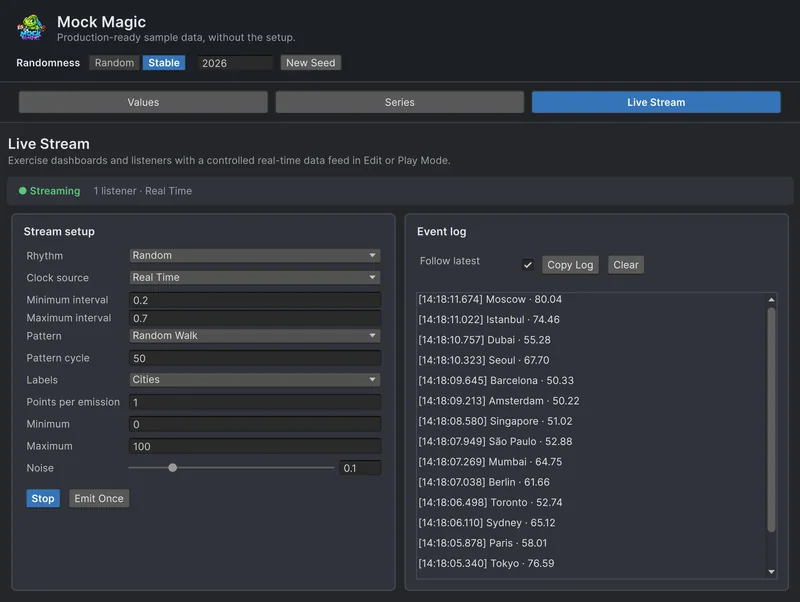
Charts that update while you watch need data that arrives over time, from a stream that continues the same patterns across emissions; see simulating live data without a backend.
Frequently asked questions
How do I get sample data for a chart in Unity?
Open Tools > Mock Magic > Generator, select the Series workspace, pick a pattern, labels and a range, and click Generate Series. In code, MockSeries.Generate returns an array of labeled MockDataPoint values.
Can the generated series include negative values?
Yes. Set Minimum below zero, for example -50 with a Maximum of 50. Every value stays inside the range, and the preview draws a zero line when the data crosses it.
How many series and points can I generate?
The Generator makes 1 to 10 series with 3 to 1,000 points each. In code, MockSeries.GenerateMultiSeries takes whatever series and point counts you pass.
Which formats can I export series to?
C# Code, CSV, JSON and Text. CSV repeats the series index and name on every row, which makes it the easiest format to load back into a multi-series chart.
Realistic fake data for Unity, from one value to a live stream.
Keep reading
 Use case
Simulate live data in Unity without a backend
Build the live parts of a UI before the server exists. Mock Magic sends labeled values that continue their pattern to your listeners on a schedule you choose, in Edit Mode or Play Mode, so bursts, gaps and pauses show up early.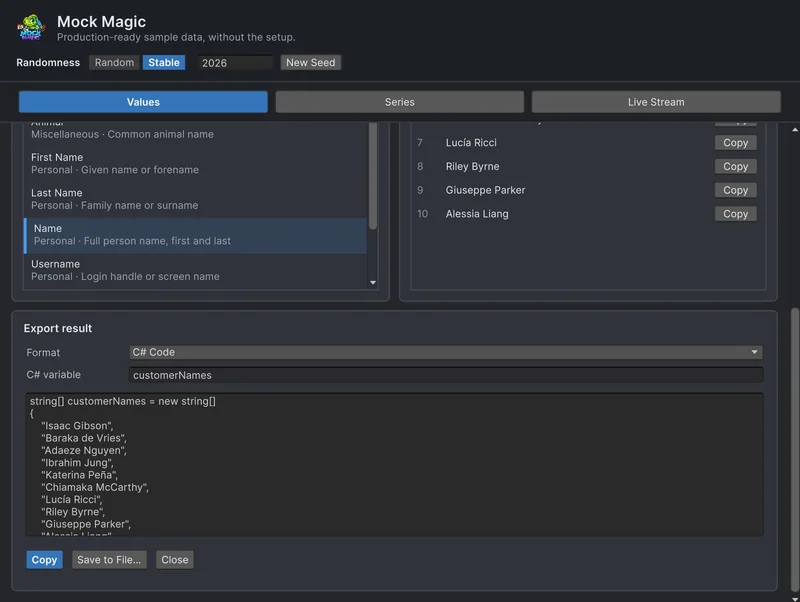 Use case