Charts for digital twins, HMIs and control rooms in Unity
Add trend lines with limits, alarm and shift timelines, KPI sparklines and live data to Unity digital twins and HMIs with Chart Guru, fed by your MQTT or OPC UA client.
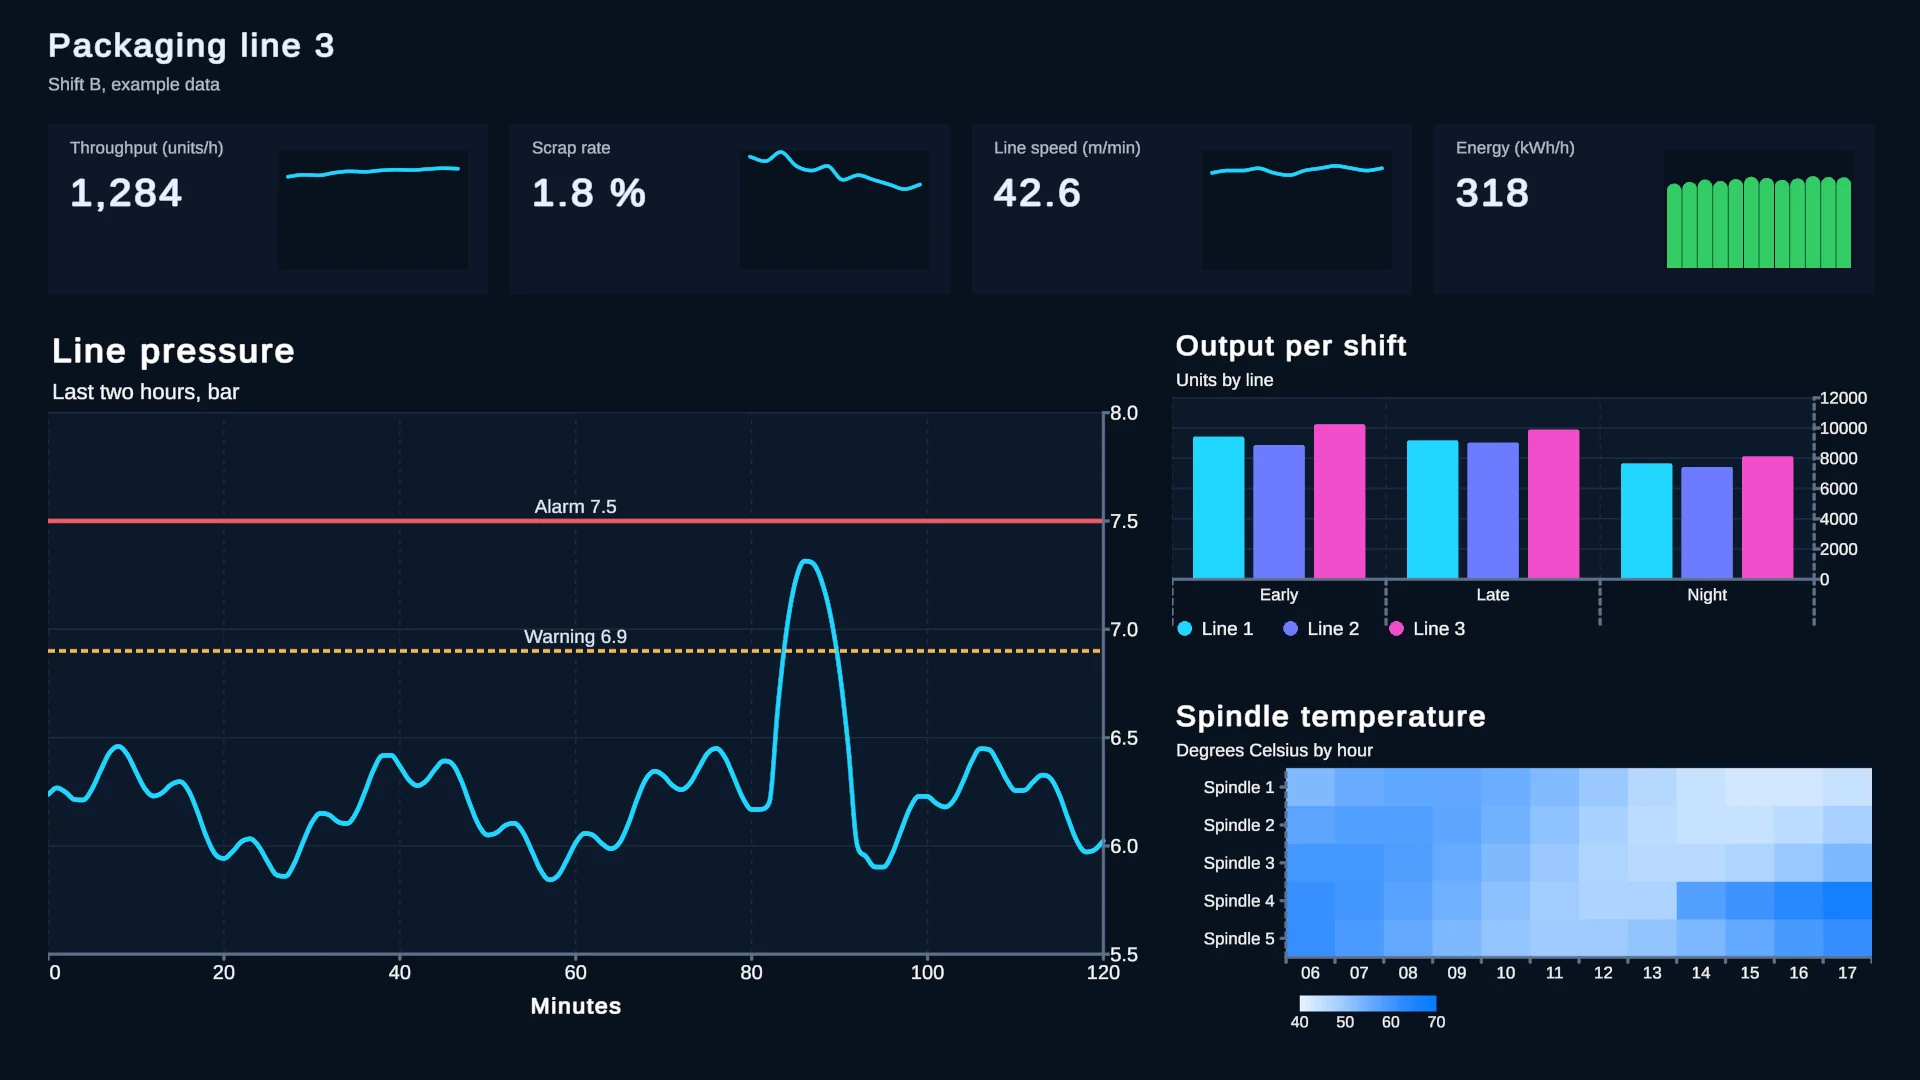
A digital twin or an HMI screen has two jobs: show what a machine is doing now, and show how it got there. Live values cover the first job. The second needs charts: a temperature trend against its limit, the hour an alarm fired, the shift that ran short, the zone that runs hot every afternoon. Chart Guru draws those charts inside Unity UI, on a Canvas, in UI Toolkit or in world space, and keeps them current from live sources, which is what real-time data visualization in Unity usually comes down to.
What Unity’s own industrial samples leave out
Unity’s 2025 and 2026 industry material shows how much of a twin or HMI is live values and status, and how little is history:
- The Unity Industry Fundamentals guide (May 2026) builds a warehouse robot dashboard that binds battery, health, temperature and speed to the UI, styles status with USS classes and adds fleet totals and a minimap. It draws no charts.
- The HMI template for embedded systems (October 2026) has an instrument cluster, an ADAS view and climate controls fed by a live traffic simulation. It has no charts either.
- The free IoT Sample Project on the Asset Store (August 2025, URP) mentions no charts in its description.
Industry sources describe the missing part. A Control Design article from April 2025 describes control-room twins in Unity that pull trends from time-series databases such as InfluxDB through MQTT, OPC UA or Ethernet/IP and show KPIs such as OEE, and Unity’s 2026 industry trends post points to HMIs that show faults on 3D machines. (Sources checked 2026-11-11.)
What twin and HMI screens need
| Screen element | What Chart Guru draws |
|---|---|
| Trend against a limit | Line or area chart with rule marks for limits and targets, captions on the rules, and marks colored by a status column |
| Alarm and shift timelines | Range bars on a time or numeric axis, one row per line, station or alarm source |
| KPI tiles | Sparkline, MiniBar, MiniPie, MiniDonut and Indicator: compact types without axes or padding |
| Zones or hours | Heat maps with viridis, magma, plasma, inferno, cividis or turbo color scales; missing cells stay empty |
| Live values | A ring buffer pushed from any thread, polled HTTP endpoints, or your own data source |
| Incident review | Hover tooltips that pin on tap, X brushes over a time range, zoom, scrolling through history and linked selection across charts |
| Charts on the machine | 2D charts on a world-space Canvas, or lit 3D charts from the included Chart Guru 3D module |
| Reports | PNG images plus semantic CSV or JSON of each chart |
 A threshold rule with values colored by status. The same pattern fits spindle temperature, cycle time or line pressure.
Rule marks are the tool for limits: RuleMark.Horizontal on a chart built in code, or a rule layer with a caption in the chart Inspector. Coloring above or below a limit comes from your data: add a status column and bind the layer’s Color channel to it, so the colors always agree with what the controller reports. Timestamps without a time zone are read as UTC, so convert plant-local times or label them.
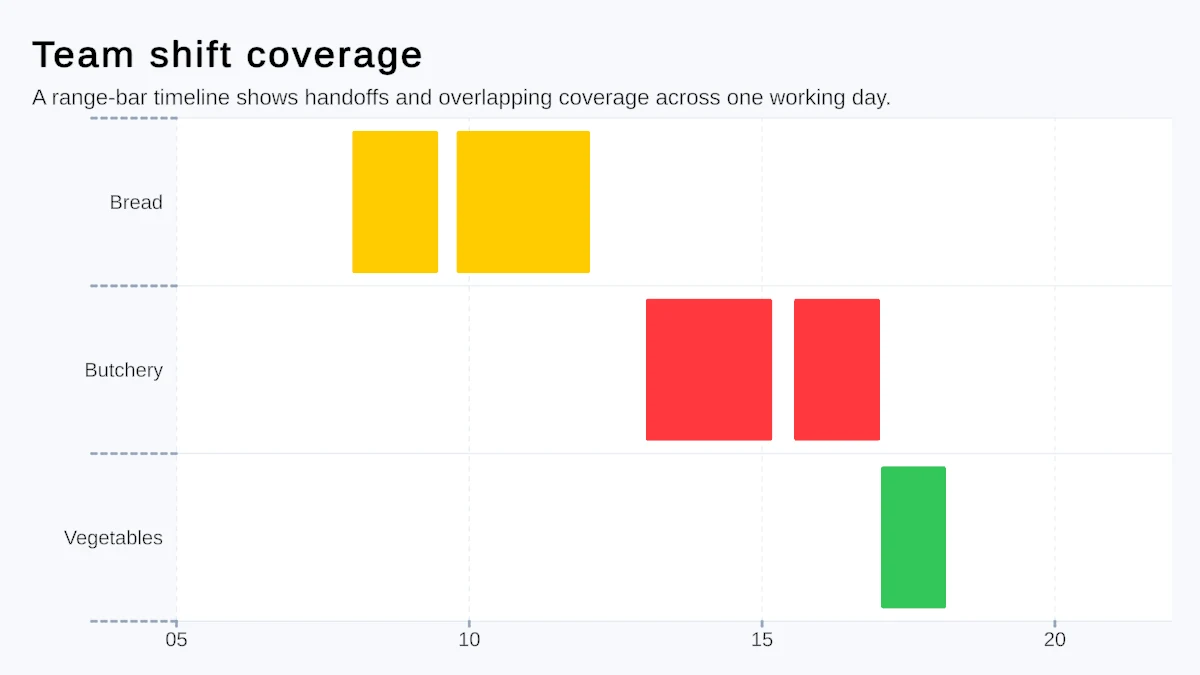 A range-bar timeline. Rows can be production lines, stations or alarm sources, and bars their runs, shifts or alarm windows.
A row of sparklines and indicators fits under each machine name in a digital twin dashboard; sparklines and KPI charts shows those layouts, and the chart types page lists every type with its best use.
Feeding charts from MQTT, OPC UA or HTTP
Chart Guru does not ship an MQTT or OPC UA client. Use the client library your plant already trusts and hand its values to a chart in one of three ways.
Push samples into a ring buffer. RingBufferChartDataSource keeps a fixed number of samples and drops the oldest first, accepts pushes from any thread in constant time, publishes at most once per frame and, once full, updates its frame in place without allocating. That makes it a direct target for a client callback that runs on a network thread:
using ChartGuru;using UnityEngine;
public sealed class SpindleTemperatureFeed : MonoBehaviour{    [SerializeField] private ChartGraphic _trend;    private RingBufferChartDataSource _samples;
    private void Awake()    {        _samples = _trend.gameObject.AddComponent<RingBufferChartDataSource>();        _samples.Capacity = 600;        _samples.SeriesName = "Spindle temperature";    }
    // Call this from your MQTT or OPC UA client's message handler, on any thread.    public void OnSample(float celsius) => _samples.Push(celsius);}
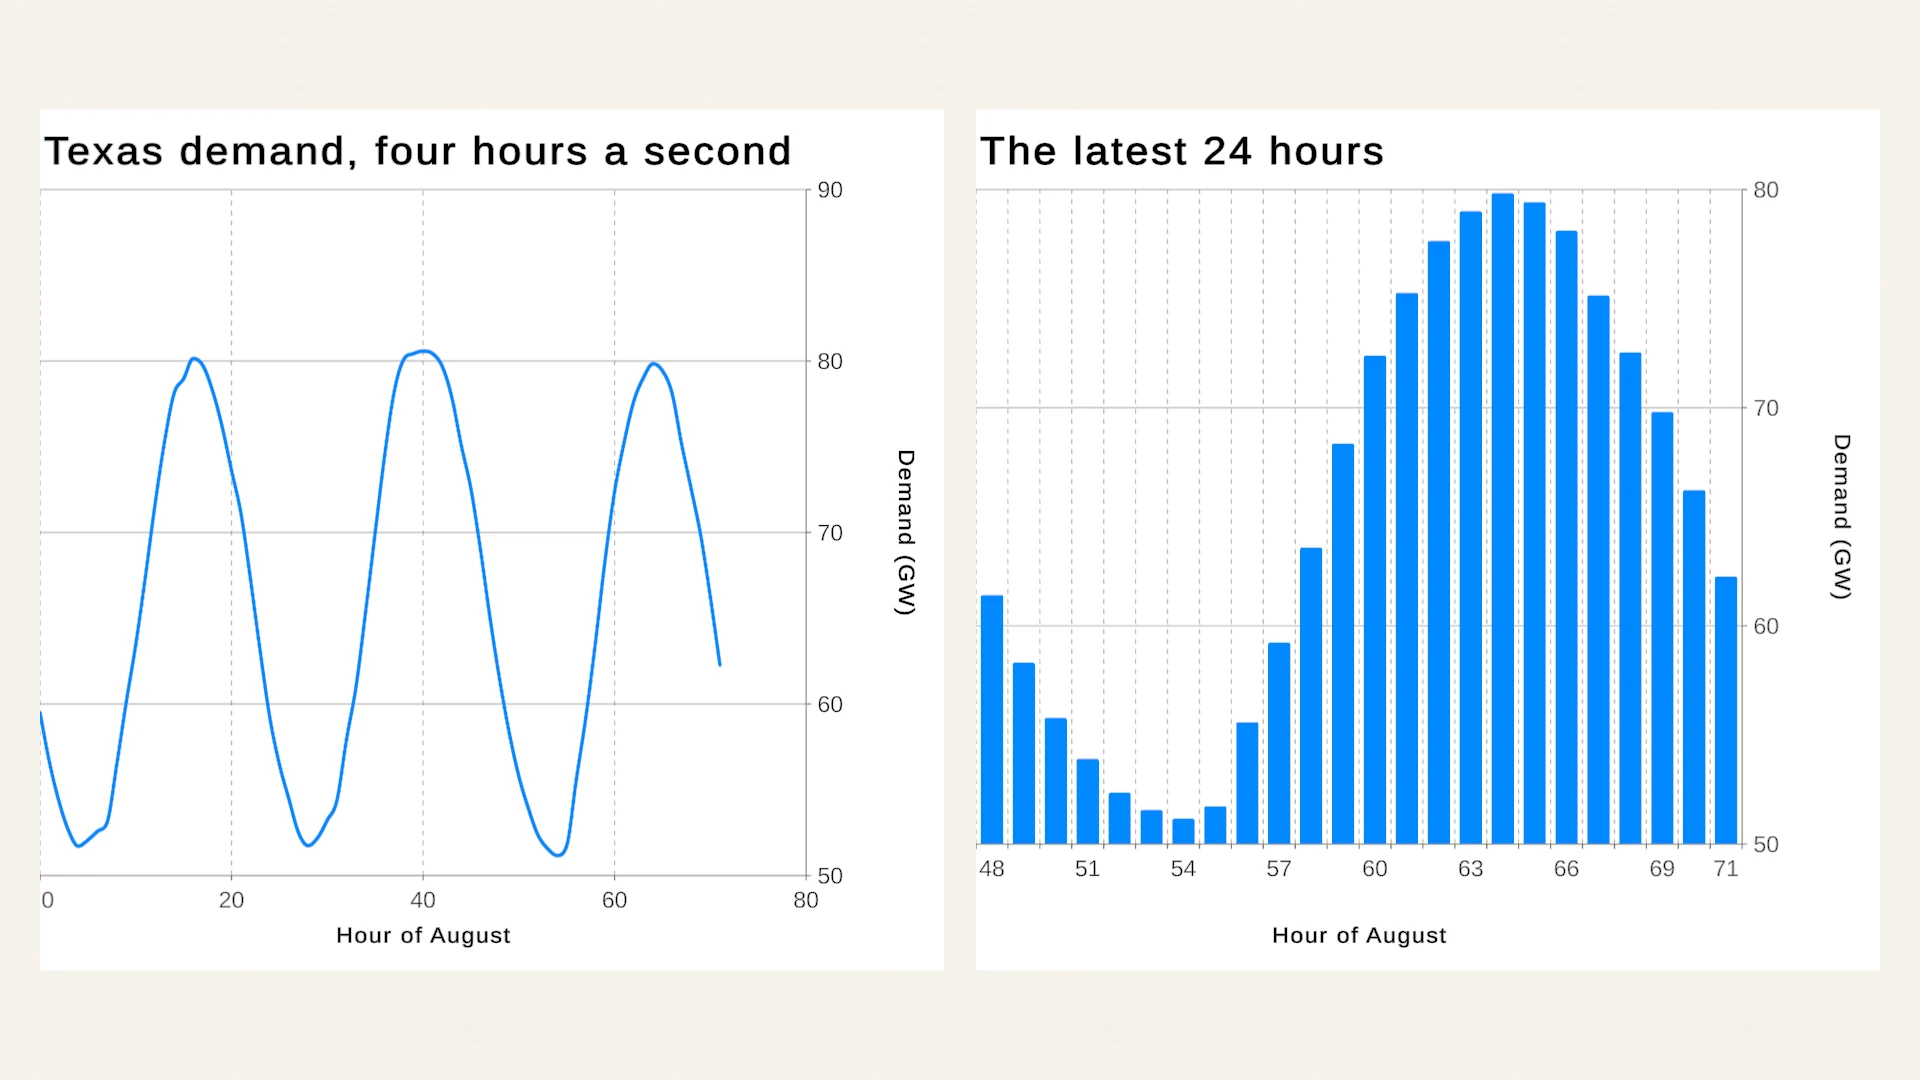
The chart on the same GameObject picks the source up automatically. Without an X value it plots samples by index; Push(x, y) adds an explicit X column. The Live Data lesson replays the 744 hours of August 2024 ERCOT grid demand, from EIA data, into ring buffer sources.
Write a data source. For a whole machine record, derive from ChartDataSource, build a ChartDataFrame in Refresh and call Publish. When the shape stays fixed, OverwriteValues plus one PublishValueChange updates marks in place. Publishing happens on the Unity thread, so queue messages from the client’s thread and publish them in Update. A source on a parent object feeds every chart below it that has no data of its own, so one source on a machine panel can drive its trend, timeline and KPI tiles.
Poll HTTP. If a historian or gateway serves CSV or JSON over HTTP, WebChartDataSource polls it with headers, cancellation and backoff, and a late response never replaces newer data. Credentials set at runtime with SetRuntimeHeader are not saved with the scene.
Before the real feed exists, the mock data source, which uses the bundled Mock Magic, streams test data with constant, random, burst or drip rhythms, so the screens can be designed first. The data sources documentation covers every source, and real-time graphs in Unity goes deeper into streaming.
Dark themes for control rooms
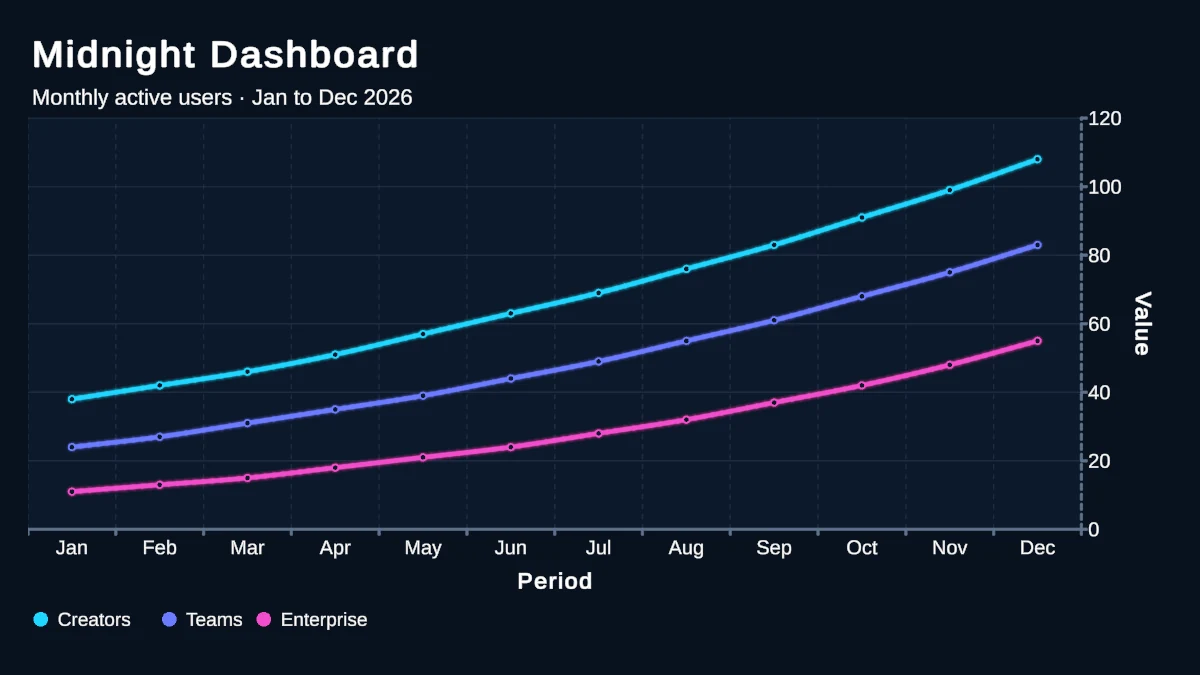 A dark dashboard style. A theme carries palette, typography, axes, grid, backgrounds and glow.
Control rooms and dimmed operator stations usually want dark screens. ChartTheme is a ScriptableObject for palette, typography, axes, grid, backgrounds, plot styling, shadows and glow. ChartTheme.Dark ships with the package, and your own theme asset can carry the plant’s colors and one TextMeshPro font for Canvas and world-space charts. Pin series colors to keys, so the line, the sparkline and the timeline of one machine share a color. See the styling documentation.
Charts also go into UI Toolkit: a ChartGuruElement sits in the same UXML as the rest of an HMI, works in UI Builder, and on Unity 6 its Data property is a data binding target. See UI Toolkit charts.
Accessibility and shift reports
Each chart can describe itself with an accessibility label, a summary from GetAccessibilitySummary() and a descriptor of its visible marks and series. On Unity 6 a bridge adds those descriptions to Unity’s native accessibility hierarchy, and an audio graph plays a chart as sound next to its text. Do not let color carry meaning alone: a rule caption or a status label beside the color keeps the message for every operator. More in accessible charts in Unity.
For reports, ChartDataExporter writes a chart’s marks and their meaning as CSV or JSON, and a Canvas chart saves a PNG with or without its text through SaveOutputPng. PNG export reads back from the GPU, so run it from an explicit action such as an end-of-shift button.
Charts on the machine
GameObject > Chart Guru > World Space Chart places a 2D chart on its own world-space Canvas, so a trend can hang next to the pump it describes, with tooltips and pointer input that need no colliders. The included Chart Guru 3D module draws lit 3D charts in the scene, and Convert to 3D Chart on the Output tab lifts a world-space chart into 3D. Charts in VR, AR and world space covers placement and XR rendering.
Limits to plan around
- No industrial protocol client is included. MQTT, OPC UA and similar feeds need your own client code, as shown above.
- Plan how much history is on screen. Keep a bounded window with the ring buffer’s capacity, a file source’s Max Rows or a visible domain with scrolling, rather than drawing months of one-second samples at once.
- The manual makes no per-platform statement beyond Unity 2022.3 or newer with the Built-in Render Pipeline, URP or HDRP. If the HMI runs on embedded hardware, test the charts on the target device early.
The Chart Guru product page shows the chart types and the gallery. Chart Guru is available on the Unity Asset Store, with the 3D module and Mock Magic included.
Frequently asked questions
Does Chart Guru include an MQTT or OPC UA client?
No. Use the client library you already trust and hand its values to a chart: push them into a RingBufferChartDataSource, which accepts pushes from any thread, or write a small ChartDataSource that publishes frames on the Unity thread. HTTP endpoints that serve CSV or JSON work directly with WebChartDataSource.
Can operators export charts for shift reports?
Yes. ChartDataExporter writes what a chart shows as CSV or JSON, and Canvas charts save PNG images with or without their titles, axes and legends through SaveOutputPng. Trigger exports from an explicit action, because PNG export reads back from the GPU.
Does it work with UI Toolkit HMIs and Unity 6 data binding?
Yes. ChartGuruElement goes into UXML and UI Builder, a UI Toolkit Chart Binder connects scene data sources to it, and on Unity 6 its Data property is a data binding target. Canvas and world-space charts use the same chart definitions and themes.
Easy, reliable charts for Unity, from sparklines to multi-series 3D.
Keep reading
 Use case
Real-time graphs for live and high-volume data in Unity
Chart Guru streams live values into Unity charts through a fixed-capacity ring buffer you can push from any thread, web sources that poll with backoff, and your own adapters. Stable updates are tested to allocate nothing after warm-up.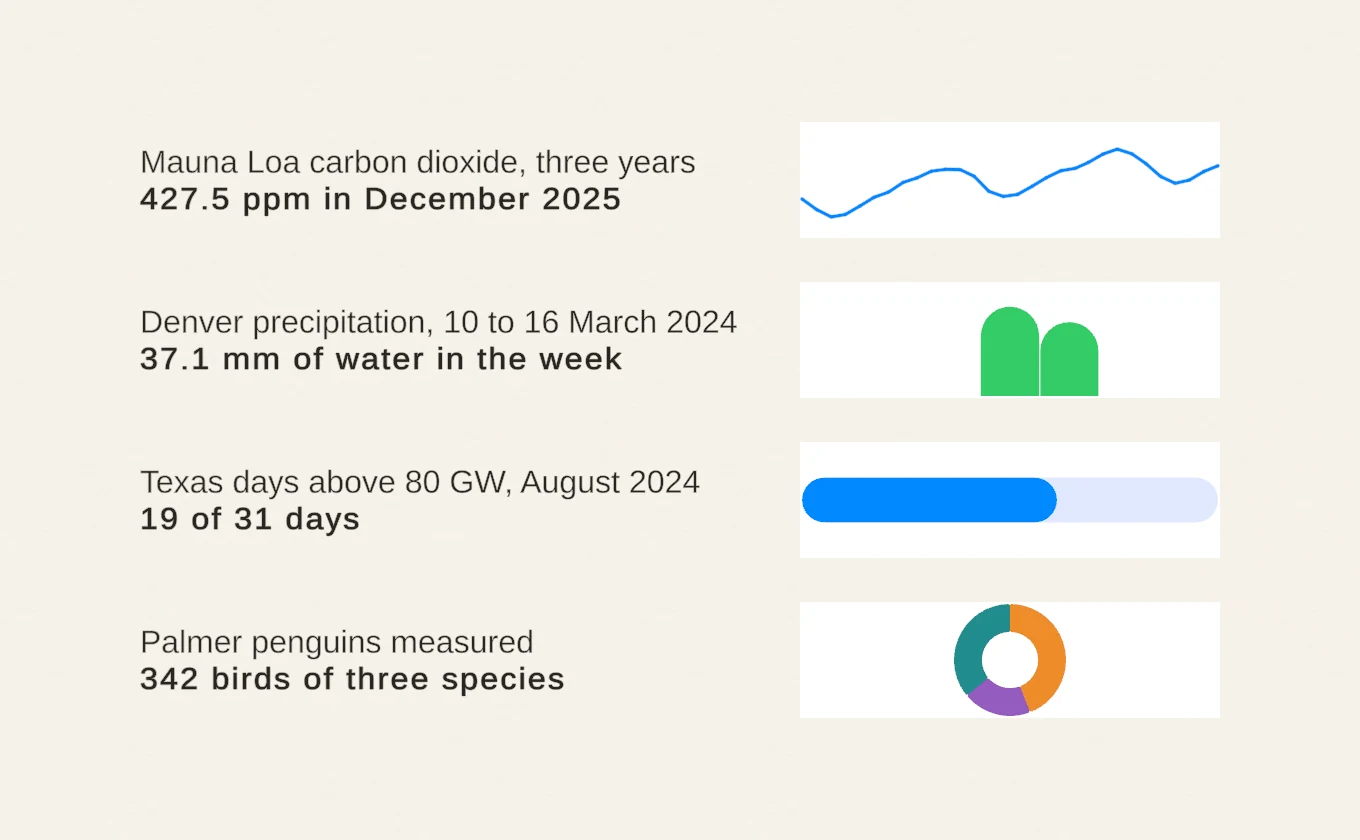 Use case
Sparklines and KPI charts for compact UI
Chart Guru's compact chart types for Unity drop axes and padding, so a trend, a split or a progress value fits into a table cell, a HUD or a KPI card. They share the API, data sources and live updates with full charts.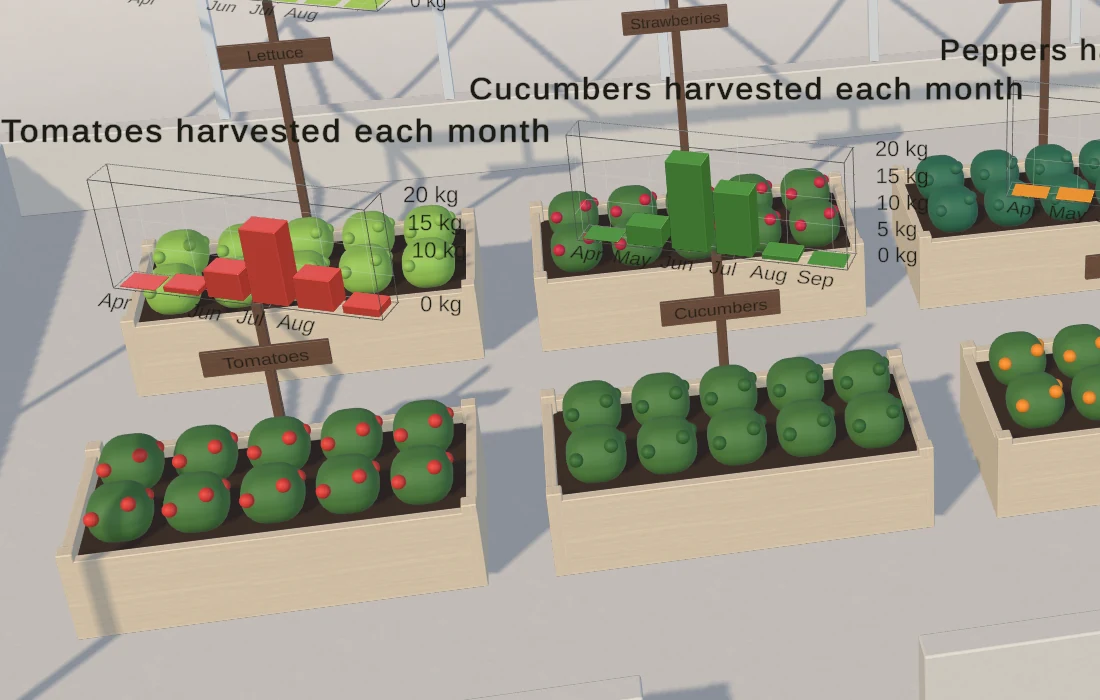 Use case