Stats screens and match summaries for games
Build match summary and progression stats screens in Unity with Chart Guru: an advantage graph linked to move times, radar profiles, HUD sparklines and animated reveals.
A results screen with a column of numbers says who won. Charts show how: when the lead changed, where the time went, which skills carried the match. Searches for Unity stats screens mostly turn up score text tutorials and backend statistics services, and screens with real graphs are rare. Chart Guru draws those graphs in Unity UI, with hover, selection and motion, from data your game already records.
The Match Summary example
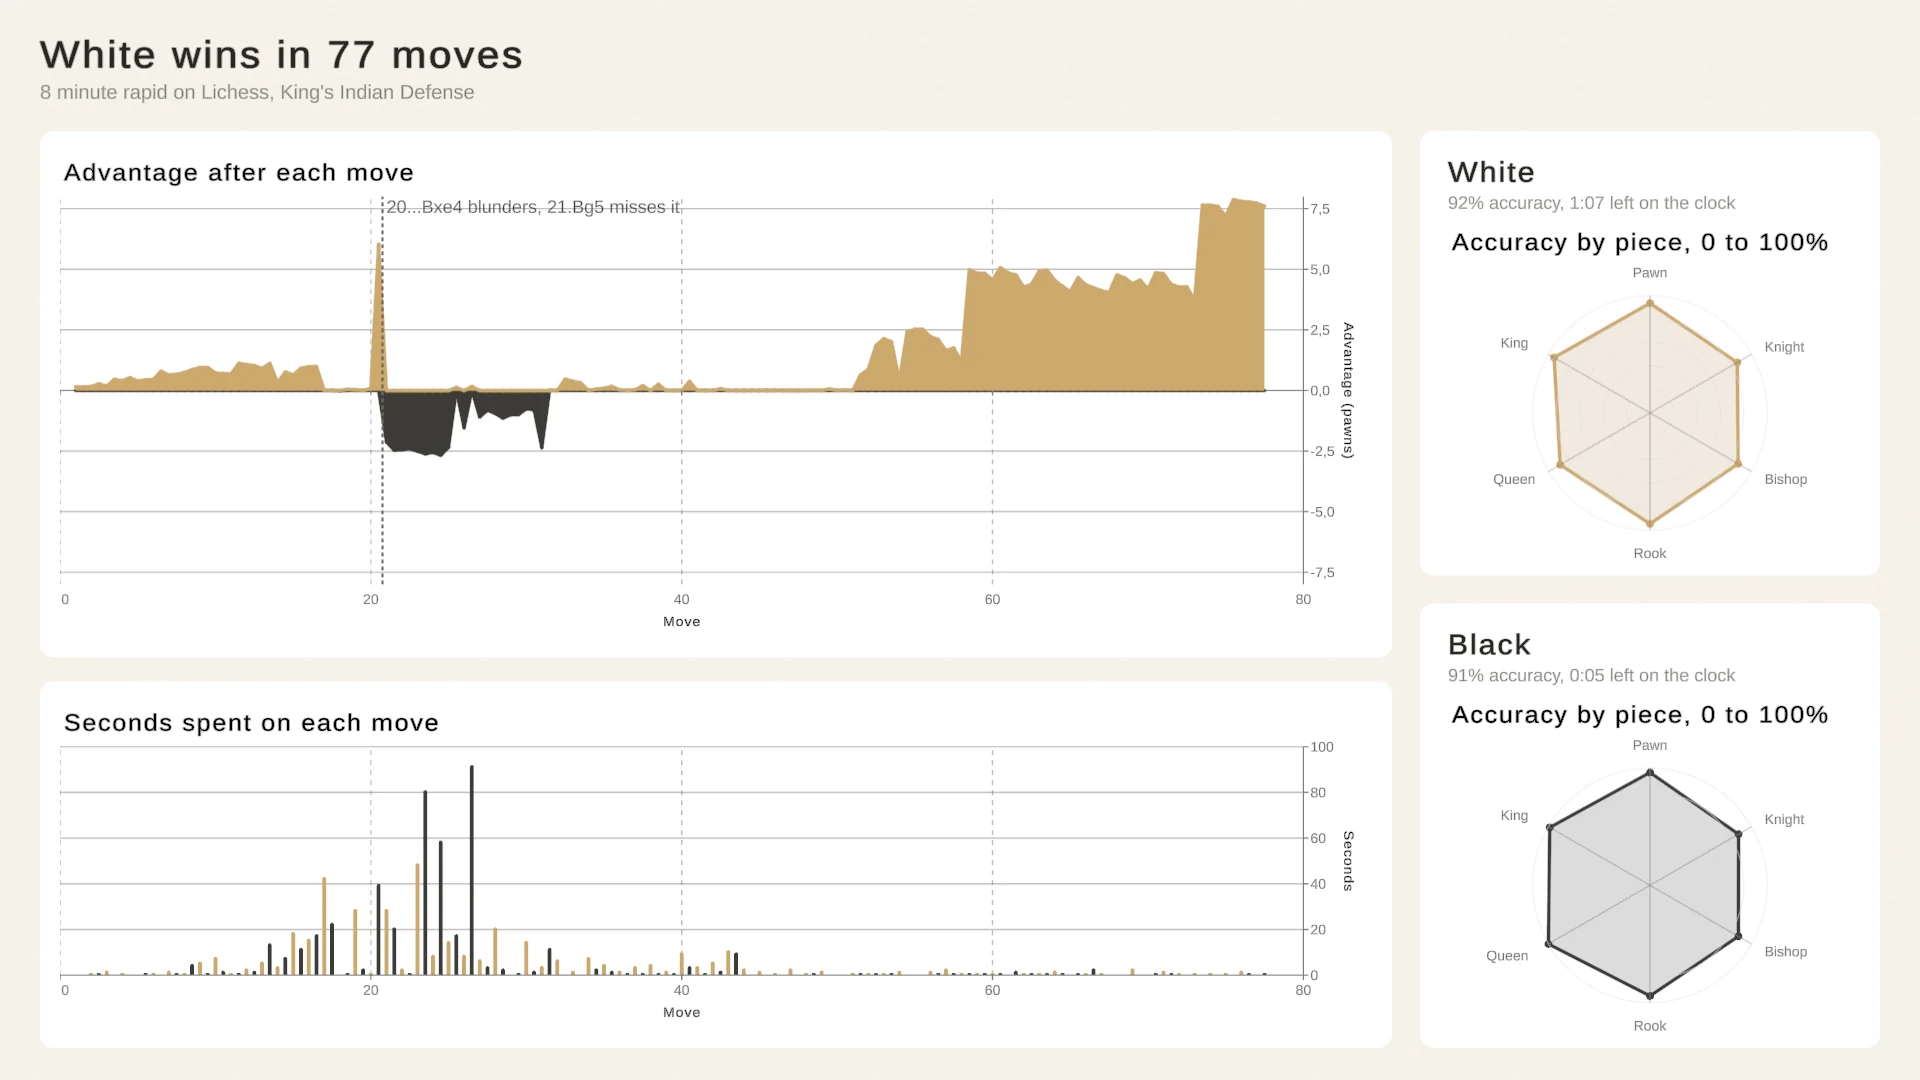
The Match Summary in Examples/05_ProductionExamples is a complete end-of-match screen built on a real game: a rated 8 minute rapid game from Lichess, a King’s Indian Defense played on 6 October 2026, which White won in 77 moves after both sides blundered at move 20. The data holds all 154 half-moves with their notation, the piece moved, Stockfish’s evaluation after the move, its accuracy and the mover’s clock. Lichess publishes it under CC0, and the players appear only by color.
The screen has four parts:
- A result header with the outcome, the time control and the opening.
- A card for each player with accuracy, time left on the clock and a radar of accuracy by piece, 0 to 100%.
- An area chart of the advantage after each move, in pawns from White’s side.
- A bar chart of the seconds spent on each move.
Hover a move on the advantage graph and the bar for the seconds spent on it lights up; hover a bar and the graph shows its move. A short script in the sample, MoveLink, listens to each chart’s hover and hovers the same move in the others, and it keeps working when the charts rebuild after a data change. The layout script stacks the player cards in a column at the right on a wide screen and puts them side by side under the result on a tall one.
Progression and economy over a season
Between matches, the story is progress. Line charts show rating, level or win rate over time, with time axes and date bins for real calendars. Bars compare results per map, mode or character, and histograms show the spread of match lengths or damage numbers. Stacked areas show where income comes from, which is how an economy screen explains a player’s gold or a designer’s tuning pass.
 Stacked areas show the total and each source’s share, whether the sources are subscriptions or quest rewards, trading and loot.
Your game already has the record, so hand it to a chart you set up in the Inspector:
// minutes and goldLead are float arrays from this match's record.ChartDataFrame frame = new ChartDataFrame( ChartDataColumns.Numeric("Minute", minutes), ChartDataColumns.Numeric("Gold lead", goldLead));_goldLeadChart.SetData(frame);A first number column that only rises becomes the X axis, so this draws the gold lead by minute. Runtime data from SetData is not saved with the scene and outranks the chart’s saved table. Trading and market games can go further with candlesticks and live prices, covered in trading and finance charts.
Profiles with radar charts
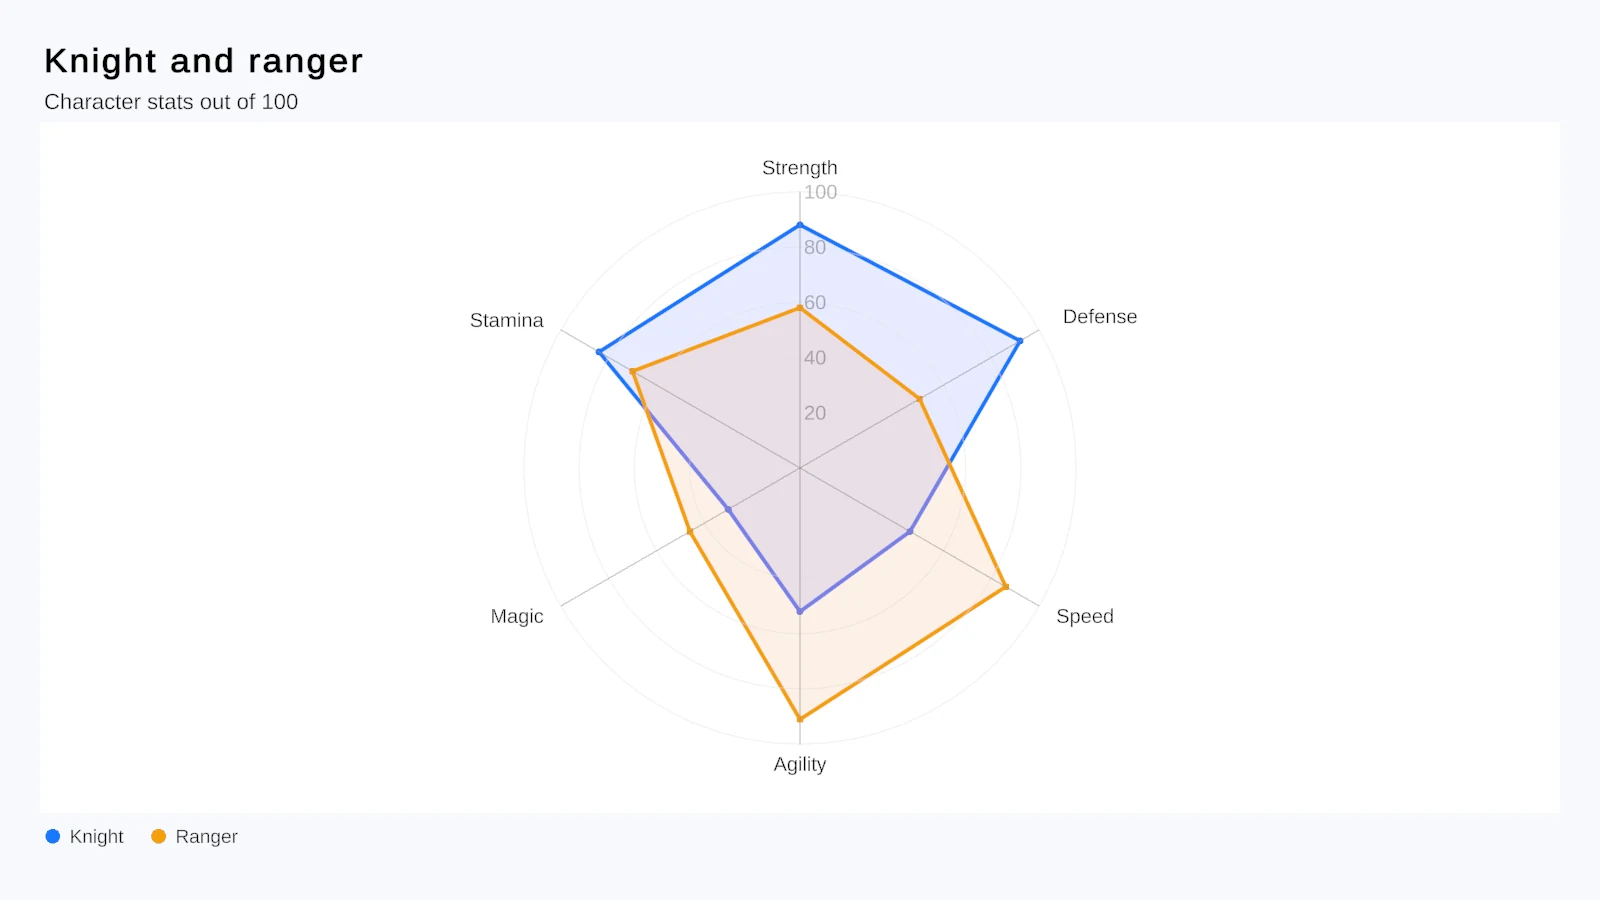 A radar chart comparing two characters’ stats.
Radar charts give a character, a build or a team a shape players recognize quickly. Chart Guru’s radar starts at 12 o’clock, labels every spoke, compares several series and accepts explicit ranges such as 50 to 100. The Match Summary uses one per player for accuracy by piece. Radar charts for character and item stats covers them in detail.
Compact charts in the HUD
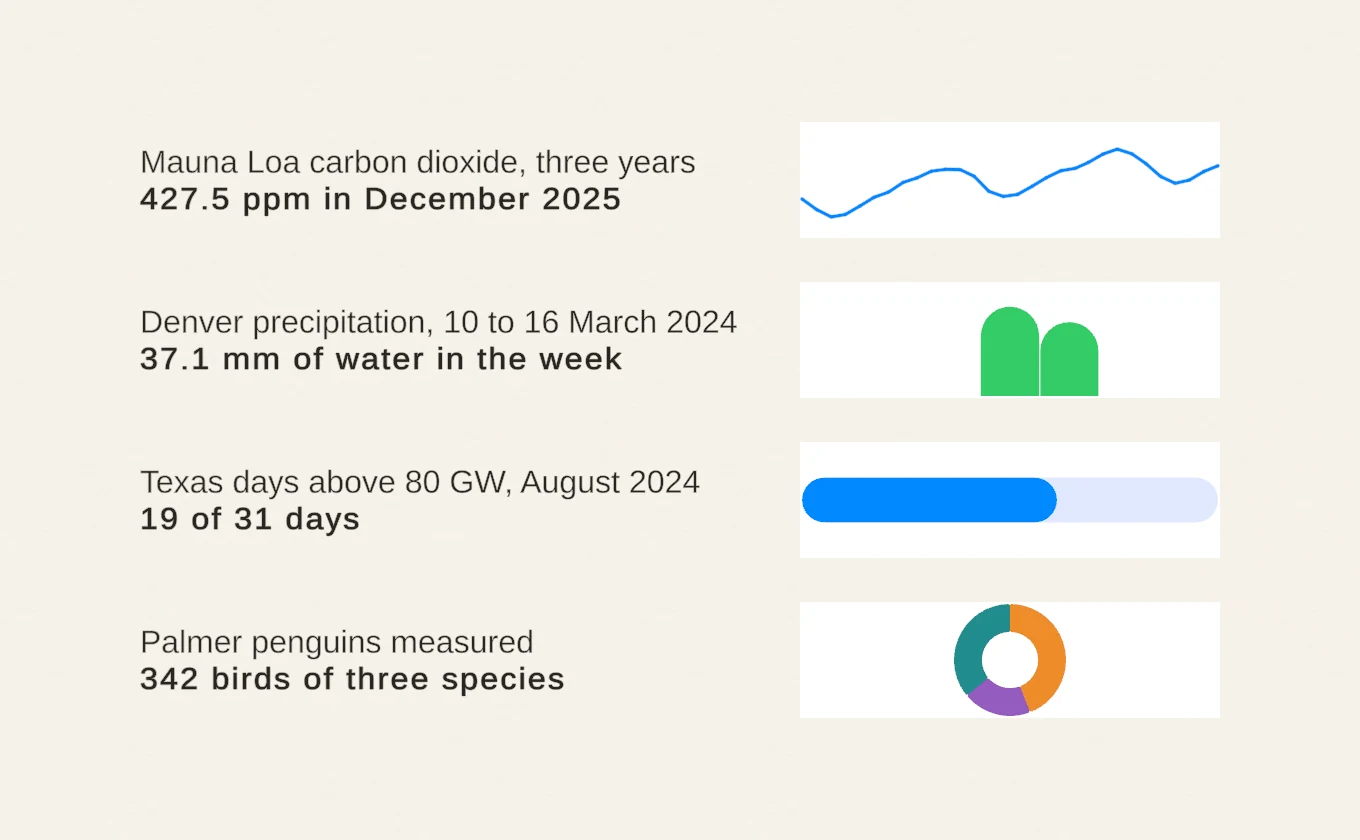 The Compact Charts lesson: sparklines, mini bars, mini donuts and indicators without axes.
Not every chart needs axes. Sparkline, MiniBar, MiniPie, MiniDonut and Indicator hide axes and reduce padding, so they fit a HUD corner, a scoreboard row or a party frame: a health trend, damage per round, objective progress. Fed from a RingBufferChartDataSource, a sparkline takes one push per frame and stops allocating once its buffer is full. Sparklines and KPI charts shows more layouts.
Reveal results with motion
A results screen is a reveal. Entry animations bring marks in from a baseline when a chart appears, and ReplayEntryAnimation() on the host plays the entrance again when the screen opens. Data changes use the same transition system: marks keep their identity by series and category, so a player’s bar moves to its new value instead of jumping, and a change during a running animation continues from what is on screen. MorphTo switches chart types with a CrossFade, Scale or Semantic morph, for example from damage per round as bars to share of damage as a pie. For players who prefer reduced motion, disable the chart’s animation and the same calls switch at once. Details are in the interaction and animation documentation.
Tooltips and linked selection
Hover shows a tooltip next to the active mark, and the HoverAndPin mode pins it on tap, which matters on touch screens. Tooltip content can be customized in code, and an event mirrors the current tooltip into your own UI panel. Selection highlights a mark or a whole X value, presented as a highlight, rule, lollipop or background band, and the host raises events such as OnDataPointSelected so a tap can open details. ChartSelectionLink coordinates selection across charts: in the Selection and Tooltips lesson, selecting a day in one chart selects it in the other.
Phone layouts, fonts and themes
Stats screens often ship on phones. Besides the Match Summary’s wide and tall layouts, the Phone Health App example is a portrait UI Toolkit screen over a month of a Fitbit wearer’s days, meant for a 1080 by 1920 Game view: tap a bar of the week’s steps to see that day’s rings, sleep and heart rate. Charts live in Canvas or UI Toolkit layouts, so they follow the layout rules the rest of your UI uses.
A ChartTheme asset sets palette, typography, axes, grid, backgrounds, plot styling, shadows and glow, and its Font Asset can be your game’s TextMeshPro font for titles, axes, legends and labels on Canvas and world-space charts. Each production example ships its own theme asset; the Match Summary’s sits in its Charts folder. See styling, layout and labels.
Things to know
- MoveLink is sample code for linked hover, not a packaged component;
ChartSelectionLinkis the packaged way to link selection. - The manual makes no per-platform statements, so test stats screens on the phones and consoles you ship to.
- Build a chart when the screen opens or its data changes, not every frame in
Update; values that change every frame belong in a ring buffer.
The Chart Guru product page shows the chart types, and the Match Summary, Phone Health App and Data Explorer come with the package on the Unity Asset Store.
Frequently asked questions
Can Chart Guru link two charts so hovering one highlights the other?
Yes. The Match Summary example does it with MoveLink, a short sample script that follows each chart's hover and hovers the same move in the others. For selection, the packaged ChartSelectionLink matches marks across charts by series and X value, stable identity, category or index.
Do the charts fit portrait phone screens?
The examples are built for them: the Match Summary moves its player cards under the result on tall screens, and the Phone Health App is a portrait UI Toolkit screen. The manual does not list results per platform, so test on the phones you ship to.
Can the charts use my game's font?
Yes. A ChartTheme's Font Asset takes a TextMeshPro font for titles, axes, legends and data labels on Canvas and world-space charts, and the theme has a separate color override for the chart title.
Easy, reliable charts for Unity, from sparklines to multi-series 3D.
Keep reading
Use caseRadar charts for character and item stats
A radar chart, also called a spider chart, shows a stat profile at a glance. Chart Guru's Radar type draws rings and labeled spokes from 12 o'clock, compares several characters, animates stat changes and has a 3D form.Use caseSparklines and KPI charts for compact UI
Chart Guru's compact chart types for Unity drop axes and padding, so a trend, a split or a progress value fits into a table cell, a HUD or a KPI card. They share the API, data sources and live updates with full charts. Use case