Radar charts for character and item stats
Show character and item stats as radar charts in Unity with Chart Guru: labeled spokes, rings, explicit ranges such as 50 to 100, several characters, animation and Radar3D.
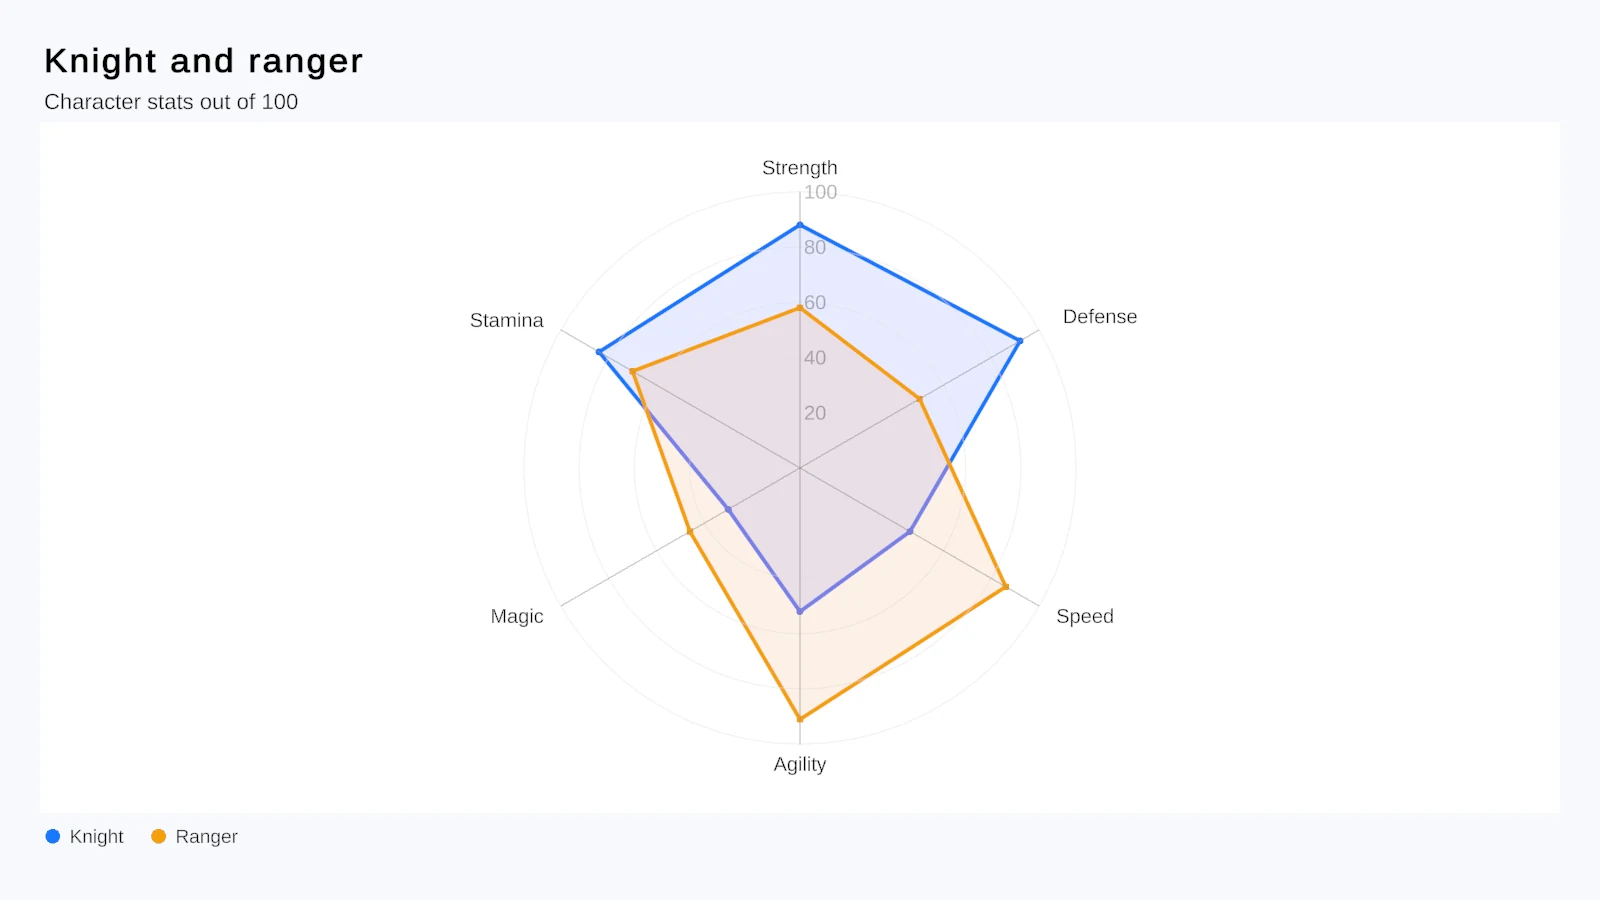
Strength, agility, magic, defense, speed: five numbers in a list are slow to compare, five spokes of a radar chart are not. A radar chart, also called a spider chart, gives each stat a spoke and joins the values into a shape, so a tank, a glass cannon and an all-rounder look different before anyone reads a number. RPG character screens, item comparisons, scouting reports and sports games use them for that reason.
Chart Guru has a Radar chart type next to its other 2D types, with the same data sources, themes, tooltips and animation as the rest of the package.
How the radar is drawn
- Spokes from 12 o’clock. The first stat points straight up and the others follow clockwise in data order.
- A label on every spoke. Stat names sit just outside the outer ring, clear of the values.
- Rings with values. Concentric rings mark the scale, drawn as circles (Round) or as polygons that connect the spoke tips (Straight).
- A sensible default range. Without an explicit range the center is zero and the outer ring rounds up to a clean value above the largest stat, so the shape never grazes the edge.
- Explicit ranges. Give the Y axis a minimum and maximum and the radar keeps both ends: a 50 to 100 range puts 50 at the center, which spreads out stats that all sit in the upper half. Values below the minimum stay at the center, and values above the maximum reach past the outer ring.
- Points, fill and lines. Vertex points, fill opacity and line width can be adjusted.
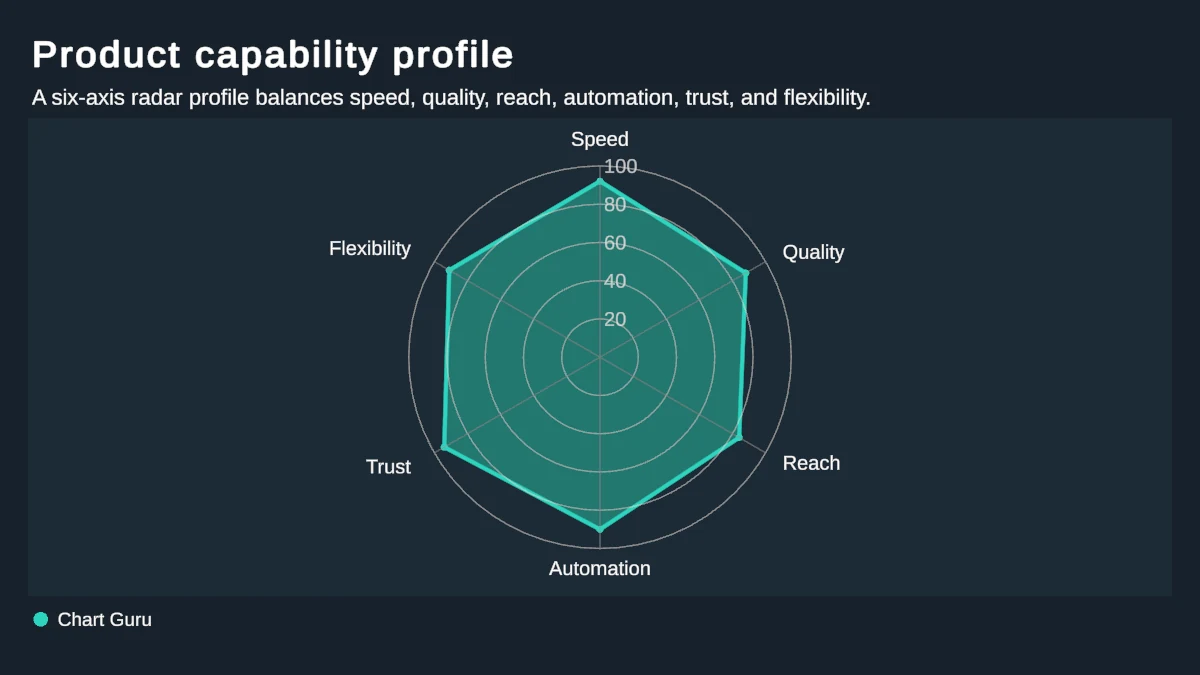 One series on round rings. The first spoke points up and the others follow clockwise.
Compare several characters
Each series draws its own shape on the same spokes, with its own color and a legend entry. A wide table with one number column per character works, and so does a long table with a column that names the character; the chart then draws one ring per character.
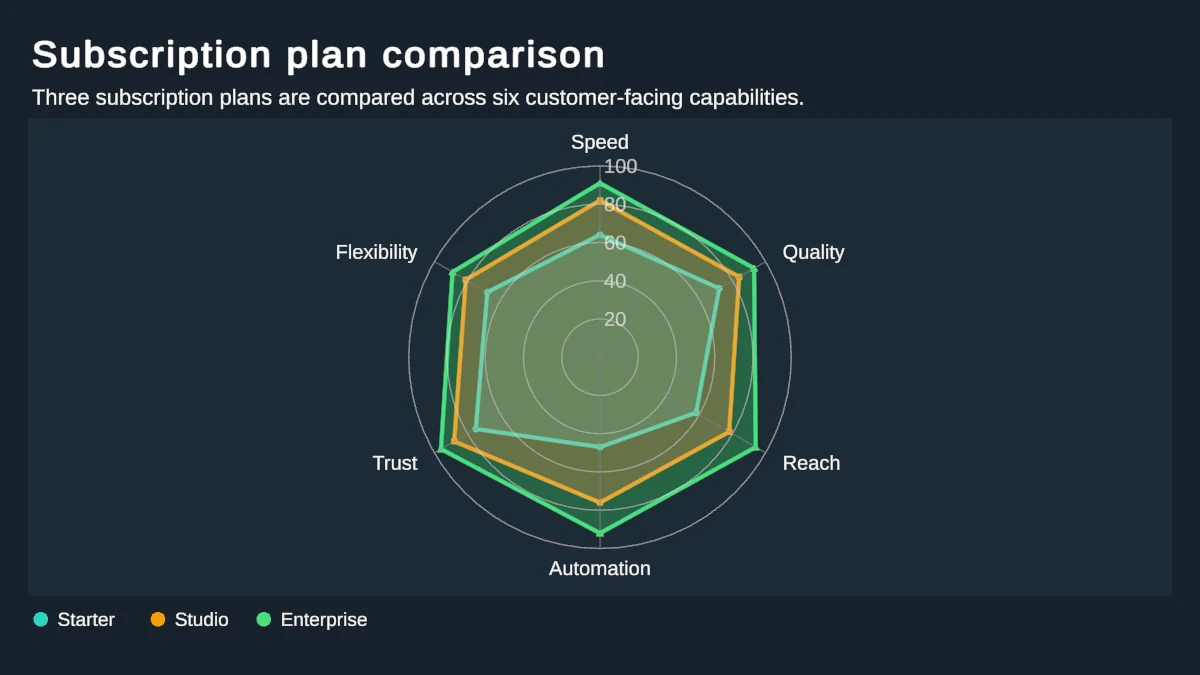 Three overlapping series. The same layout compares a knight, a ranger and a mage, or three versions of a sword.
Keep a radar to a few series. Past three or four, the fills hide each other and a grouped bar chart reads better. Radar and bar charts take the same data, so a host’s MorphTo switches between the two with an animated morph when players want the ranking instead of the profile.
Build one in the editor
- Open Tools > Chart Guru > 2D Gallery, search for radar (the Radar Chart template sits in the Comparison family) and use Create in Scene, or select any Canvas chart and pick Radar as its Chart Type on the Chart card.
- On the Data tab, use Edit Table: one text column for the stat names and one number column per character. Or bind a Chart Data asset or a data source, such as a CSV export of your item database.
- On the Axes tab, give the Y axis a minimum and maximum if the range should not start at zero.
- Pick Round or Straight rings on the Chart Designer’s Style tab or in a customized layer’s style, choose colors in Series Style on the Marks tab, and check the chart at its final size.
Copy C# on the Output tab writes the chart as code if you would rather own it in C#. Copy Swift reports the radar instead of writing it, because Swift Charts has no radar mark; radar is one of the Chart Guru extensions.
Build one in code
A saved definition with a wide table is the shortest path. The text column becomes the spokes and each number column a character:
ChartDefinition definition = new ChartDefinition(ChartType.Radar) .WithData(new ChartDataTable() .WithCategories("Stat", "Strength", "Agility", "Magic", "Defense", "Speed") .WithNumbers("Knight", 92f, 61f, 55f, 88f, 64f) .WithNumbers("Ranger", 70f, 94f, 62f, 66f, 90f));definition.YAxis.MinValue = 50f;definition.YAxis.MaxValue = 100f;definition.Animation.Animation = AnimationField.Enable(ChartGuru.Animation.EaseInOut(0.4f));_graphic.InlineDefinition = definition;When a stat changes, hand the chart a frame with the same columns, rows and categories. Values update in place where possible, and with an animation set the shapes move from what is on screen to the new values:
// The knight equips a new sword: same stats, new values._graphic.SetData(new ChartDataFrame( ChartDataColumns.Category("Stat", "Strength", "Agility", "Magic", "Defense", "Speed"), ChartDataColumns.Numeric("Knight", 97f, 61f, 55f, 88f, 64f), ChartDataColumns.Numeric("Ranger", 70f, 94f, 62f, 66f, 90f)), shapeChanged: false);Charts built entirely in code use RadarMark directly, one per vertex with an axis index, a value, a category label and a series key, which is also what Copy C# generates. The core concepts page lists RadarMark with the other marks, and the API quick reference shows the builder calls.
Tooltips, selection and linked charts
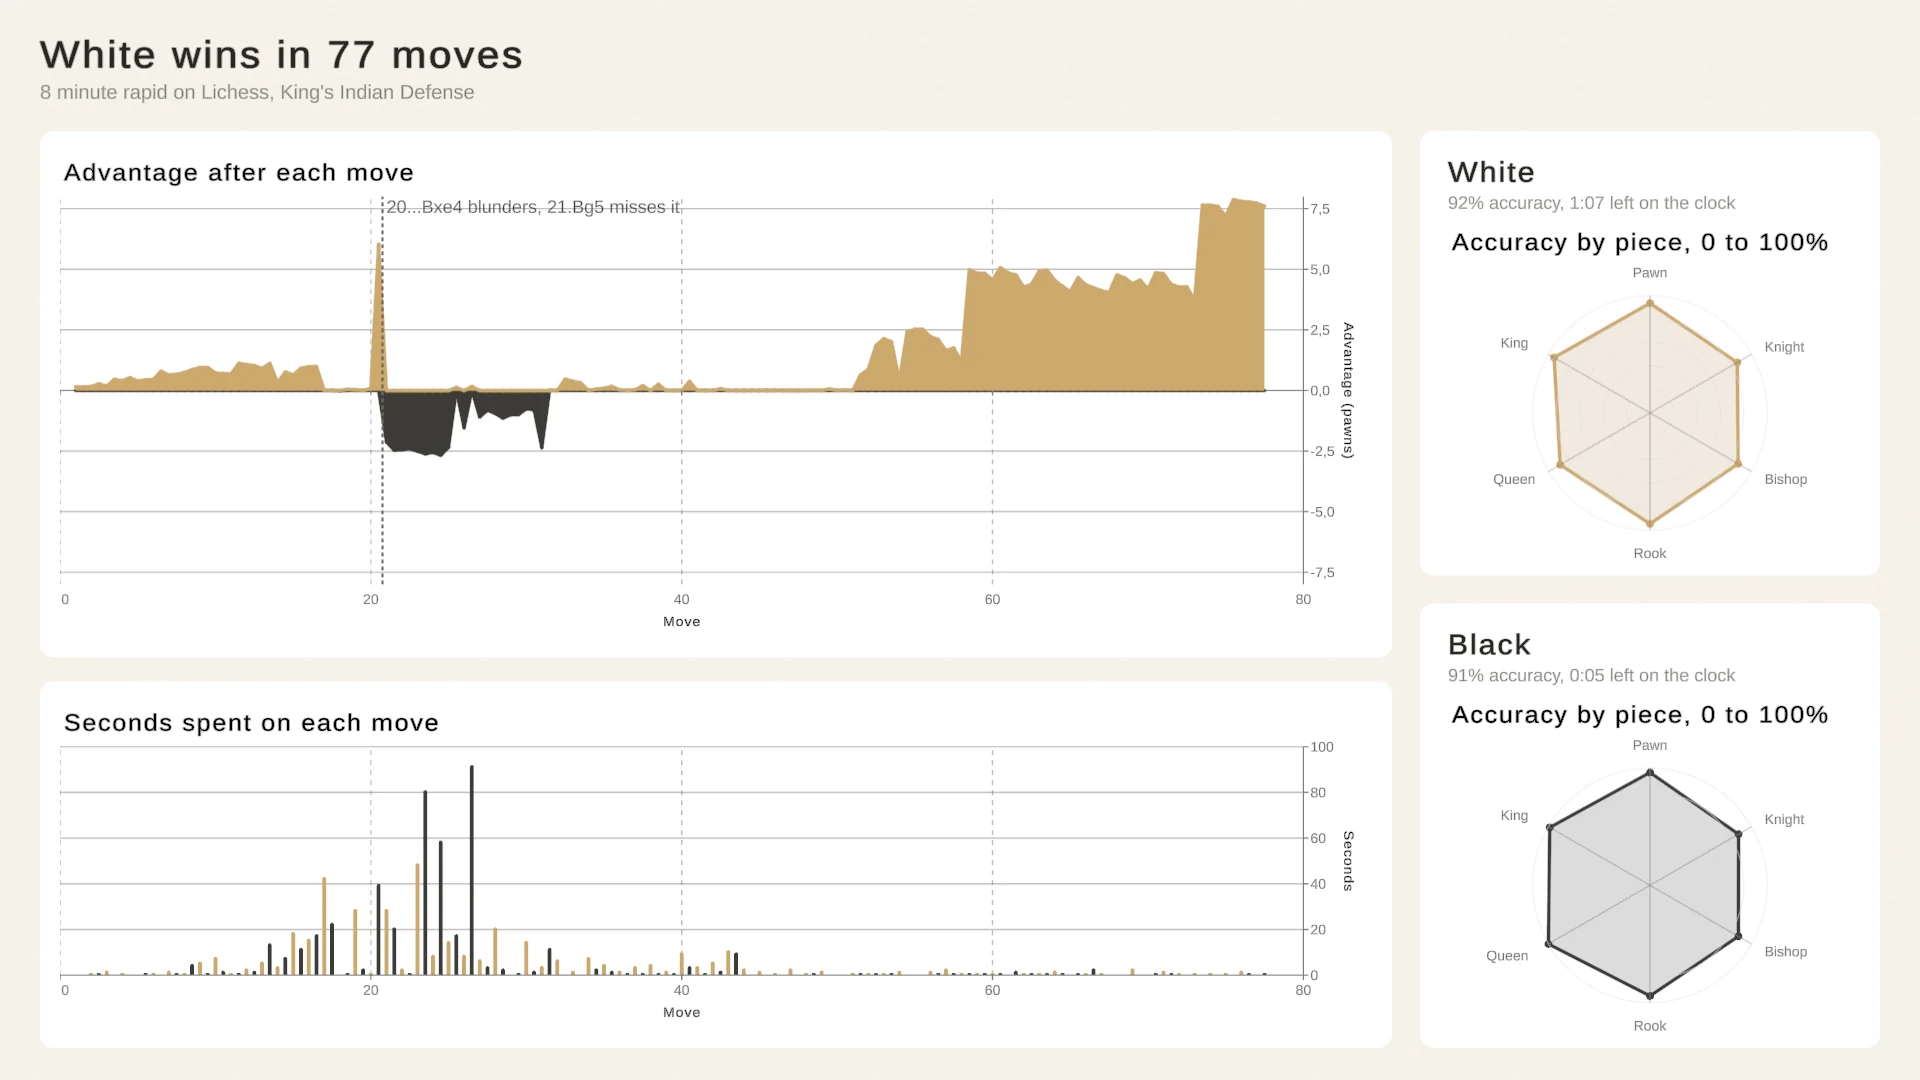
Hover a vertex for a tooltip with its stat and value; in the HoverAndPin mode a tap pins it, which helps on touch screens. A tap selects the vertex and raises the host’s OnDataPointSelected event, so a click on a spoke can open that stat’s breakdown. ChartSelectionLink keeps a radar and a bar chart of the same stats selecting together. The Match Summary example in stats screens and match summaries puts a radar of accuracy by piece, 0 to 100%, on each player’s card next to linked game charts.
Radar3D in the included 3D module
Chart Guru 3D comes with Chart Guru and adds Radar3D, which draws each series as a plate with its corners on the category spokes, in the scene, on a Canvas through a Chart 3D Image, or in UI Toolkit. Plates and ring values follow the same Y range as the 2D radar, so an explicit 50 to 100 range draws 75 halfway out. The Chart Designer’s 2D | 3D switch turns a radar into its 3D form, ChartTypeExtensions.Extrude maps Radar to Radar3D in code, and Radar3DMark builds one with Chart3D.Create(). The 3D sample Pies, Donuts and Radar shows penguin species profiles. One difference matters for live data: in 3D, a radar recompiles on each data change instead of updating in place, which is fine for a stat change after a level-up but not for a per-frame stream. See lifting 2D charts into 3D.
When something simpler is enough
If all you need is one fixed shape without labels, tooltips or animation, lighter options exist. Unity UI Extensions, free under the BSD-3-Clause license, includes a DiamondGraph primitive, and the Asset Store lists several small single-purpose radar assets. Chart Guru earns its place when the radar sits next to other charts, reads its data from the same sources, and needs labeled spokes, explicit ranges, tooltips, animation and a matching 3D form. The chart types overview lists the radar with the other types.
The Chart Guru product page shows radar charts beside the other chart families, and Chart Guru is available on the Unity Asset Store.
Frequently asked questions
Can the center of a radar chart be a value other than zero?
Yes. Give the Y axis an explicit minimum and maximum, on the Axes tab or with YAxis.MinValue and MaxValue. A 50 to 100 range draws 50 at the center and 100 on the outer ring; values below the minimum stay at the center and values above the maximum reach past the ring.
Can I import or export radar charts as Swift Charts code?
Swift Charts has no radar mark, so there is nothing to import. Copy Swift reports a radar chart as a Chart Guru extension instead of writing it, while Copy C# writes it as RadarMark code.
Can a radar chart be shown in 3D?
Yes. The Chart Guru 3D module, included with Chart Guru, draws Radar3D charts in the scene, on a Canvas or in UI Toolkit, and the Chart Designer's 2D | 3D switch turns a 2D radar into its 3D form.
Easy, reliable charts for Unity, from sparklines to multi-series 3D.
Keep reading
 Use case
Stats screens and match summaries for games
A stats screen tells the story of a match or a season. Chart Guru's Match Summary example turns a real Lichess game into linked charts, and the same parts build progression, economy and profile screens. Article