Core Concepts
Marks
A mark is the smallest drawable unit in a chart. The chart type often follows the mark type, but Chart Guru can also compose compatible cartesian marks in one chart, such as bars plus rule marks or points plus a line.
Mark | Used for |
|---|---|
BarMark | Vertical or horizontal bars, ranges, grouped bars, stacked bars, and mini bars. |
LineMark | Trend lines and connected point series. |
AreaMark | Filled trends, stacked areas, range bands, and confidence bands. |
PointMark | Point plots, scatter plots, and bubble-like encodings when symbol size is mapped. |
SectorMark | Pie and donut slices. |
RectangleMark | Heatmap cells and rectangular ranges. |
RuleMark | Horizontal or vertical reference lines and threshold markers. |
RadarMark | Radar or spider chart spokes and filled shapes. |
CandleStickMark | Open, high, low, close financial candles. |
Builder
The builder is a fluent way to assemble a Chart model. You add marks, configure the chart, then call Build. The same Chart model can be rendered in Canvas, UI Toolkit, editor previews, or custom code.
Chart chart = Chart.Create()
    .Add(new LineMark(0f, 42f))
    .Add(new LineMark(1f, 48f))
    .ChartTitle("Trend")
    .ChartXAxis(x => x.Label("Time"))
    .ChartYAxis(y => y.Label("Value"))
    .Build();
Semantic encoding
Semantic encoding means you describe what a mark represents instead of hard-coding every color. Chart Guru can then assign consistent colors, create legend entries, and group marks into series.
bar.ForegroundStyle(PlottableValue.Value("Product", "Electronics"));

// Use explicit color only when you need direct control.
bar.ForegroundStyle(Color.red);
Series, stacking, and legends
Marks with the same SeriesKey belong together. ForegroundStyleKey controls color assignment. For multi-series charts, use semantic foreground style values or set SeriesKey and ForegroundStyleKey yourself. Stacking is controlled with MarkStackingMethod: Unstacked, Standard, Normalized, or Center.
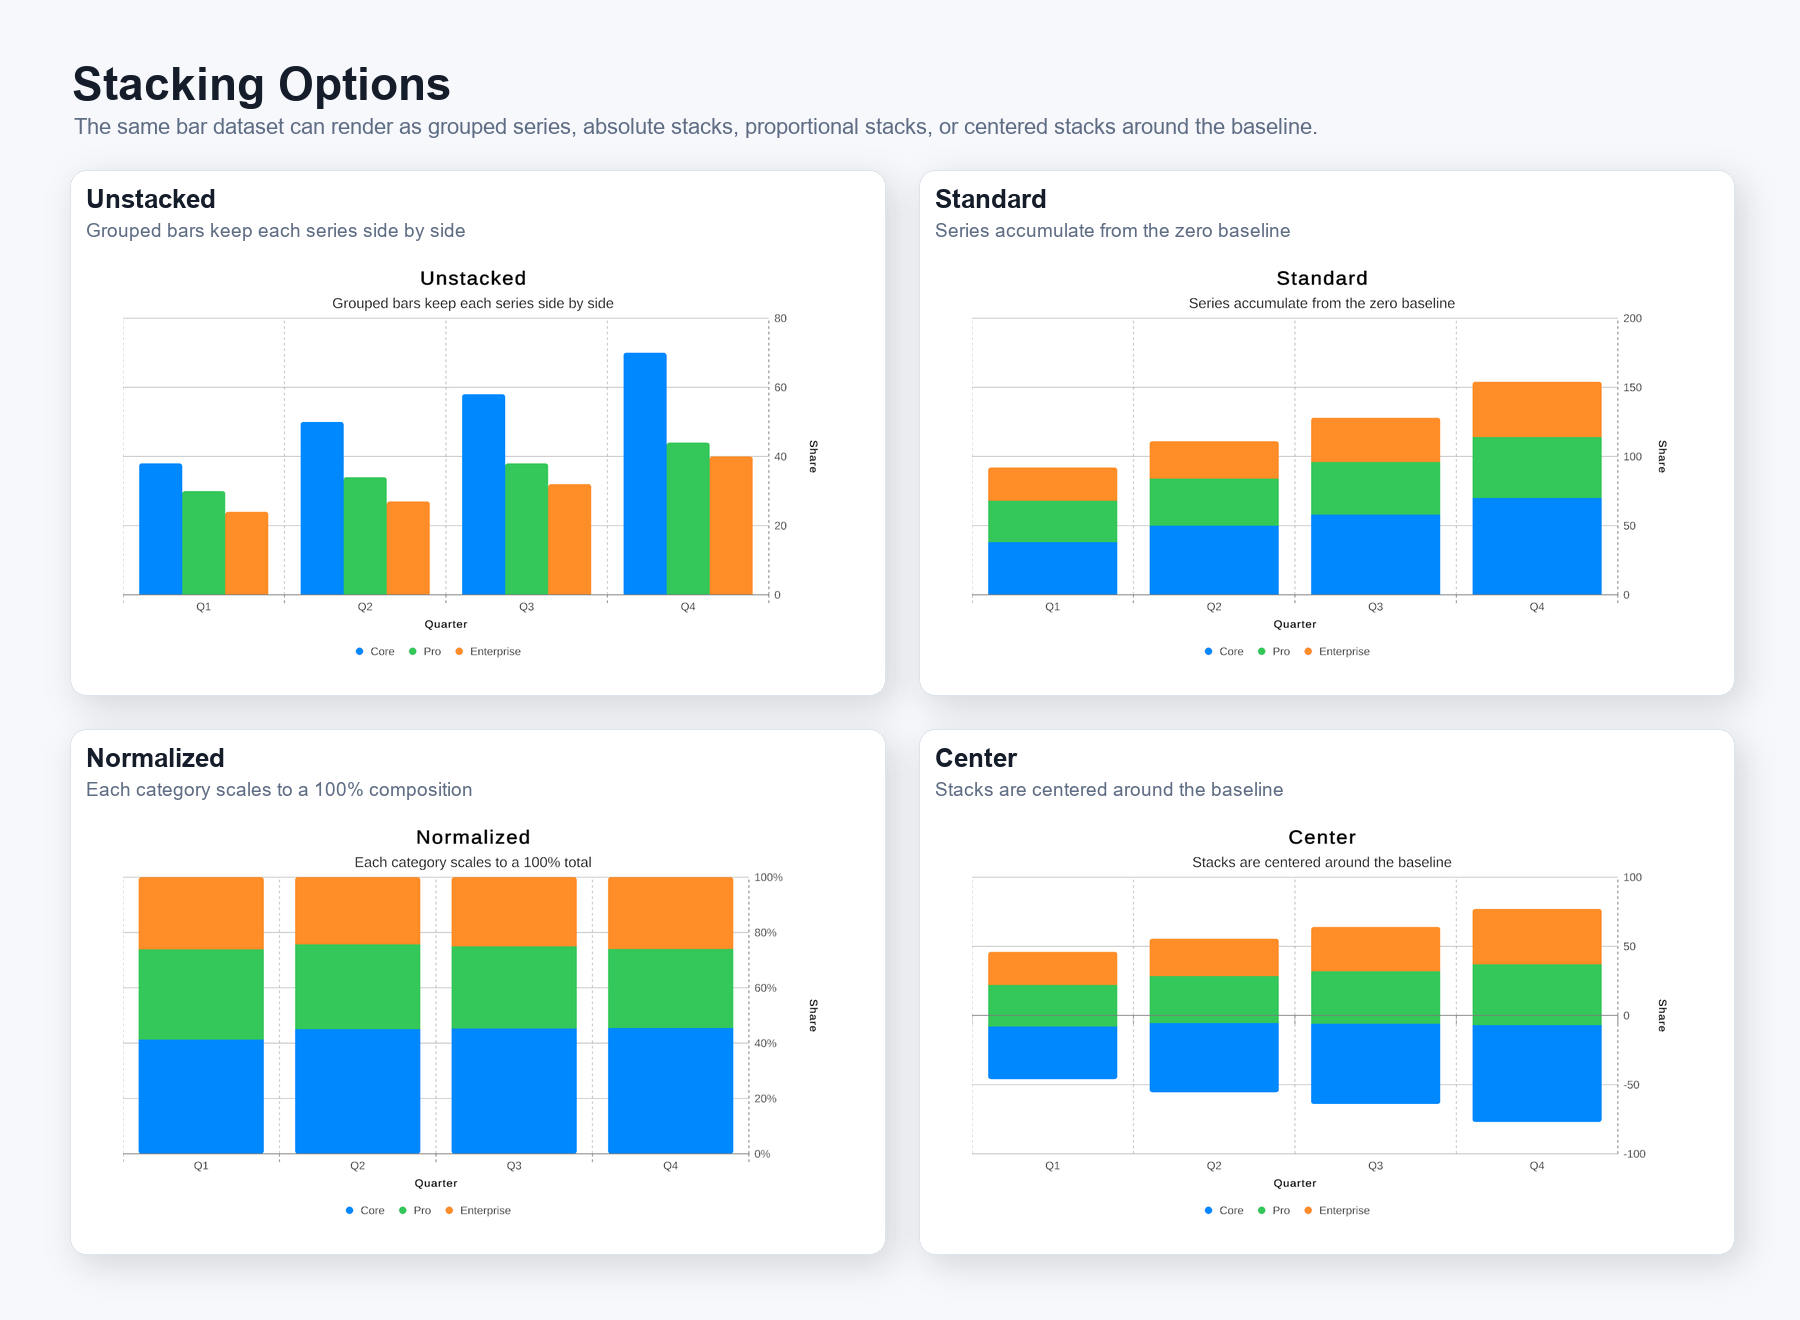
Figure 2. Stacking options: unstacked, standard, normalized, and center modes let the same bar dataset show grouped series, absolute totals, 100% composition, or centered totals around the baseline.