Charts in UI Toolkit and UI Builder
Add charts to Unity UI Toolkit without writing Painter2D code: a chart element for UXML and UI Builder, runtime panels, Unity 6 data binding, tooltips and editor windows.

UI Toolkit gives you layout, styling and data binding, but no chart. Unity’s manual covers one case, a two-slice pie chart drawn with Painter2D, and forum answers since 2020 have pointed people to generateVisualContent for everything else. That leaves scales, axes, labels, legends, hit testing, tooltips and animation to you.
Chart Guru adds a chart element to UI Toolkit. You place ChartGuruElement in UXML or drag it into a UI Builder layout, give it a chart asset or a chart type, and bind data. The element draws through the same renderer as Chart Guru’s Canvas charts, so a chart looks and behaves the same in both UI systems.
What Unity gives you today
| Option | What you get | What is left to you |
|---|---|---|
Painter2D and generateVisualContent | Vector drawing inside any VisualElement | Scales, axes, labels, legends, hit testing, tooltips, animation |
| Unity’s pie chart tutorial | A two-slice pie drawn with Painter2D | Every other chart |
ProgressBar, CurveField, GradientField | A progress bar and editor-only curve and gradient fields | Any data chart |
| Profiler charts | Charts inside Unity’s own Profiler window | Not usable: the classes are internal |
Painter2D is a good drawing API, and for one fixed shape it may be all you need. A chart that reads data, adapts its axes and answers a hover is a different amount of work, and that work is what the element takes over.
A chart element for UXML
The element lives in the ChartGuru namespace. This is the minimal layout from the rendering paths documentation:
<UXML xmlns="UnityEngine.UIElements" xmlns:cg="ChartGuru"> <cg:ChartGuruElement name="sales-chart" chart-type="Line" style="flex-grow: 1;" /></UXML>From C#, find the element and hand it a typed table. The chart’s automatic layer maps the text column to X and the number column to Y:
var chart = document.rootVisualElement.Q<ChartGuruElement>("sales-chart");chart.SetData(new ChartDataFrame( ChartDataColumns.Category("Region", "North", "South", "West"), ChartDataColumns.Numeric("Sales", 12f, 9f, 18f)));Chart Guru reads three attributes of its own: chart-type for the element’s own definition, and chart and data for a saved chart asset and data asset. Everything else, from titles and axes to tooltips and animation, lives in the chart asset or the element’s definition, so one design can move between UXML, Canvas and world-space hosts. USS lays out the element as it would any other; the colors of the marks come from the chart’s theme.
Building a screen in UI Builder
- Create a starter file with Assets > Create > Chart Guru > UXML Chart Template, or drag the element into an existing document.
- Set its chart and data attributes to a chart asset and a data asset on Unity 2023.2 or newer, or set only chart-type for a quick start.
- Size it with flex and USS like any other element. The chart draws in Edit Mode, with preview data until real data is bound, so the Builder canvas shows the actual chart while you arrange the screen.
Chart assets come from Assets > Create > Chart Guru > Chart or from the Chart Designer’s Save as Asset, and their Inspector edits them with a live preview. Several elements can share one asset, so a theme or axis change reaches every screen that uses it.
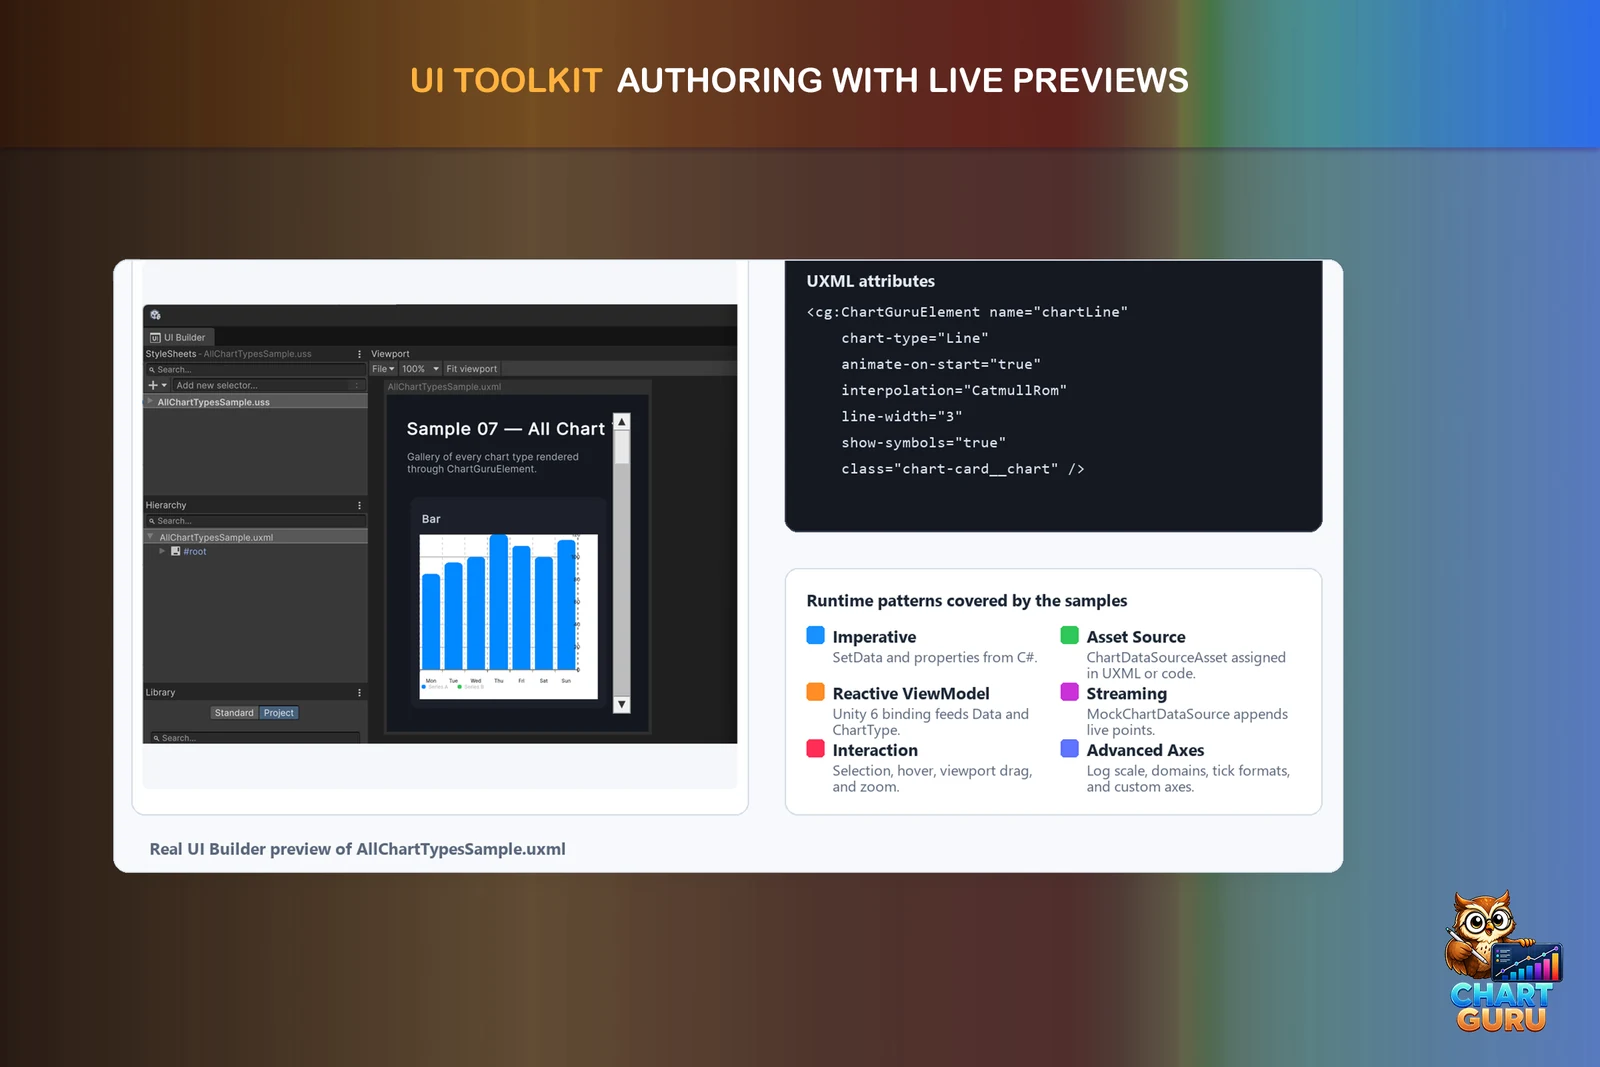 From the June 2026 store slides. Since 1.4 the element reads only
chart, data and chart-type from UXML, and styling lives in the chart asset.
Runtime panels and data sources
At runtime the element sits in a UIDocument, or in a PanelRenderer on Unity 6.5 and newer. UXML cannot reference scene objects, so a live data source reaches the element in one of two ways:
- Add a UI Toolkit Chart Binder next to the document. Fill in UI Panel and Element Name, optionally a Chart Asset and Data Asset, and put a data source on the same GameObject or a parent: CSV, JSON, Web, Google Sheets, mock data or a ring buffer. The binder connects it without a source field.
- Assign
element.DataSourcein code.
One binder type serves both the 2D ChartGuruElement and the 3D Chart3DElement from the included Chart Guru 3D module. It reconnects when a panel loads late, an object is re-enabled, the renderer changes or you undo a change. The data sources page lists every source and its refresh behavior.
Unity 6 data binding
On Unity 6 the element’s Data property is a runtime binding target. The UI Toolkit Data Binding lesson binds a small view model’s Data and ChartType to the element with DataBinding, so changing the model redraws the chart, and each click on the chart switches its type. On earlier Unity versions the same lesson assigns both properties directly. Its other three charts read a data asset, a scene data source and a stream of August 2024 Texas grid demand replayed into a ring buffer.
Sharp, readable and interactive
- Panel pixel density. The chart lays out in panel points and renders into a texture sized to its content rectangle in pixels, so it stays sharp at the panel’s scale.
- Text as UI Toolkit elements. Axis labels, legends, titles and tooltips are pooled UI Toolkit elements on an overlay, placed from the same layout the Canvas host uses.
- Tooltips. Hover shows the values next to the active mark. The automatic preset compares line or area series that share the hovered X value, tooltips size to their content, and a tap or click can pin one. See interaction and live updates.
- Gestures. Tap, drag, double-tap, long-press and pinch work as they do on Canvas charts. Dragging continues outside the chart’s bounds, and wheel input the chart does not use still scrolls a parent ScrollView.
The same element in editor windows
ChartGuruElement is a regular VisualElement, so it also works in an EditorWindow and in a custom inspector’s CreateInspectorGUI, rendering in Edit Mode. Chart Guru’s own Chart Designer, theme preview and chart asset previews are built on it. Charts in editor windows and custom inspectors walks through both cases.
A portrait app screen built this way
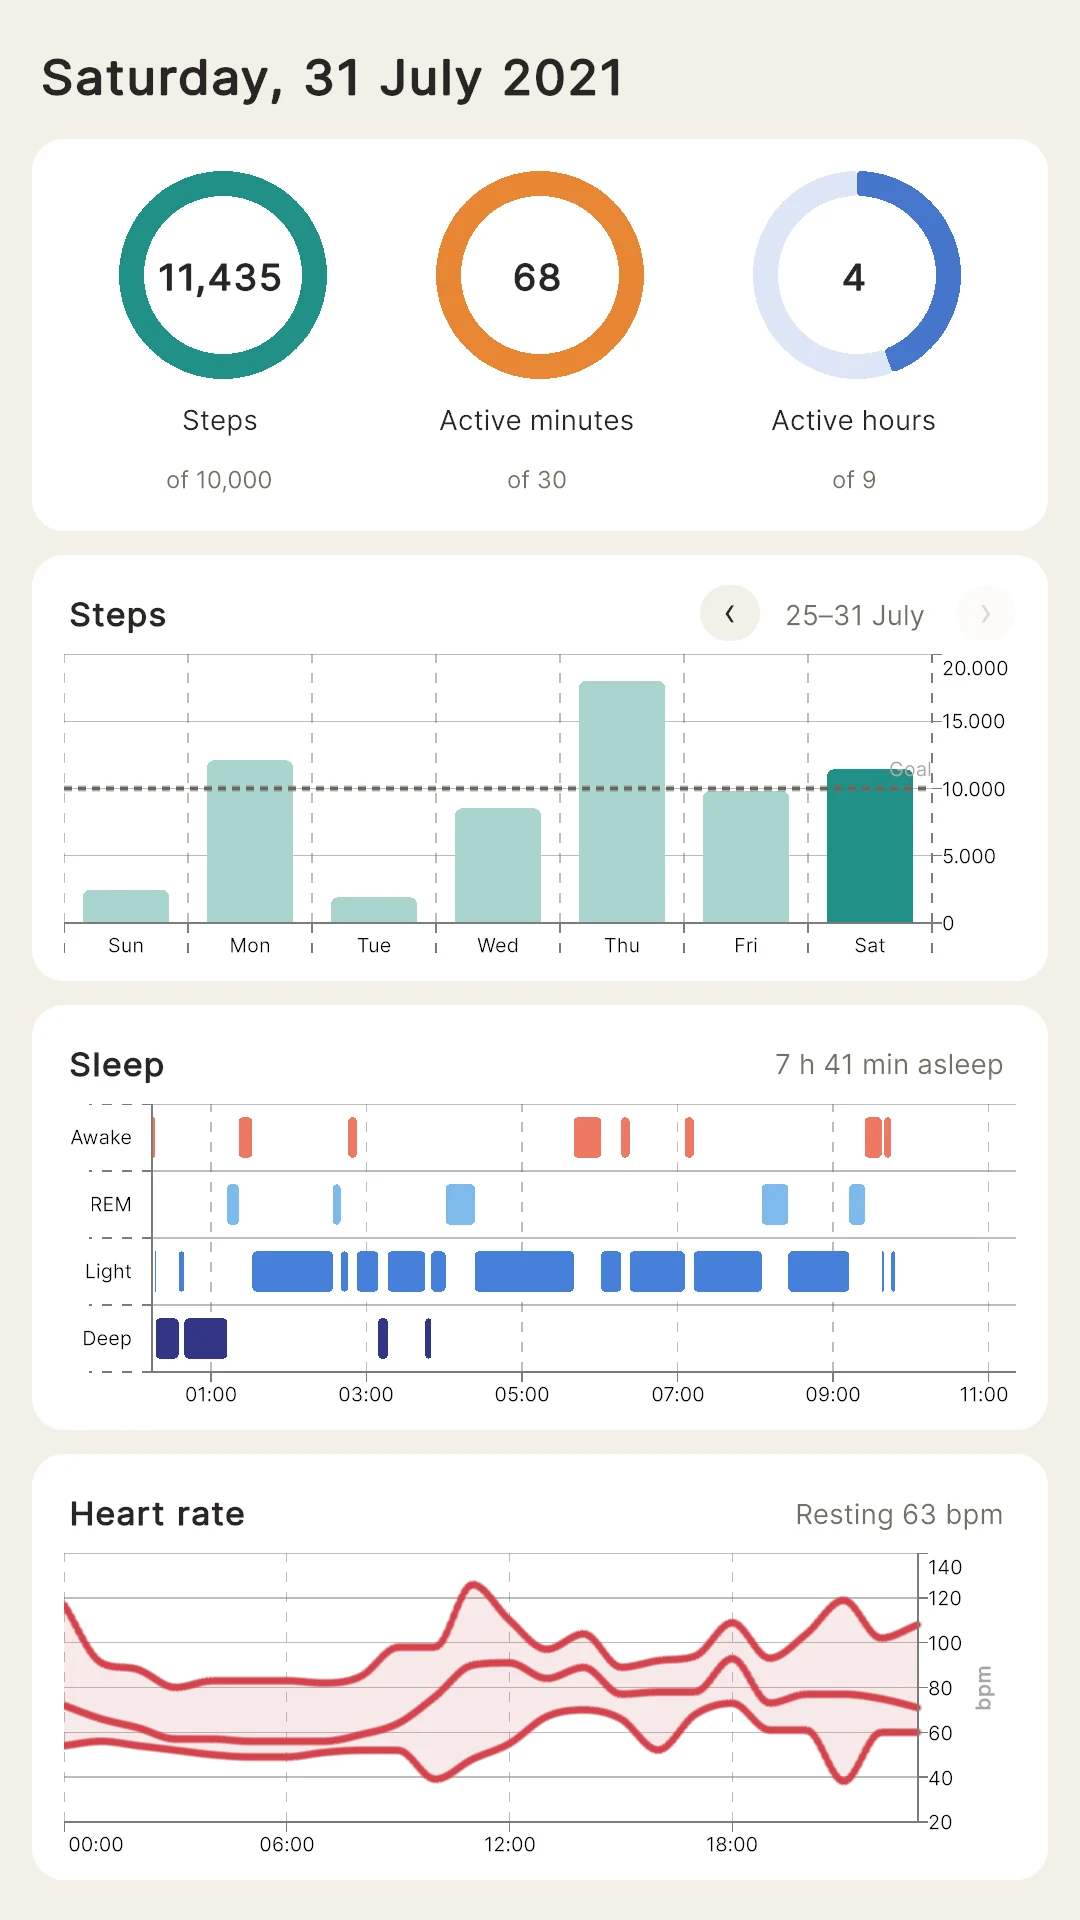
The Phone Health App production example is a portrait UI Toolkit screen with six chart elements in one UXML file: rings for steps, active minutes and active hours, the week’s steps, the night’s sleep stages and the day’s heart rate. The data covers 27 days of a Fitbit wearer’s July 2021 from the LifeSnaps study. Tap a bar of the week to show that day, or step between weeks with the arrows. The screen also runs in Edit Mode, so the document shows the latest day before you press Play. Play it in a portrait Game view such as 1080x1920.
Limits worth knowing
- The
chartanddataUXML attributes need Unity 2023.2 or newer. On 2022.3, assign assets through the binder or in code. - USS positions and sizes the element but does not style the marks; colors come from the chart’s theme.
- Runtime data binding needs Unity 6, and
PanelRendererhosts need Unity 6.5 or newer. ChartGuruElementdraws 2D charts and shows a 3D definition in its flat form. For depth, useChart3DElementfrom the included 3D module.
Where to start
Open Examples/04_Workflows/UI Toolkit Charts for every chart type, interaction and tooltips in one document, then UI Toolkit Data Binding for the four ways to feed an element. The authoring workflows page covers UXML authoring in depth, and the Chart Guru product page shows the rest of the package. Chart Guru is available on the Unity Asset Store.
Frequently asked questions
Does Unity have a built-in chart control for UI Toolkit?
No. As of November 2026 the UI Toolkit element reference lists no chart, graph or plot element, and uGUI has none either. Unity's manual shows how to draw a two-slice pie chart with Painter2D, which is sample code rather than a control, and the Profiler's chart widgets are internal editor classes.
Can I use the same chart element in an editor window?
Yes. ChartGuruElement is a regular VisualElement, so it works in a Unity EditorWindow's rootVisualElement and in a custom inspector's CreateInspectorGUI, and it renders in Edit Mode. Chart Guru's own Chart Designer and chart asset previews use the same element.
Which Unity versions do I need for UI Builder assets and data binding?
Chart Guru runs in Unity 2022.3 or newer, and the chart-type UXML attribute works on every supported version. The chart and data asset attributes in UI Builder need Unity 2023.2 or newer; on older versions you assign assets through the UI Toolkit Chart Binder or code. Runtime data binding of the element's Data and ChartType properties needs Unity 6.
Easy, reliable charts for Unity, from sparklines to multi-series 3D.
Keep reading
ComparisonUI Toolkit chart assets compared
Four 2026 assets draw charts in UI Toolkit. Helix Vizforge has the broadest catalog, Easy Chart Lite the lowest price and UIT Graphs the leanest plotter; Chart Guru adds selection, morphs, accessibility, a Designer and Unity 2022.3 support. Use case
Charts in Unity editor windows and custom inspectors
Unity's Profiler charts are internal, so tool builders draw their own. Chart Guru's ChartGuruElement works in any EditorWindow and in CreateInspectorGUI, renders in Edit Mode and uses the same API as runtime charts. Article