Expanded Authoring Workflows
Chart Guru can be authored from the Inspector, Gallery, Designer, fluent C#, Swift Charts snippets, and UI Toolkit. The best workflow depends on whether you are exploring a visual idea, building a scene chart, migrating Swift Charts code, or embedding charts into a UI Toolkit application.
Gallery as a concept browser
Open Tools > Chart Guru > Chart Gallery to browse curated examples by category. The Gallery is useful before writing code because it shows compact, comparison, trend, distribution, circular, financial, grid, interaction, annotation, styled, and function examples with live preview renders.
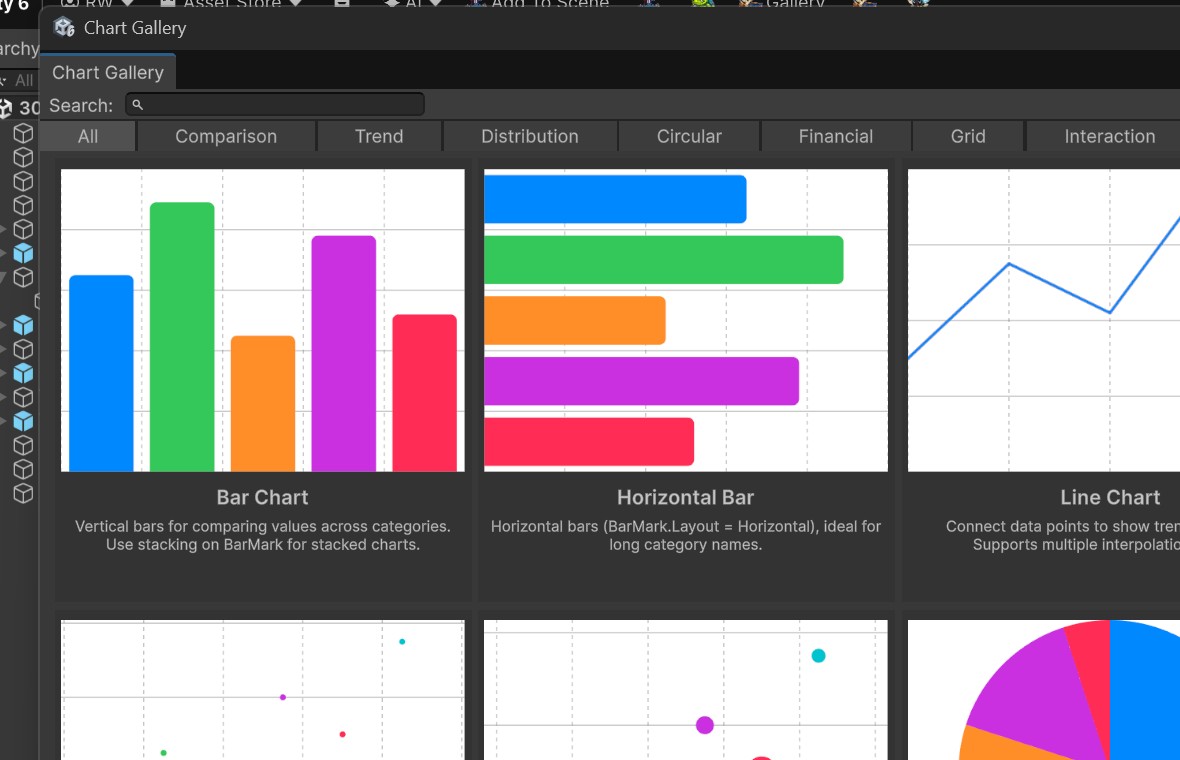
The Chart Gallery groups live chart previews by category and supports search, descriptions, multi-series previews, and stacked previews.
- Use Search when you know the concept name, such as trend, range, selection, or viewport.
- Use the category tabs when choosing a visual form for a problem: comparison, trend, distribution, circular, financial, grid, interaction, annotations, styled, function, or compact.
- Toggle multi-series and stacked previews before deciding whether a chart family behaves with multiple series before opening it in the Designer.
- Open a gallery card in the Designer when you want to inspect or adapt the exact chart configuration.
Designer workflow
Open Tools > Chart Guru > Chart Designer for visual chart creation. The Designer is not a separate chart model; it edits the same chart state used by ChartGraphic, ChartGuruElement, and generated C#.
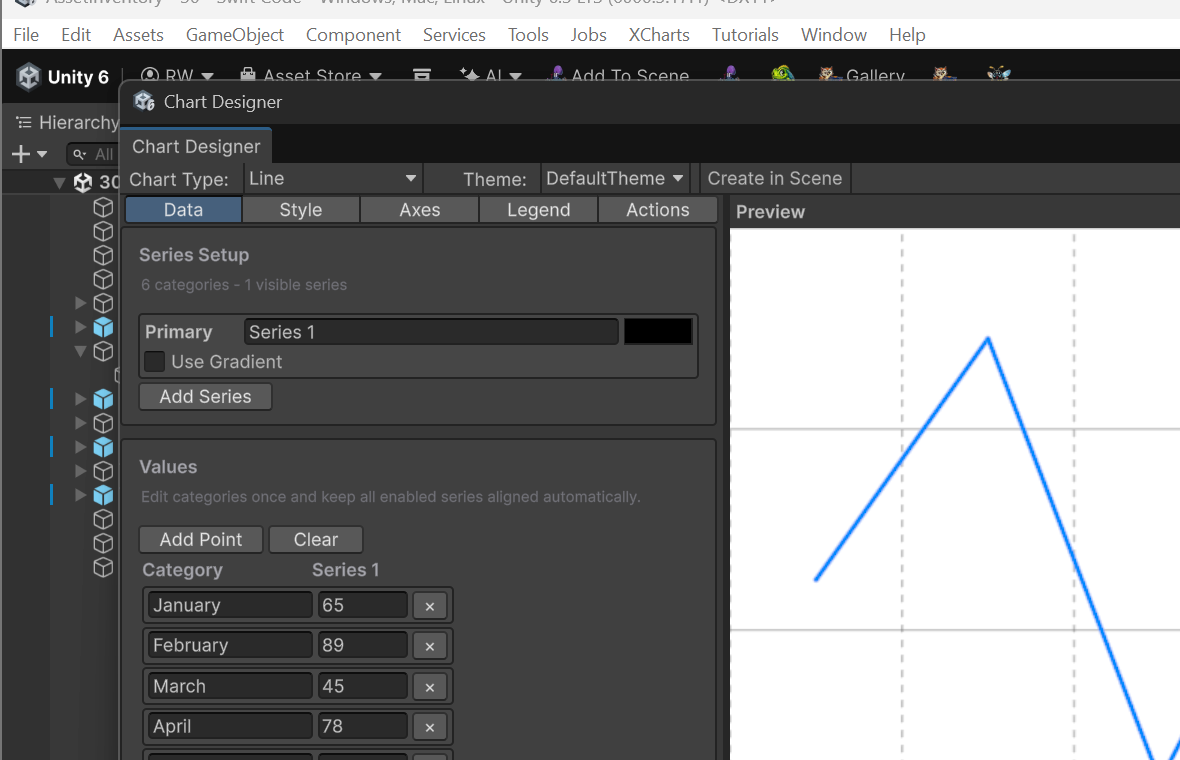
The Chart Designer edits data, style, axes, legends, actions, preview data, generated code, and save workflows from one editor window.
- Data controls define categories, values, series names, colors, and generated sample data for chart families that need special data shapes such as heatmaps or candlesticks.
- Style controls cover mark shape, interpolation, opacity, gradients, plot area styling, font choices, axis labels, and chart area layout.
- Axes controls expose domains, scale, tick count, formatting, label orientation, collision behavior, range padding, and origin alignment.
- Legend controls set position and alignment while actions controls expose animation, morphing, selection, and interaction-oriented preview behavior.
- Create in Scene instantiates a configured chart graphic in the active scene, while Show Code produces equivalent C# for production use.
Swift Charts import and parsing
The Swift Charts importer is intended for prototyping and migration. Paste Swift Charts-style code in the Designer or browse the shipped Swift samples in Example 30. The importer accepts real Swift framing such as variables, foregroundStyle, chartLegend, annotation, and BarMark/SectorMark/LineMark declarations while emitting clean Chart Guru C# using PascalCase APIs.
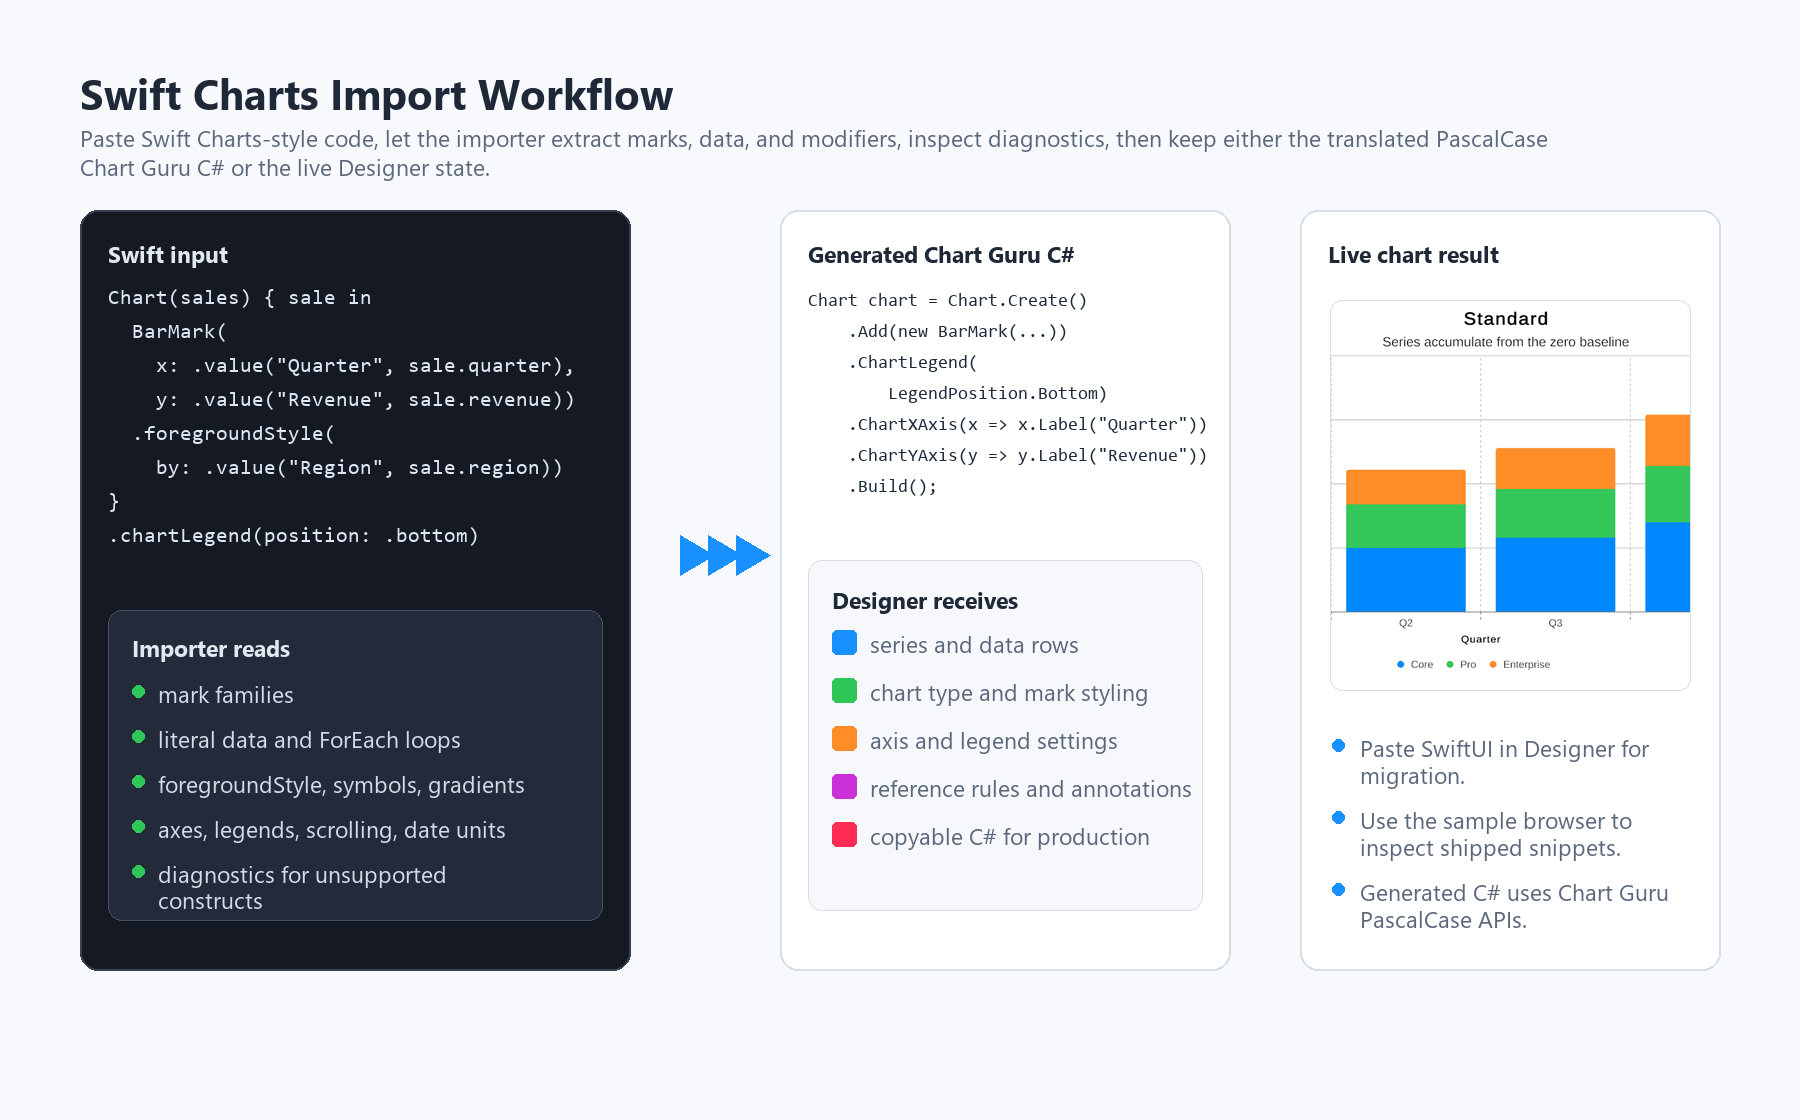
Swift Charts import parses supported marks, literal data, modifiers, axes, legends, and diagnostics, then produces Designer state and C#.
- Supported input is chart-focused Swift code with concrete marks and extractable literal data. Dynamic app logic should be translated manually or stubbed before import.
- Supported concepts include common marks, foreground style, gradients, symbols, stacking, legends, axis visibility and formatting, scroll position, visible domains, date units, annotations, reference rules, trendline ideas, function plots, and vectorized typed plot helpers.
- Diagnostics explain unsupported or partially supported constructs so the converted result can be reviewed instead of silently misrepresenting the original chart.
- Generated code keeps the Swift mark structure as close as practical while using idiomatic Chart Guru C# names and avoiding unnecessary default modifiers.
ADVANCED SWIFT EXAMPLE CONCEPTS
Example 30 includes 40 Swift Charts snippets that work as a concept atlas before you build production charts. Use the sample browser to inspect layered marks, custom axes, overlays, data loops, scale modifiers, function-style plot ideas, vectorized symbol fields, and dense encodings, then import the closest Swift structure and refine the generated Chart Guru C# where needed.
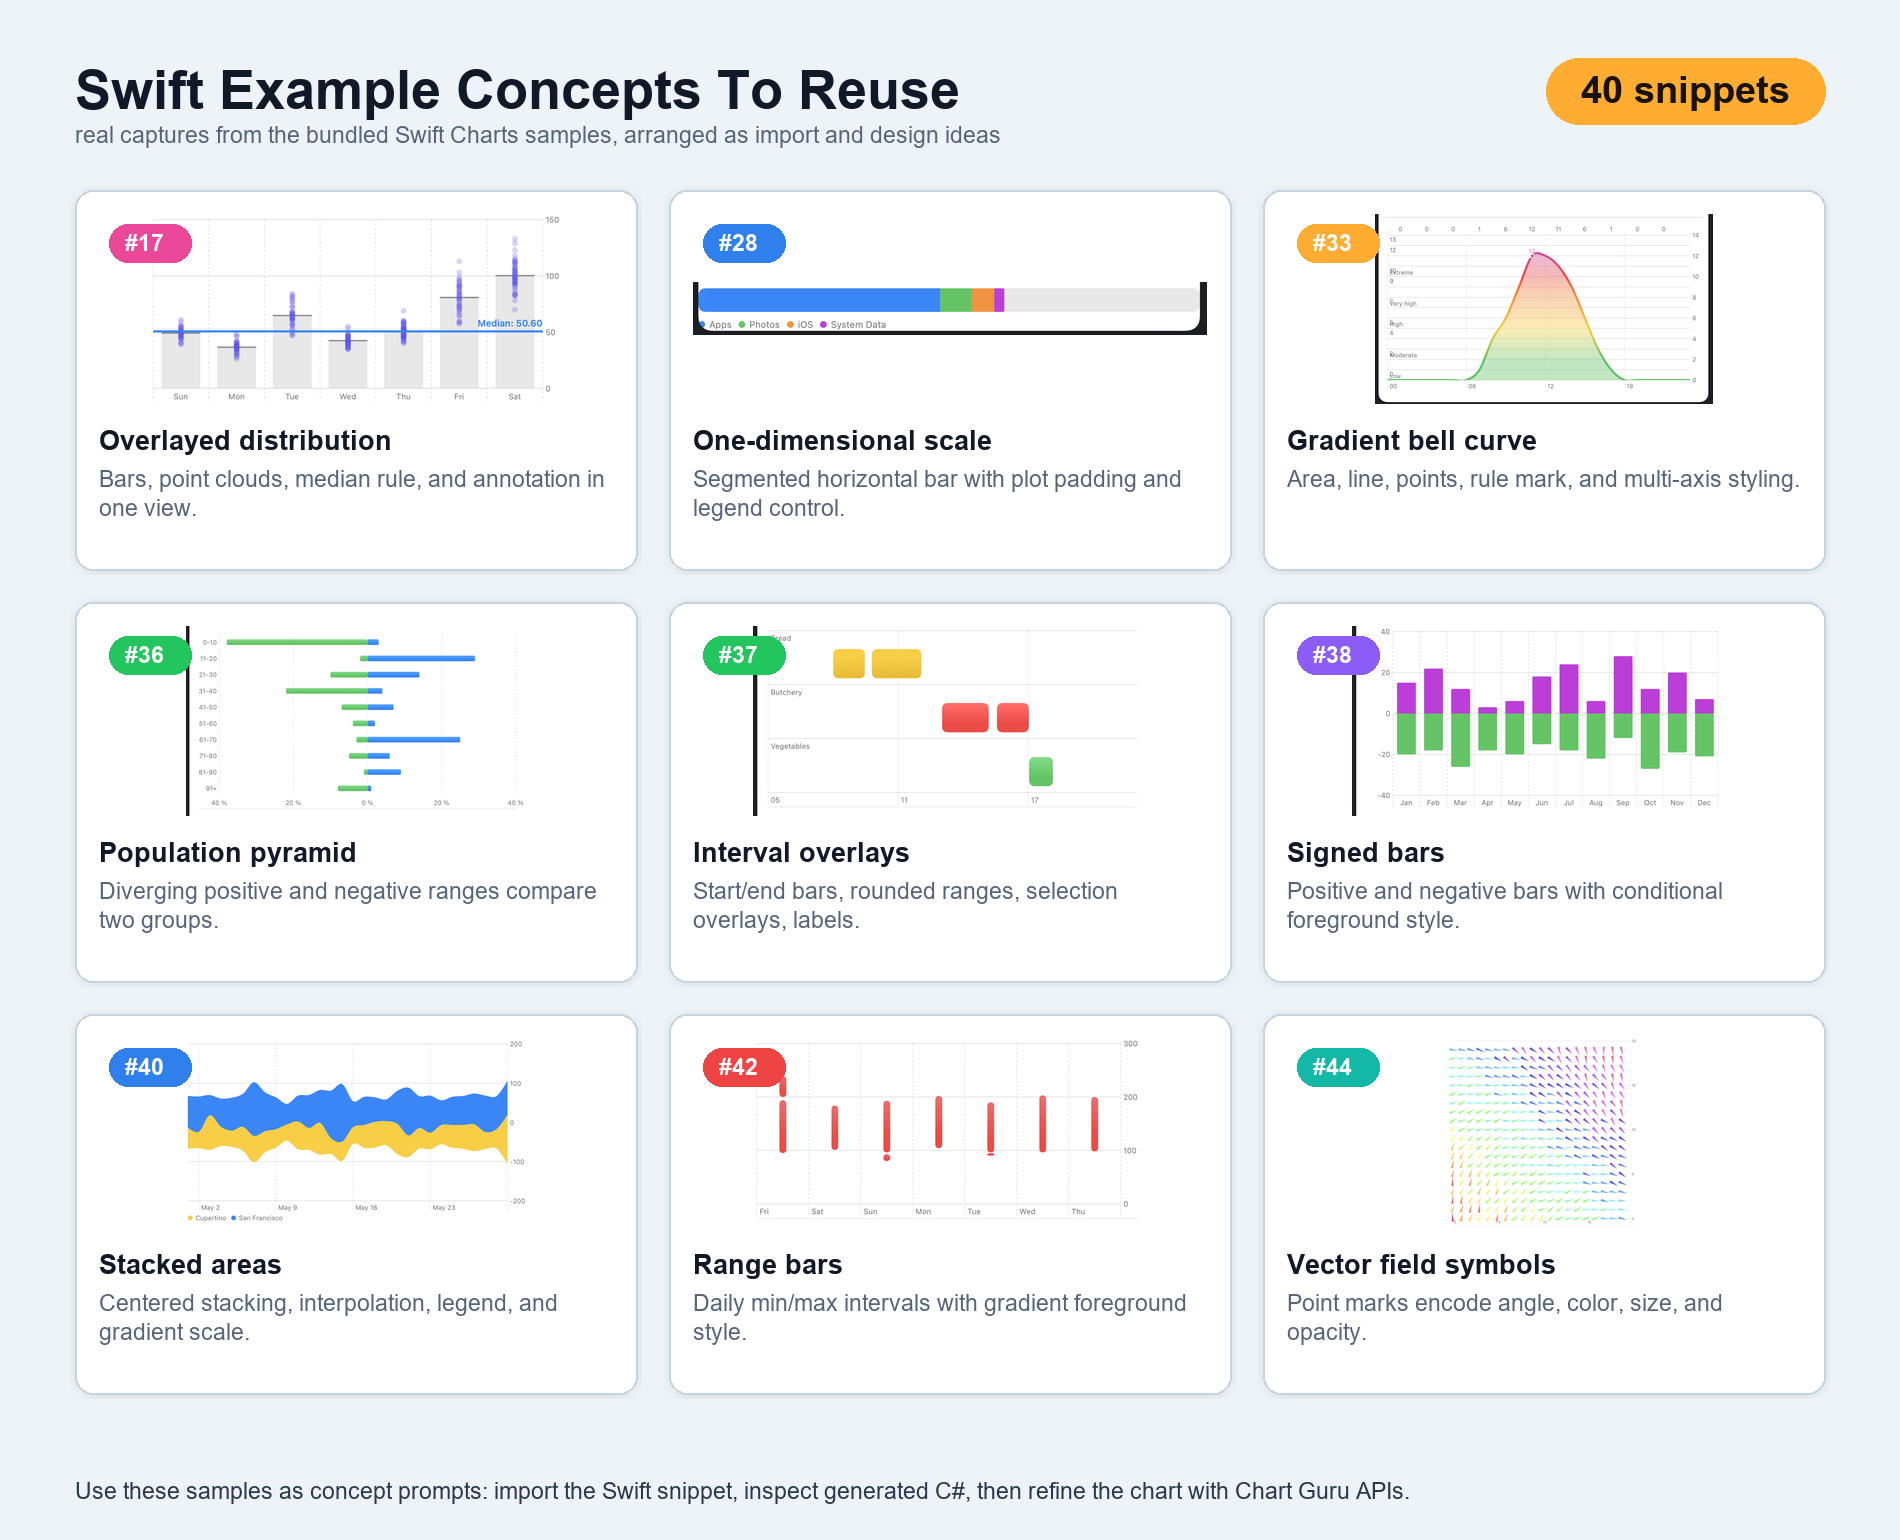
Advanced Swift example concepts from Example 30, including overlayed distributions, one-dimensional scales, multi-axis gradients, population pyramids, interval overlays, signed bars, stacked areas, range bars, vector-style point symbols, threshold rules, and lollipop selection.
- Layer marks: combine AreaMark, LineMark, PointMark, RectangleMark, and RuleMark so gradients, peaks, thresholds, and selections describe the same data.
- Compose axes: translate top/bottom X axes, leading/trailing Y axes, custom labels, grid lines, and labelled bands into ChartXAxis, ChartYAxis, and axis builder calls.
- Use overlays: pair chartOverlay and ChartProxy patterns with RuleMark, lollipop symbols, and annotations for tap or drag inspection.
- Encode dense data: use foreground style, symbol size, opacity, interpolation, stacking, start/end ranges, function plots, and vectorized typed plots to carry extra dimensions without adding separate charts.
- Refine custom Swift ideas: snippets with app-specific ChartSymbolShape code are useful starting points; translate the chart structure first, then finish the symbol, mark, function/vectorized plot, or renderer customization in Chart Guru.
SUPPORTED SWIFT CONSTRUCTS AND MODIFIERS
Marks: BarMark, LineMark, AreaMark, PointMark, RectangleMark, RuleMark, SectorMark, candlestick/range concepts, and composed mark groups.
Data loops: Chart(data), ForEach, enumerated(), grouped/nested loops, and bundled sample-data resolution.
Encodings and modifiers: x/y/start/end channels, foreground style, symbol, symbol size, opacity, interpolation, line style, corner radius, gradients, and legends.
Axes and scales: chartXScale, chartYScale, domains/ranges, top/bottom and leading/trailing axes, AxisMarks, grid lines, ticks, labels, custom-scale equivalents, and modifyInferredDomain ideas.
Analysis and interaction: reference rules, annotations, chartOverlay/ChartProxy patterns, lollipop inspection, accessibility labels/values, trendline/regression concepts, mathematical function plots, and vectorized typed plot helpers.
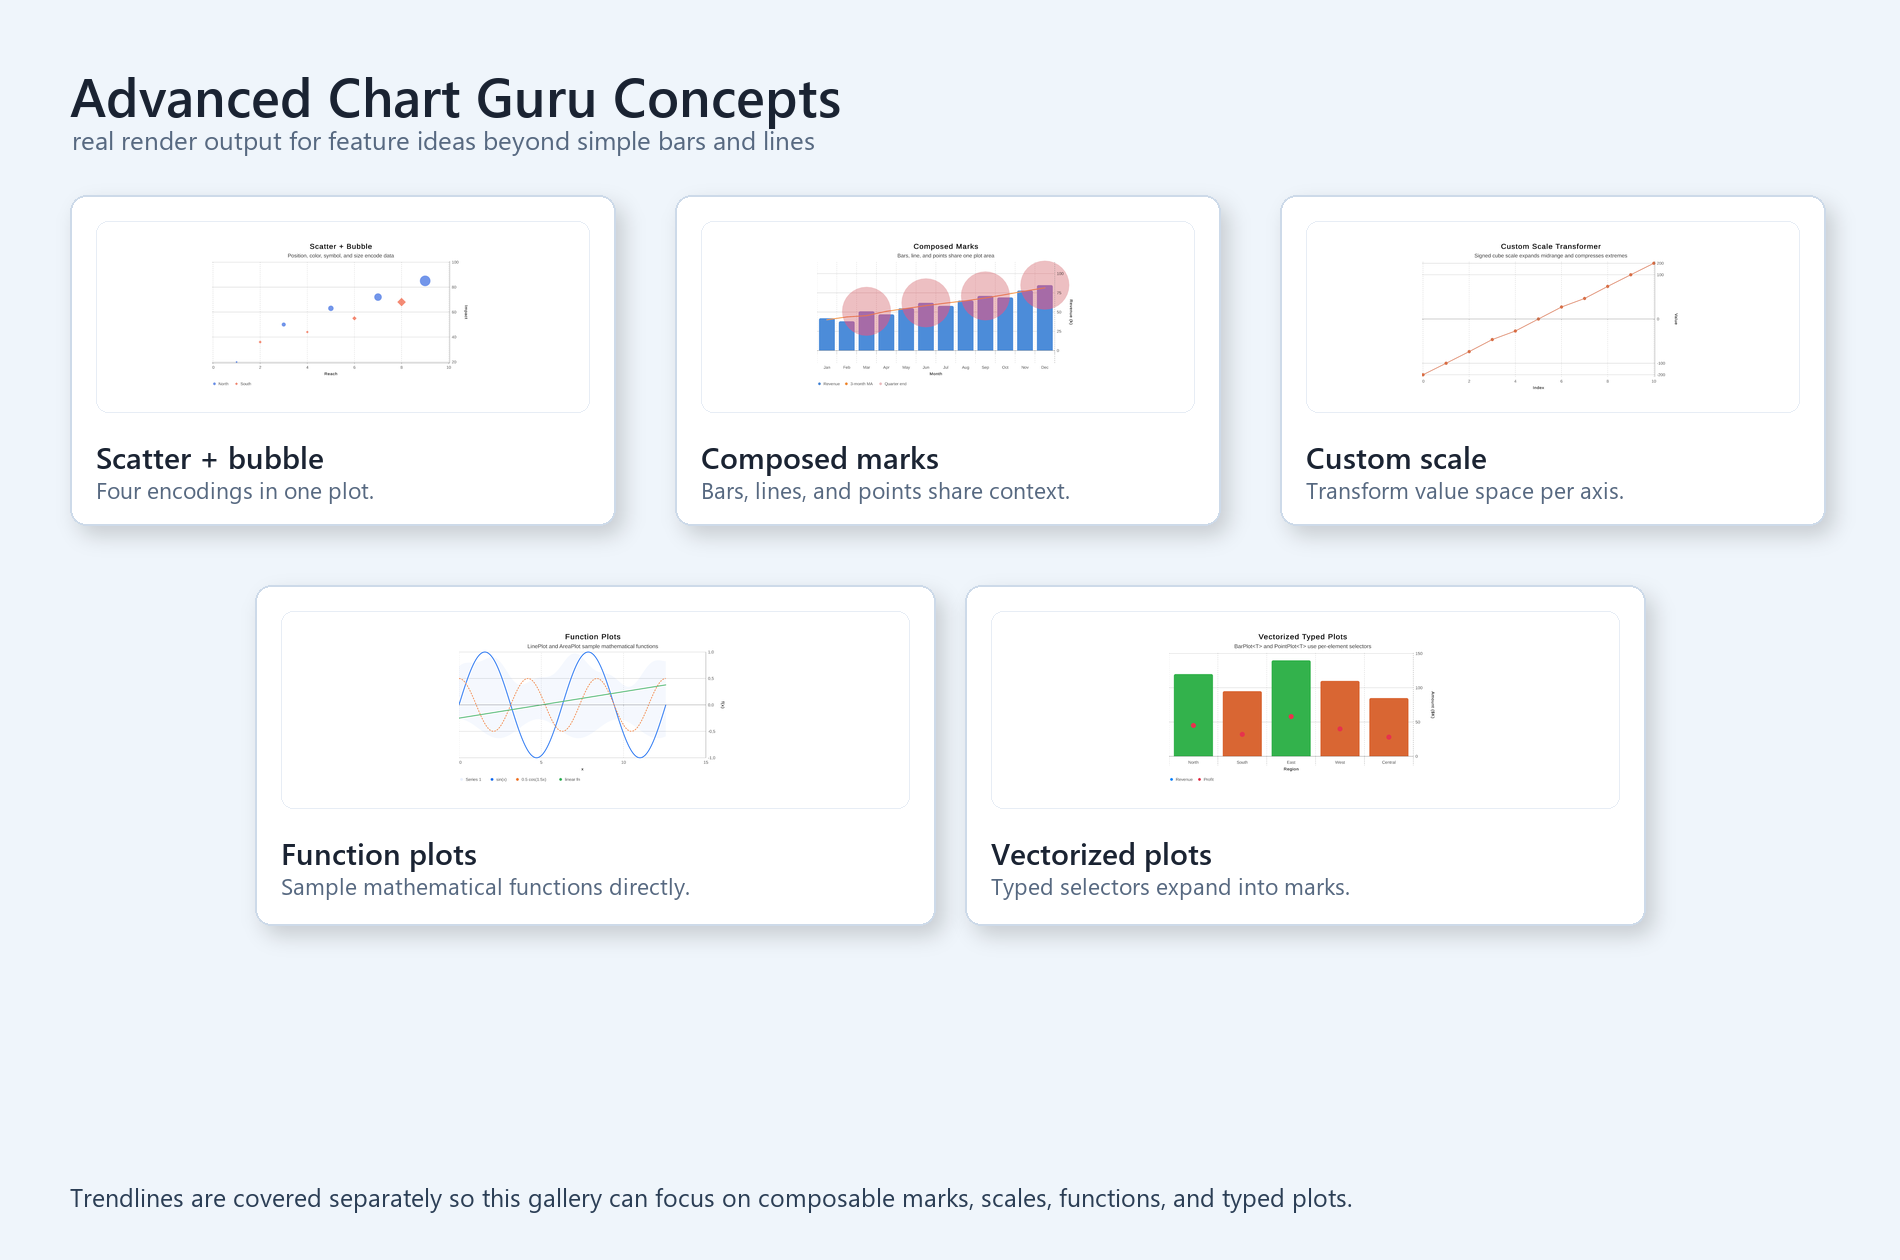
Advanced Chart Guru concepts: scatter/bubble encodings, composed marks, custom scales, mathematical function plots, and vectorized typed plots.
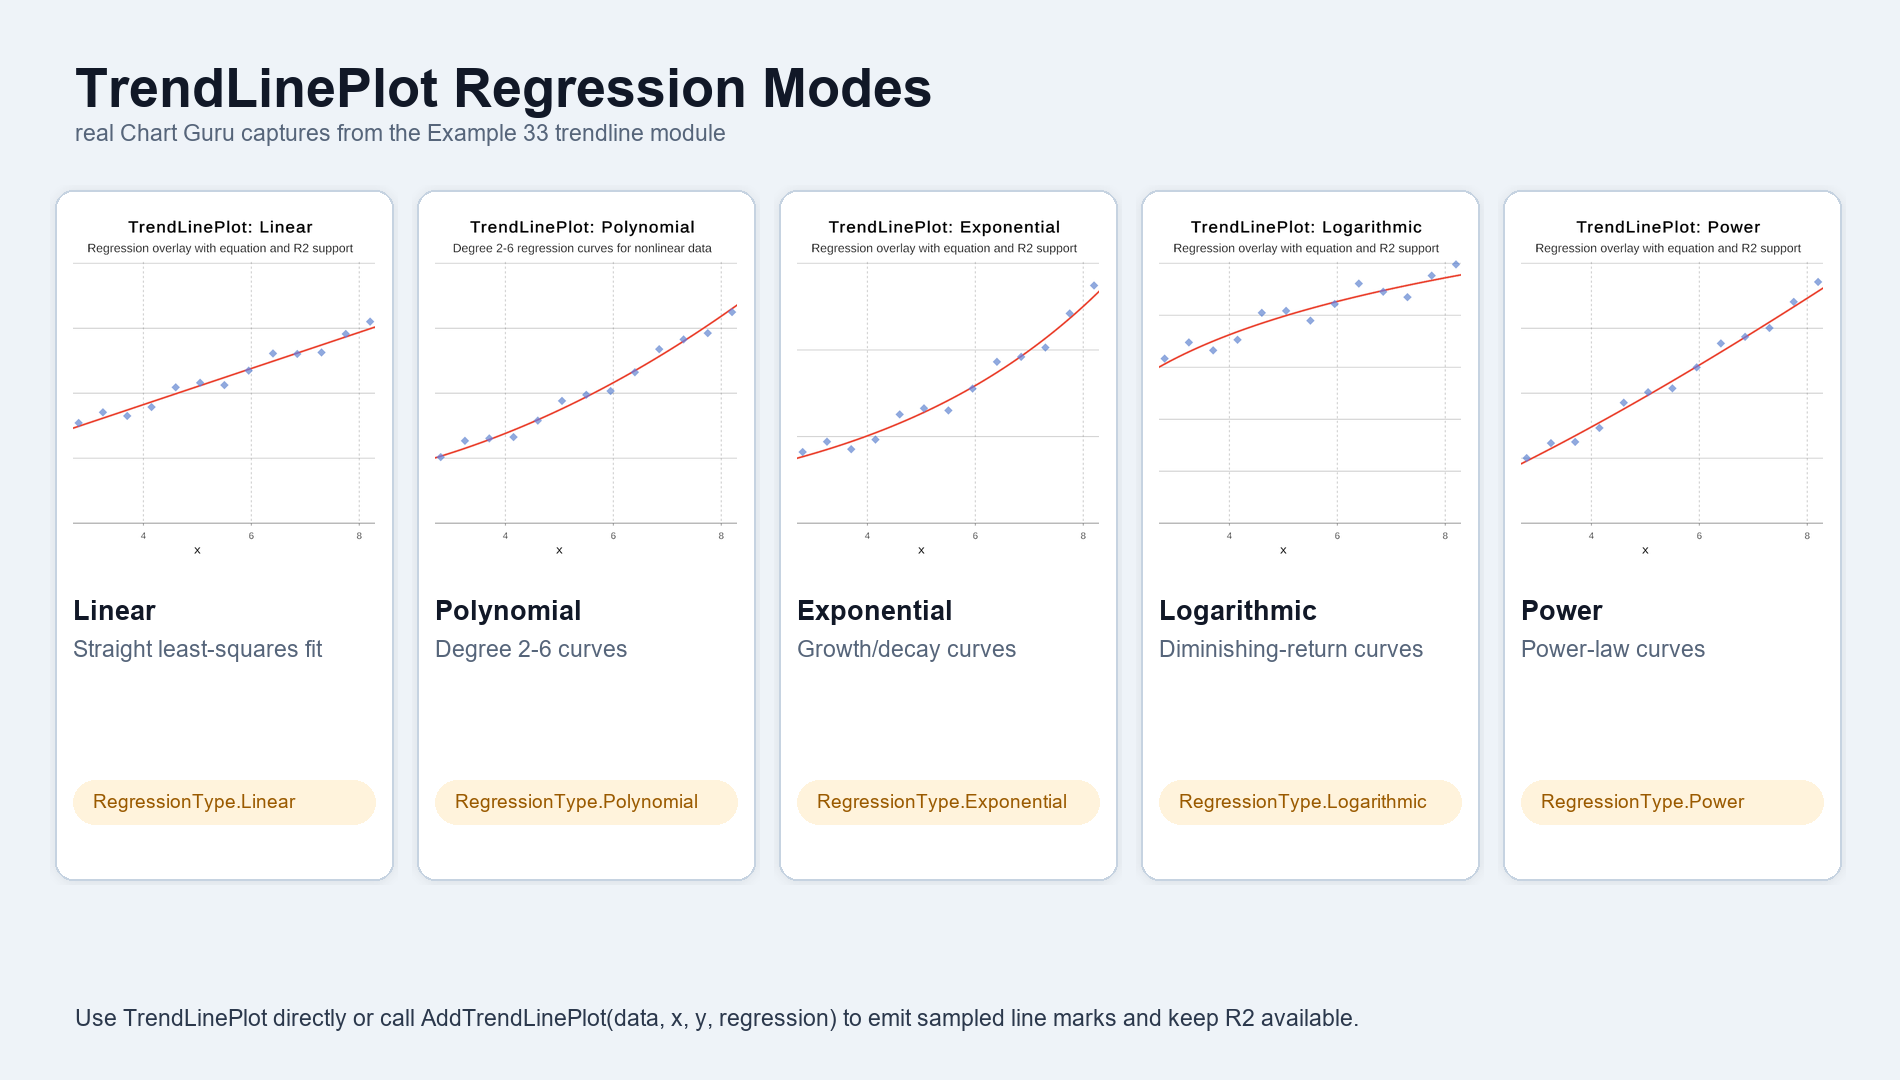
TrendLinePlot regression modes from Example 33: linear, polynomial, exponential, logarithmic, and power fits with sampled regression overlays.
UI TOOLKIT DESIGNER AND UXML AUTHORING
ChartGuruElement is a VisualElement with UXML attributes for chart type, title, labels, axes, legend, marks, data source, and interaction. Use UI Toolkit/Scriptable charts as scene component model feeds a render element inside a UIDocument.
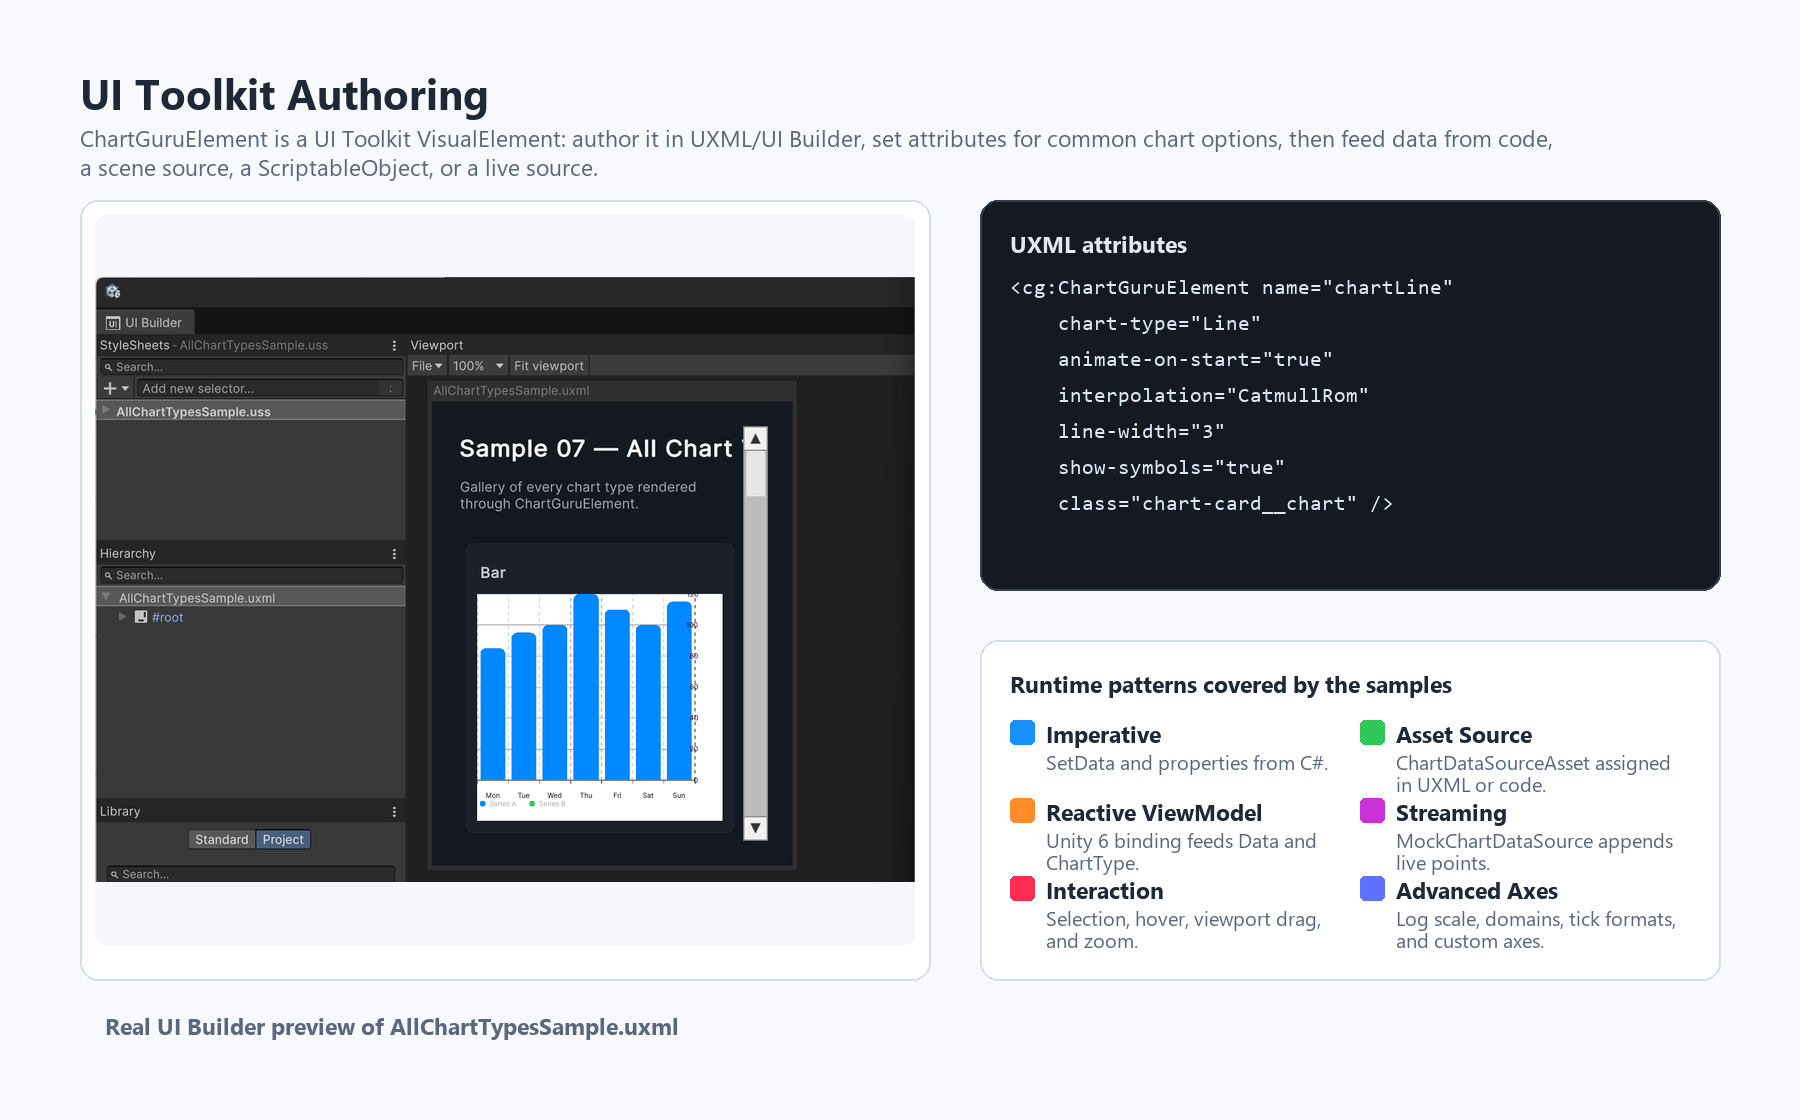
UI Builder preview of a ChartGuruElement UXML sample plus the UXML/runtime patterns used by the UI Toolkit examples.
- Use Assets > Create > ChartGuru > UXML Chart Template to create a ready-to-edit ChartGuruElement template.
- Use UXML attributes for stable visual configuration such as chart type, axis visibility, labels, interpolation, symbols, colors, interaction, legend state, viewport, zoom, animation, and visible domain lengths.
- Use USS for surrounding layout and UI composition. Chart rendering itself comes from ChartGuruElement and the shared chart Guru renderer.
- Study the UI Toolkit examples for imperative setup, asset-backed data, scene data source, runtime updates, SetValues streaming data, interaction, theming, advanced axes, and external data source binding.