Core Concepts
Marks
A mark is the smallest drawable unit in a chart. The chart type often follows the mark type, but Chart Guru can also compose compatible cartesian marks in one chart, such as bars plus rule marks or points plus a line.
Mark | Used for |
|---|---|
BarMark | Vertical or horizontal bars, ranges, grouped bars, stacked bars, and mini bars. |
LineMark | Trend lines and connected point series. |
AreaMark | Filled trends, stacked areas, range bands, and confidence bands. |
PointMark | Point plots, scatter plots, and bubble-like encodings when symbol size is mapped. |
SectorMark | Pie and donut slices. |
RectangleMark | Heatmap cells and rectangular ranges. |
RuleMark | Horizontal or vertical reference lines and threshold markers. |
RadarMark | Radar or spider chart spokes and filled shapes. |
CandleStickMark | Open, high, low, close financial candles. |
Builder
The builder is a fluent way to assemble a Chart model. You add marks, configure the chart, then call Build. The same Chart model can be rendered in Canvas, UI Toolkit, editor previews, or custom code.
Chart chart = Chart.Create()
    .Add(new LineMark(0f, 42f))
    .Add(new LineMark(1f, 48f))
    .ChartTitle("Trend")
    .ChartXAxis(x => x.Label("Time"))
    .ChartYAxis(y => y.Label("Value"))
    .Build();
Semantic Encoding
Semantic encoding means you describe what a mark represents instead of hard-coding every color. Chart Guru can then assign consistent colors, create legend entries, and group marks into series.
bar.ForegroundStyle(PlottableValue.Value("Product", "Electronics"));

// Use explicit color only when you need direct control.
bar.ForegroundStyle(Color.red);
Color, symbol shape and symbol size can describe different data fields. Use ForegroundStyle(PlottableValue.Value(...)) for color grouping, Symbol(PlottableValue.Value(...)) for shape grouping and SymbolSize(PlottableValue.Value(...)) for size grouping. PointMark, LineMark and typed point/line plot selectors also support explicit per-point symbols and sizes. An explicit 2D symbol size of zero hides that symbol and removes its symbol hit target. It does not remove the underlying data row.
Series, Stacking, and Legends
Marks with the same SeriesKey belong together. ForegroundStyleKey controls color assignment. For multi-series charts, use semantic foreground style values or set SeriesKey and ForegroundStyleKey yourself. Stacking is controlled with MarkStackingMethod: Unstacked, Standard, Normalized, or Center.
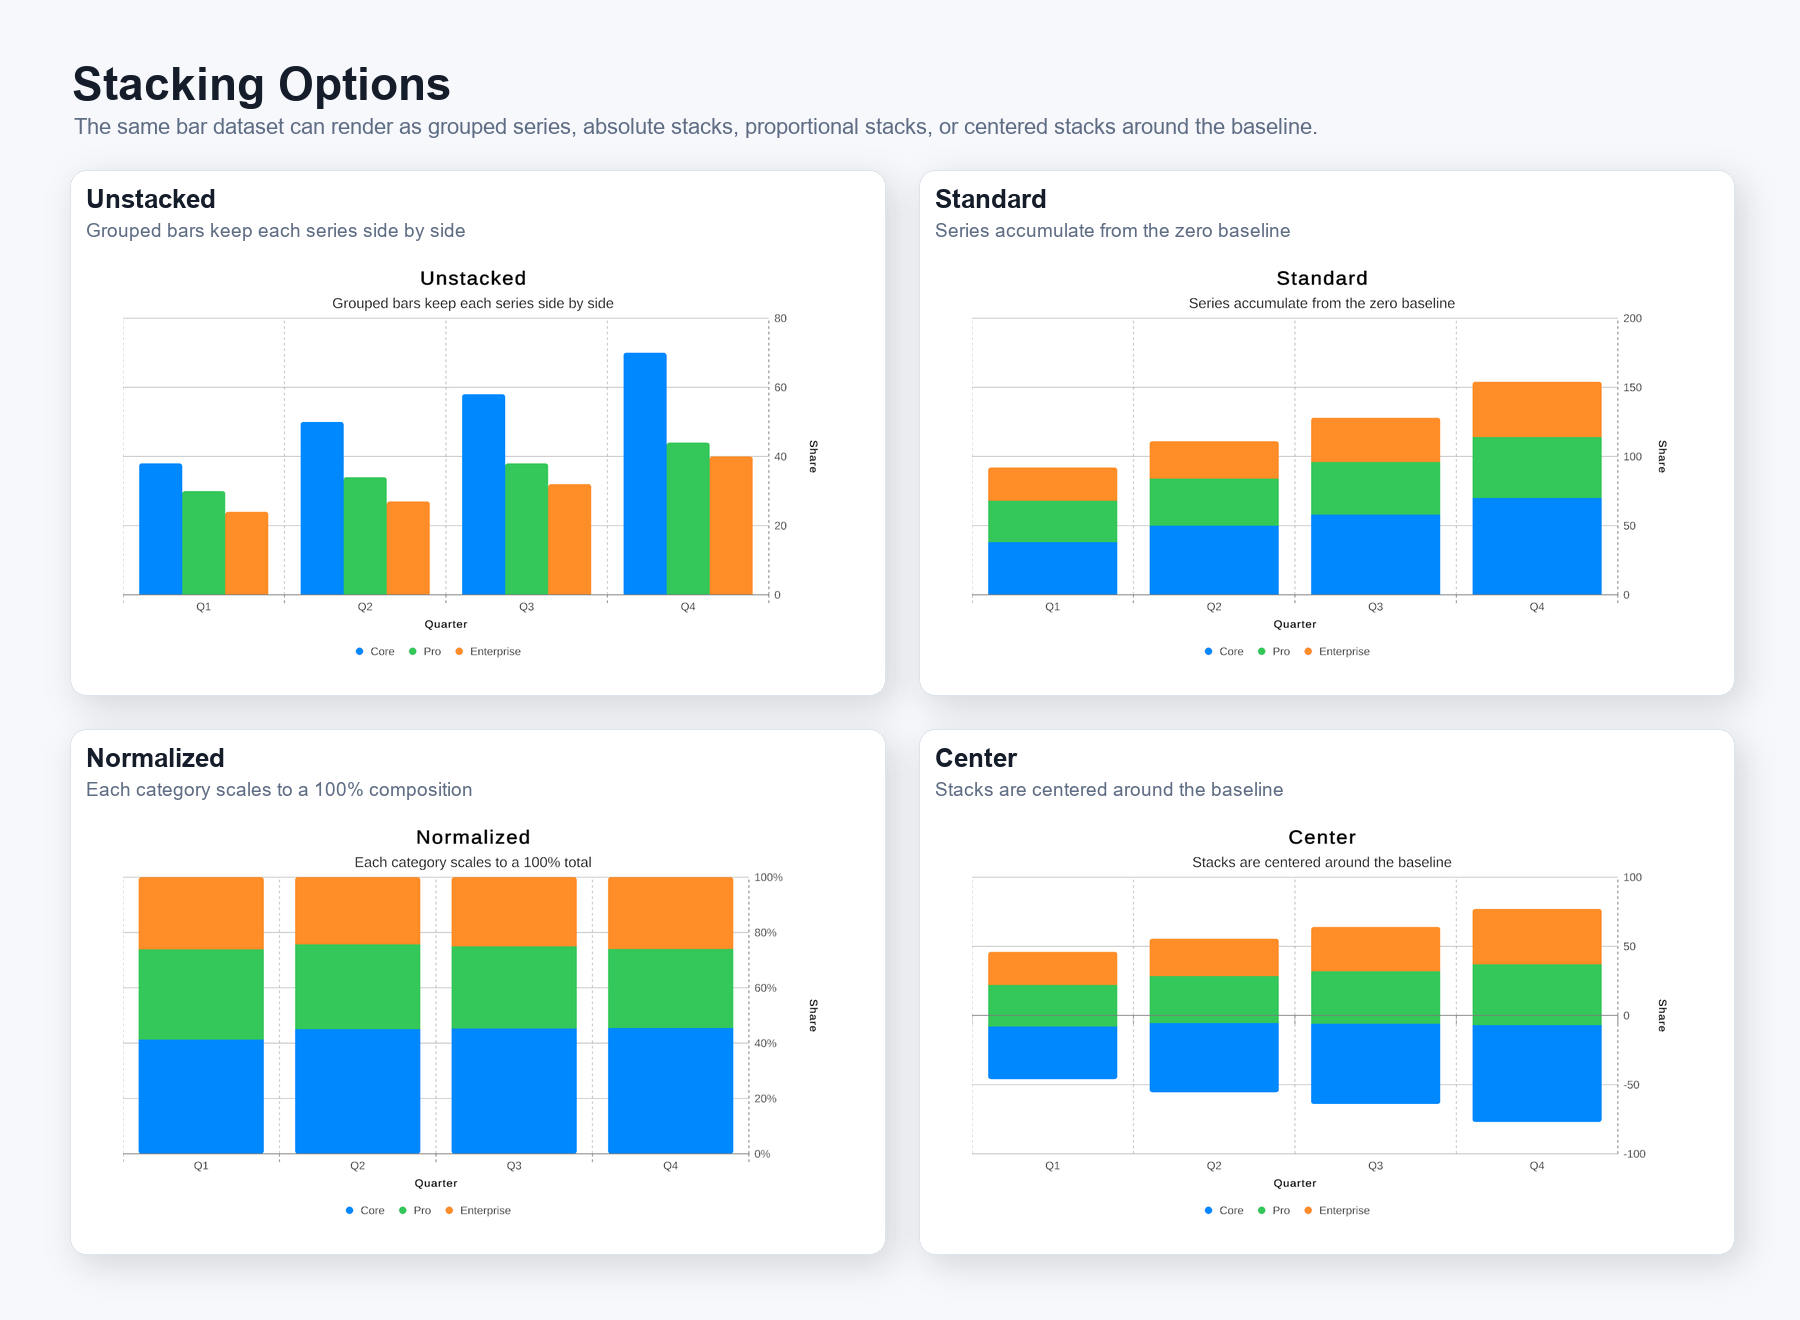
Figure 2. Stacking options: unstacked, standard, normalized, and center modes let the same bar dataset show grouped series, absolute totals, 100% composition, or centered totals around the baseline.