Programmatic Examples and Concepts
The Programmatic examples are the fastest way to understand Chart Guru as a chart language rather than a collection of chart prefabs. Read them as a sequence: define marks, bind data, add semantic encodings, tune axes and labels, then layer runtime behavior such as selection, scrolling, streaming, and morphing.
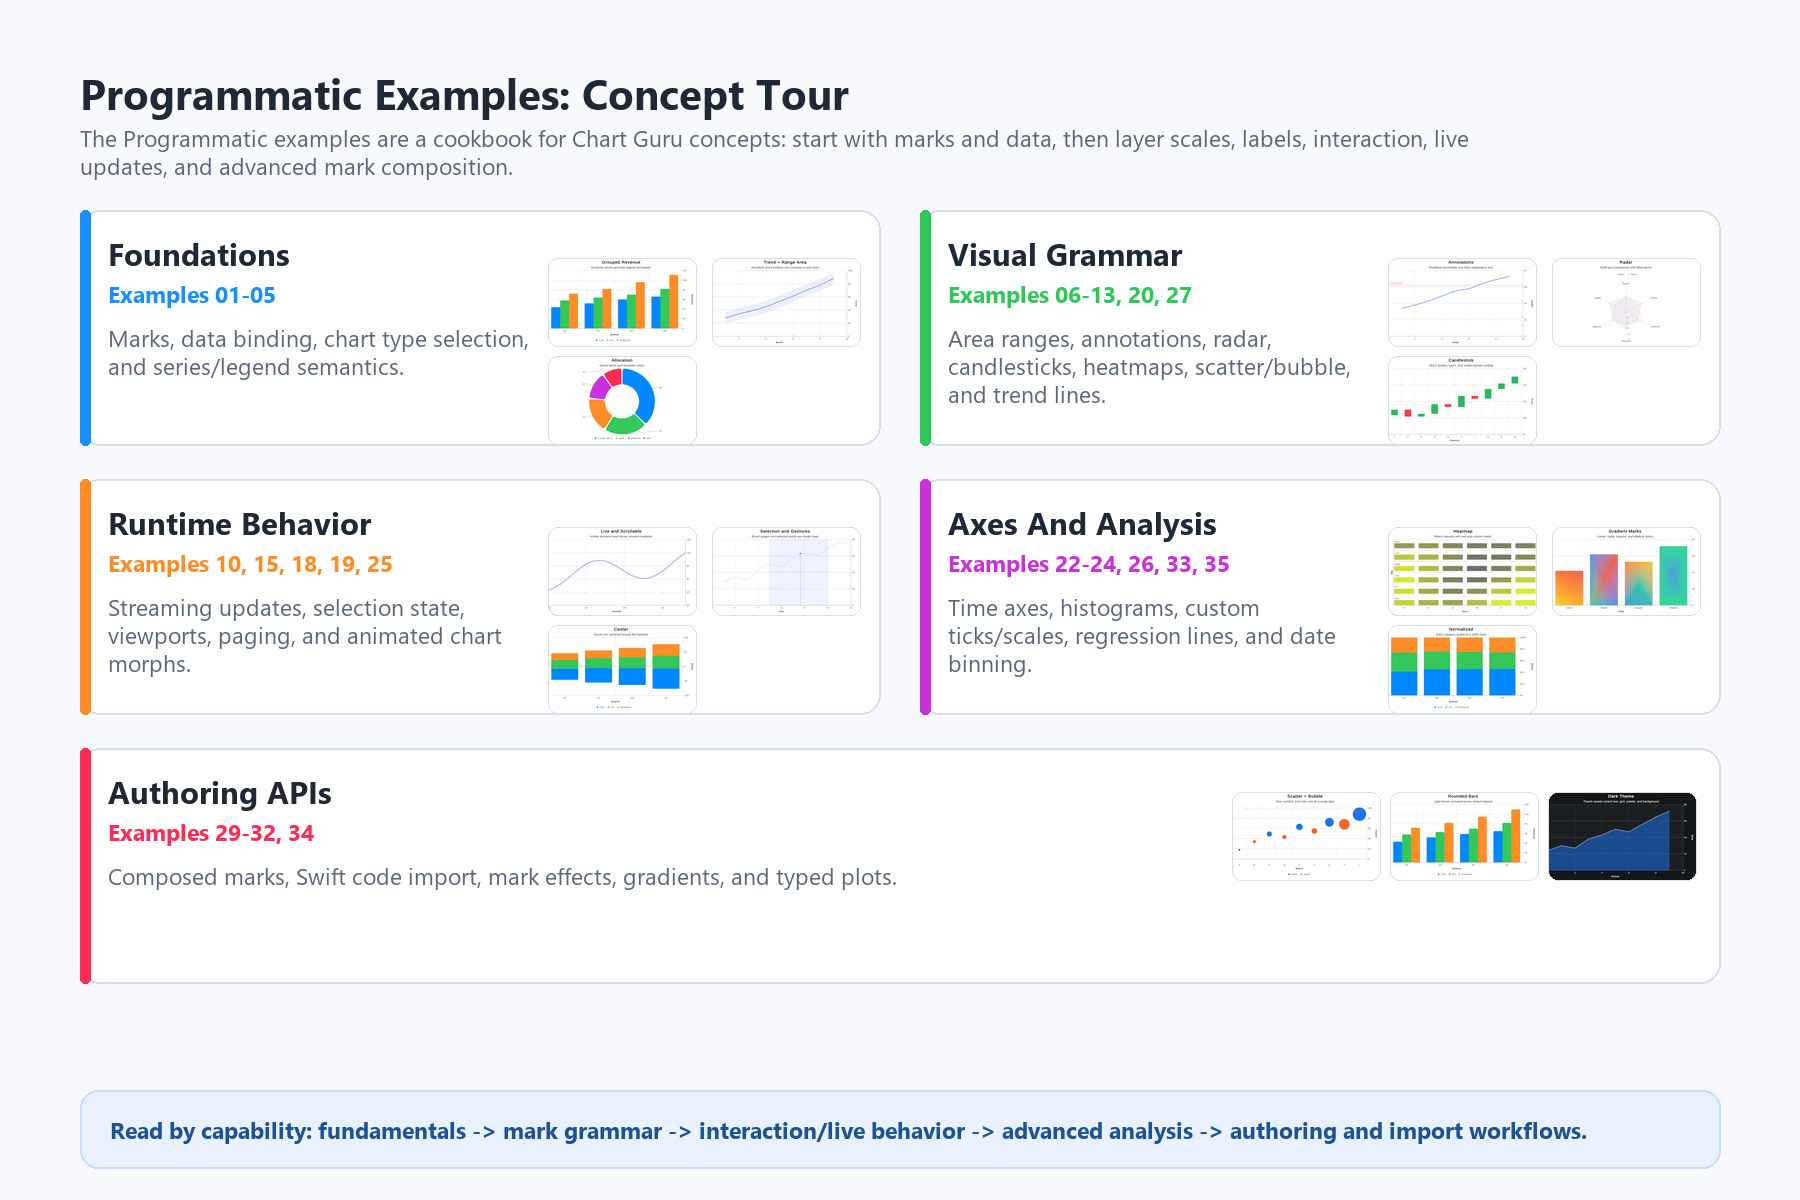
Programmatic examples grouped by concept instead of by chart type.
How to read the Programmatic scenes
- Start with simple bar, 2D data binding, line chart, pie/donut, and multi-series scenes to learn marks, labels, series, and legend models.
- Use area, range, annotations, rule marks, axis customization, heatmap, scatter/bubble, and radar scenes to see how marks encode position, region, size, color, and context.
- Use live, streaming, viewport, animation, transition, paging, and morphing scenes to understand how charts update while preserving interaction state.
- Use Swift code, typed plots, gradients, mark effects, and composed marks when moving from simple samples into reusable chart grammar and migration workflows.
The examples deliberately overlap concepts. A chart type is only the starting point; the important part is how the example combines marks, data sources, axes, styling, interaction state, and rendering targets.