Data Sources
Data sources are components that build marks and apply them to a target chart. Attach a source to the same GameObject as ChartGraphic, or to a parent whose child charts have no local source. Targets are resolved automatically; the Inspector does not require a Target Chart assignment. Code can still assign an explicit target. Sources work in Edit Mode and Play Mode where appropriate and expose actions for quick iteration.
Source | Use it for |
|---|---|
MockChartDataSource | Instant generated data for prototypes and demos. Patterns include Random, Linear, Exponential, Logarithmic, Sine, Cosine, TrendingUp, TrendingDown, Seasonal, Stepped, Sparse, RandomWalk, BellCurve, Sawtooth, and GaussianNoise. |
ManualChartDataSource | Hand-entered labels, values, series, colors, and reference rules directly in the Inspector. |
CsvChartDataSource | CSV, TSV, semicolon-separated files, TextAssets, StreamingAssets, inline text, or absolute paths. |
JsonChartDataSource | JSON files or inline JSON, including nested data via root selectors. |
GoogleSheetsChartDataSource | A shared Google Sheets URL converted to chart-ready tabular data. |
WebChartDataSource | HTTP CSV or JSON endpoints with headers, polling, retry, and backoff. |
YahooFinanceChartDataSource | Stock and financial time-series data for line or candlestick charts. |
RingBufferChartDataSource | High-throughput live samples, appended efficiently and flushed once per frame. |
Mock Data Source
MockChartDataSource is the recommended starting point. Use the Generation toolbar to Generate one replacement data set, Start Streaming, or Stop Streaming; its status shows Idle, Streaming, or Inactive. Data Generation groups Pattern, Series Count, Points Per Series, Minimum Value, Maximum Value, Noise, and Labels. Random, Trending, Seasonal, and Bell Curve buttons apply a preset and generate immediately.
Label Overflow controls finite label sets: Auto Unique continues with unique labels, Cycle repeats them, and Clamp limits the point count. Start Year appears for calendar presets with Auto Unique. Series Styling contains multi-series names and gradients. Streaming contains automatic start, rhythm, intervals, and emission controls. Data Retention contains Incoming Data and Maximum Points.
For candlestick charts, generated candles use the previous close as the next open and keep their high and low within the configured value range. Month, quarter, and year label presets use calendar positions when the X axis is Auto or Time; streaming and retention keep those dates stable.
MockChartDataSource mock = gameObject.AddComponent<MockChartDataSource>();
mock.Pattern = SeriesPattern.TrendingUp;
mock.SeriesCount = 3;
mock.PointsPerSeries = 12;
mock.LabelPreset = LabelPreset.MonthsShort;
mock.GenerateOnce();
mock.StartStreaming();
File and Web Mapping
CSV, JSON, Sheets, Web, and Yahoo sources parse data into rows and columns, then use ChartDataMapping to decide which columns become X values, Y values, labels, series, and OHLC candles.
- XColumn becomes the X axis. If empty, row index is used.
- LabelColumn becomes the category or data label when present.
- YColumns are the plotted numeric values. WideFormat treats each Y column as its own series.
- SeriesByColumn pivots long-format data into multiple series.
- OpenColumn, HighColumn, LowColumn, and CloseColumn create candlestick marks.
- MaxRows limits how many parsed rows are consumed.
Data Source Mental Model
A data source is not just a loader. It answers four questions: where values come from, how raw text or generated samples become rows and columns, how those columns map to chart semantics, and when the chart should refresh. Once that model is clear, CSV, JSON, Sheets, Web, Yahoo, Manual, Mock, and RingBuffer sources all become variations of the same pipeline.
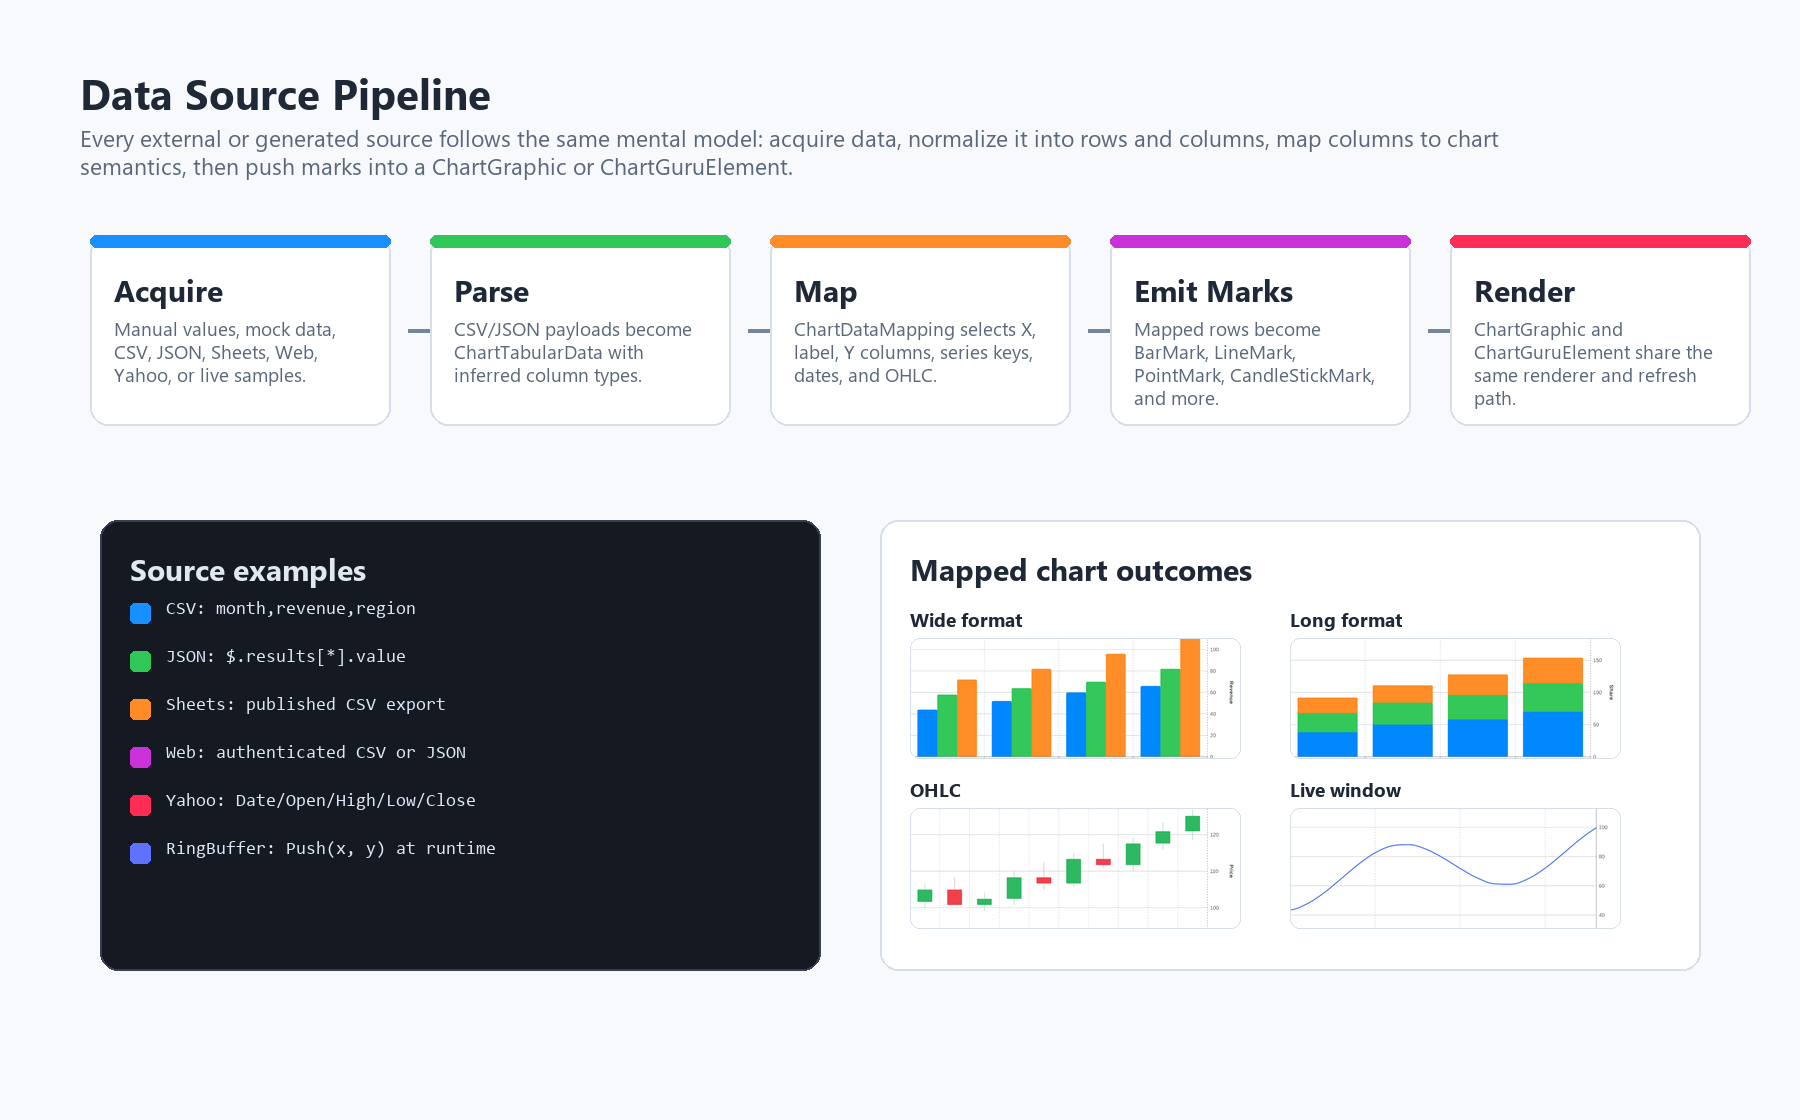
Data source overview. Sources acquire or generate values, normalize them into tabular data, map columns to chart semantics, and emit marks for the shared renderer.
Choosing a Data Source
Choose the source by ownership and refresh behavior. Use Manual when the scene owns the data, Mock when the real backend is not ready, CSV/JSON for files and exports, Sheets for externally edited tabular data, Web for service-backed dashboards, Yahoo Finance for quick OHLC examples, and RingBuffer for high-frequency live samples.
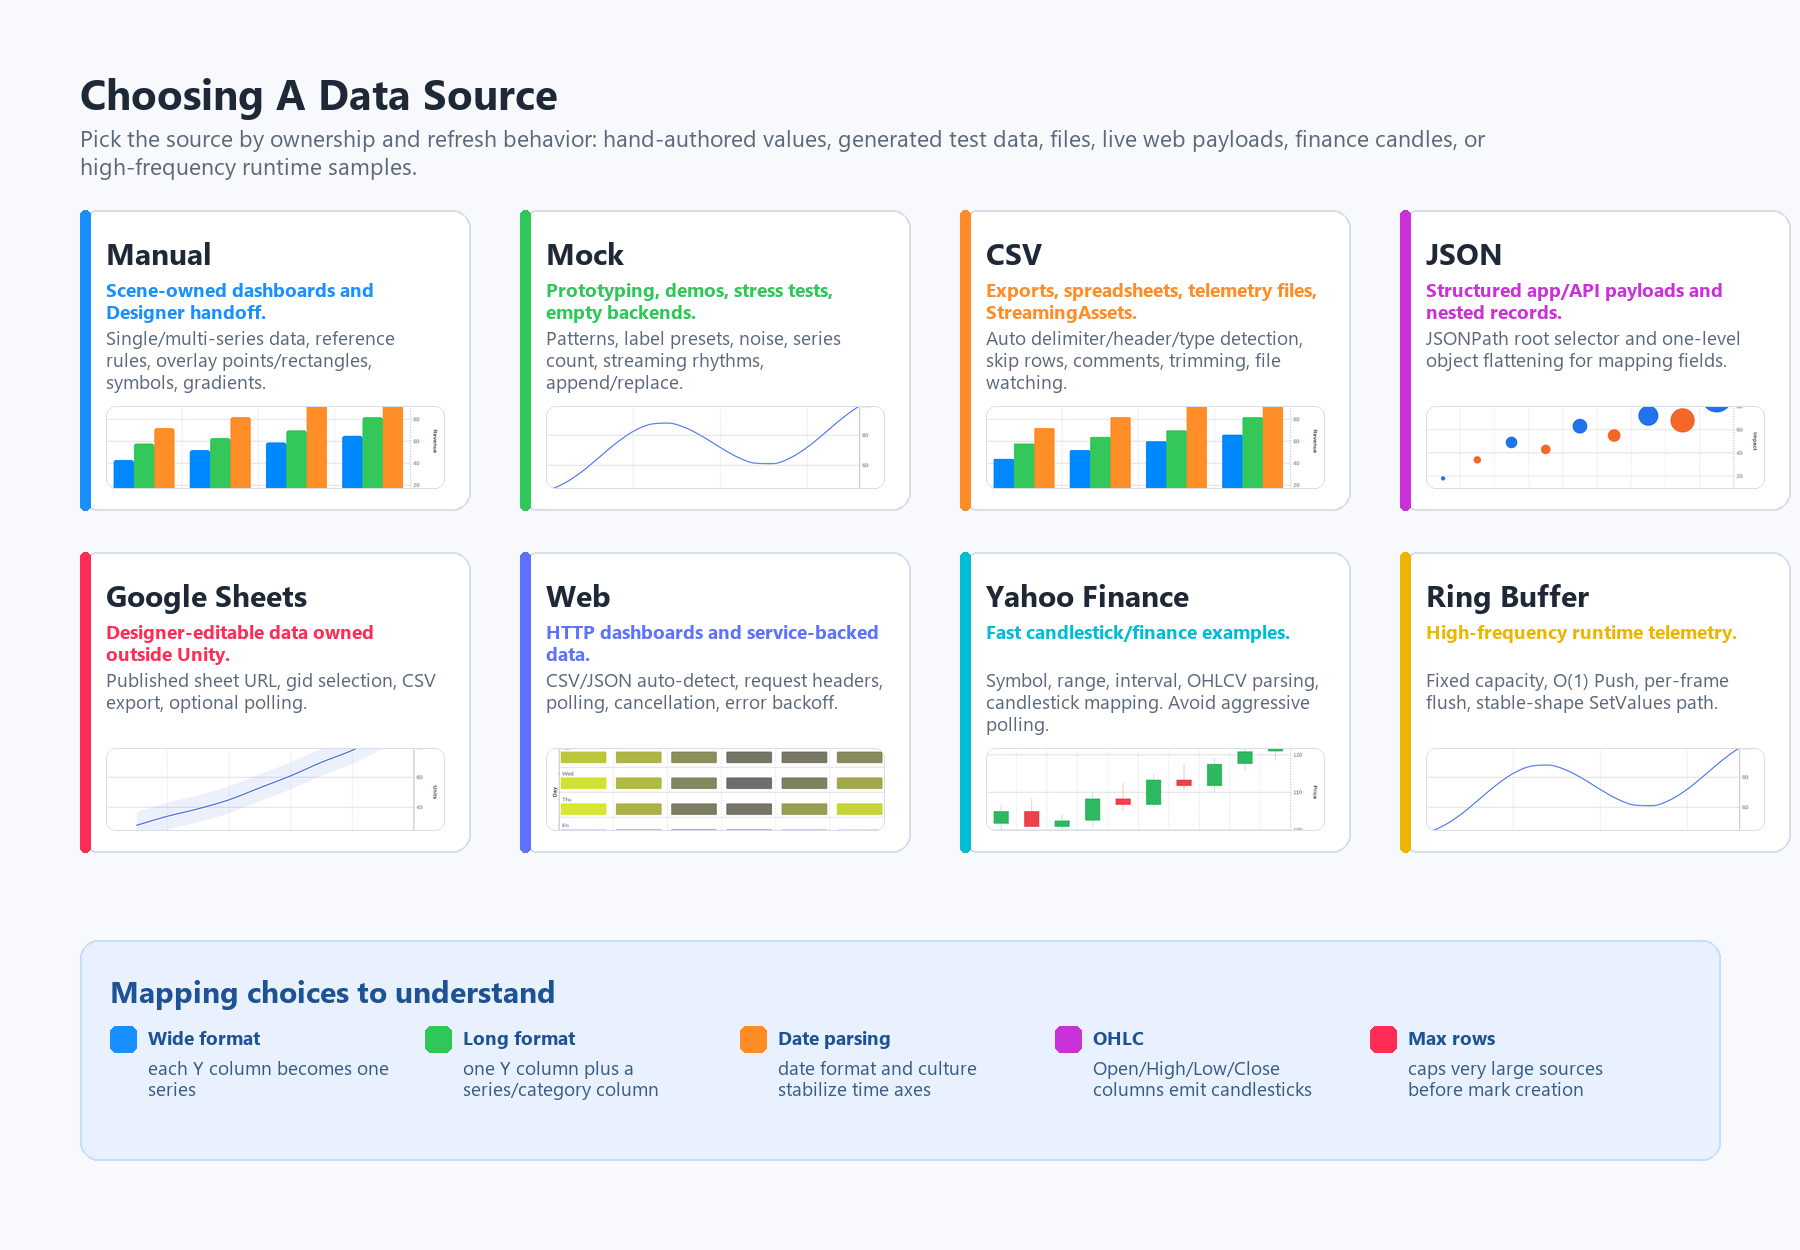
Data source chooser. Each source targets a different ownership and refresh pattern while sharing the same mapping and rendering model.
Individual Data Sources
ManualChartDataSource is best for scene-owned data and Designer handoff. It supports single-series and multi-series values, reference rules, overlay points, overlay rectangles, symbols, colors, gradients, and reusable styling fields.
MockChartDataSource is the recommended starting point for design, demos, and stress tests. It generates patterns with configurable labels, series counts, noise, value ranges, gradients, and streaming rhythms, so a chart can be designed before a production backend exists.
CsvChartDataSource reads separated-value text from a TextAsset, project path, absolute path, StreamingAssets path, or inline string. It can auto-detect the delimiter, header row, and column types, but the inspector can lock those choices down with delimiter, header mode, comment prefix, skip rows, trimming, and file watching options.
JsonChartDataSource is for structured payloads. Use Root Selector when the useful records live inside a larger API response. Nested objects flatten one level with dot notation, which keeps fields such as ohlc.open or metrics.revenue available for normal mapping.
GoogleSheetsChartDataSource converts a published Google Sheets URL into a CSV export URL. Use it when designers or analysts own a sheet outside Unity. The sheet must be published or otherwise reachable by the player/editor, and the gid selects which worksheet tab is read.
WebChartDataSource polls an HTTP or HTTPS endpoint and parses CSV or JSON responses through the same mapping system. It supports request headers, JSON root selection, CSV options, polling intervals, cancellation, edit-mode preview, and exponential backoff on transient failures.
YahooFinanceChartDataSource is a convenience wrapper for the public Yahoo Finance chart endpoint. It fills symbol, range, interval, OHLCV parsing, and candlestick mapping automatically, making it useful for examples and prototypes. For production market dashboards, prefer a paid market-data provider through WebChartDataSource and avoid aggressive polling.
RingBufferChartDataSource is the live-data path for high-frequency runtime samples. Producers push Y or X/Y values into a fixed-capacity buffer; the chart receives a per-frame flush and can use the stable-shape SetValues path instead of rebuilding marks every sample.
Mapping Concepts
- Wide format means each Y column becomes its own series. This matches spreadsheet exports such as Month, Core, Pro, Enterprise.
- Long format means one Y column is split by a category or series column. This matches rows such as Quarter, Region, Revenue.
- XColumn controls the axis position. If it is empty, the row index becomes the X value. LabelColumn controls category/data labels when present.
- DateFormat and DateCulture stabilize time parsing when the source uses a non-invariant date format or a locale-specific month/day order.
- OpenColumn, HighColumn, LowColumn, and CloseColumn switch the emitted marks to candlesticks when all four are configured.
- MaxRows is a safety valve for very large sources. It caps rows before marks are produced, which is useful for previews and heavy files.
Typed Tables and Live Bindings
Use a ChartDataFrame when the data is already a table or when several charts need different views of the same rows. A frame contains named numeric, category, temporal or Boolean columns. Frames are immutable: create a new frame when the values change. A column can also carry a validity mask so a missing value remains distinct from zero.
ChartDataEncoding maps column names to marks. Its factories cover bars, lines, points, areas, sectors, rectangles and reference rules, including ranged bars and areas. For a one-time chart, pass the frame and encoding to ChartBuilder.AddDataFrame; the named AddBarPlot, AddLinePlot, AddPointPlot and other plot helpers provide the same mapping in a shorter form.
For changing data, retain the binding returned by Chart.Bind and call Update with the next frame. The binding updates compatible marks in place and rebuilds the projection when required. Keep the encoding stable during ordinary refreshes. Dispose the chart when its host no longer uses it.
Bind the chart displayed by the host. ChartGraphic.SetChartData adopts the supplied Chart, while ChartGuruElement.SetChartData transfers supported state into the element's own Chart. For a live UI Toolkit binding, configure the element first and bind element.Chart. Use ChartGuruElement.SetData for a simple single-series list of values; it replaces that series rather than updating an existing multi-series collection.
using ChartGuru;

public static class TypedTableExample
{
    public static Chart Create(out ChartDataFrameBinding binding)
    {
        Chart chart = Chart.Create()
            .ChartXAxis(axis => axis.Label("Quarter"))
            .ChartYAxis(axis => axis.Label("Revenue"))
            .Build();

        binding = chart.Bind(
            Frame(65f, 89f, 78f),
            ChartDataEncoding.Bar("Quarter", "Revenue"));
        return chart;
    }

    public static void Refresh(ChartDataFrameBinding binding)
    {
        binding.Update(Frame(70f, 95f, 82f));
    }

    private static ChartDataFrame Frame(float q1, float q2, float q3)
    {
        return new ChartDataFrame(
            ChartDataColumns.Category("Quarter", "Q1", "Q2", "Q3"),
            ChartDataColumns.Numeric("Revenue", q1, q2, q3));
    }
}
Prepare a view of the data before encoding it: Filter keeps matching rows and SortBy orders them. ChartDataTransforms.Calculate adds a derived column, AggregateBy summarizes groups, Rolling adds a moving-window statistic, and FacetBy splits the frame into grouped views. These operations return new frames or facets and preserve the source frame. Choose the resulting columns explicitly when creating the encoding.
Refreshing File and Web Data
File and web sources expose RefreshAsync(CancellationToken) when the application needs to await completion. Bind a loading indicator or status label to RefreshStateChanged; IsRefreshing includes loading, parsing and applying. LastRefreshError contains the most recent sanitized error, and LastRefreshUtc records the last successful completion. State notifications and chart application run on the Unity thread.
A newer refresh supersedes an older request, so a late response cannot replace newer data. Disabling or destroying the source cancels its active work. Treat cancellation separately from an unsuccessful refresh, and unsubscribe application callbacks when their UI is released. A web source can poll through PollIntervalSeconds, with zero meaning a one-shot request; transient failures use backoff. RunInEditMode is opt-in when intentional network traffic in the Editor is needed.
For authentication, supply header values at runtime with SetRuntimeHeader, or choose EnvironmentVariable as the header's value source. Runtime header values are not serialized. Keep credentials out of the serialized literal Value field and out of source-controlled examples.
using System;
using System.Threading;
using System.Threading.Tasks;
using ChartGuru;

public static class WebRefreshExample
{
    public static async Task RefreshAsync(
        WebChartDataSource source,
        string authorizationHeader,
        Action<ChartDataRefreshState> showState,
        CancellationToken cancellationToken)
    {
        source.SetRuntimeHeader("Authorization", authorizationHeader);
        source.RefreshStateChanged += showState;
        try
        {
            await source.RefreshAsync(cancellationToken);
        }
        finally
        {
            source.RefreshStateChanged -= showState;
        }
    }
}
Configure the source URL, mapping and target chart first. Call this method from the application's Unity lifecycle with a cancellation token and a status callback. The caller handles OperationCanceledException for canceled or superseded work and other exceptions for unsuccessful refreshes.