Interaction, Animation, and Live Updates
Selection and Gestures
ChartGraphic implements pointer, hover, drag, and scroll interfaces. The Chart model exposes selected point, selected X or Y value, selected angle, selected ranges, hovered index, and selection indicator styles such as Highlight, Lollipop, and RuleMark.
- Use point selection for dashboards and drilldown.
- Use range selection for time windows and brushing.
- Use angle selection for pie and donut slices.
- Use scrollable axes and visible domains when only part of a large data set should be visible.
Linked Selection and Brushing
Use ChartSelectionLink to coordinate point and range selections across charts. The default point match is SeriesAndX; choose StableIdentity, XValue, Category or Index when that better describes how the charts correspond. Stable identity uses a mark's accessibility identifier when available. Prefer semantic matching when charts can reorder or filter their data.
Choose the propagated state through ChartSelectionPropagation: point selection, X/Y/Z ranges, or All. Retain the link for as long as the charts are linked and call Dispose when that relationship ends. The link prevents feedback loops. Chart.ClearSelection() clears point, range, angle and 3D selection state.
For a built-in drag brush, choose the Canvas chart's Brush Axes setting in the Inspector or set ChartGuruElement.BrushAxes to ChartBrushAxes.X, Y or XY. The default None retains ordinary nearest-X point dragging. Range selection callbacks and highlights use the same chart model as a custom gesture brush.
Data Tooltips and Application Popovers
Data tooltips show values next to the active mark in Canvas and UI Toolkit charts. Start with ChartTooltipPreset.Automatic: it compares visible line or area series that share the active X value, otherwise it shows detailed mark content. Compact, Comparison and Detailed select an explicit layout. Hidden disables tooltip tracking and presentation.
Use Hover for pointer inspection, HoverAndPin for hover with tap/click pinning, or Selection for content that follows the selected mark. ChartTooltipStyle controls the presentation, and ChartTooltipIndicator controls its mark indicator. The chart selects the correct built-in presenter for its host.
using ChartGuru;

public static class TooltipExample
{
    public static Chart Create()
    {
        string[] products = { "Coffee", "Tea", "Cocoa" };
        float[] revenue = { 120f, 90f, 75f };
        ChartBuilder builder = Chart.Create()
            .ChartTooltip((content, context) =>
            {
                int index = context.Hit.MarkIndex;
                if (index < 0 || index >= revenue.Length) return;
                content.Title(products[index])
                    .Row("Revenue", revenue[index].ToString("0"), context.Hit.Color)
                    .Footer("Click or tap to pin");
            })
            .ChartTooltipInteraction(ChartTooltipInteraction.HoverAndPin)
            .ChartTooltipStyle(ChartTooltipStyle.Premium);

        for (int index = 0; index < products.Length; index++)
        {
            builder.Add(new BarMark(index, revenue[index])
            {
                CategoryLabel = products[index],
                SeriesKey = "Revenue"
            });
        }
        return builder.Build();
    }
}
Keep a custom content callback synchronous and inexpensive. The content builder is reused, so do not retain it as an immutable snapshot. Bind ChartTooltipState through ChartTooltipChanged or the host's TooltipChanged event when an application-owned detail panel needs the current content or pin state. Put interactive controls in that application panel; the built-in tooltip is a read-only content overlay.
For UXML authoring, use tooltip-preset, tooltip-interaction and show-tooltip-indicator. Open the UI Toolkit 11_Tooltips sample for automatic comparison, custom content and state-binding examples. Ordinary Unity [Tooltip] and VisualElement.tooltip remain help text for authoring controls, rather than live chart values.
Animation and Morphing
Animations can run on initial display, value changes, explicit replays, and morph transitions. Use Animation.Default, Linear, EaseIn, EaseOut, EaseInOut, Spring, SpringResponse, Bouncy, Smooth, Snappy, InterpolatingSpring, TimingCurve, or FromEasing, then add Delay, Speed, RepeatCount, or RepeatForever modifiers as needed. Morphing transitions between chart types at runtime and can use CrossFade, Scale, or Semantic styles. Semantic morphing is supported for Bar, MiniBar, Line, Sparkline, Area, Point, Bubble, Scatter, Pie, Donut, Radar, MiniPie, MiniDonut, HeatMap, Candlestick, and Indicator. If either side of a requested semantic morph is outside that set, Chart Guru automatically resolves the transition to Scale so the morph remains visible.
chart.MorphTo(ChartType.Line, new MorphOptions
{
    Animation = Animation.EaseInOut(0.6f),
    Style = ChartMorphStyle.Semantic
});
chart.SetValues(newValues);      // fastest Y-only update when shape is unchanged
chart.SetData(newMarks);         // full replace when mark shape changes
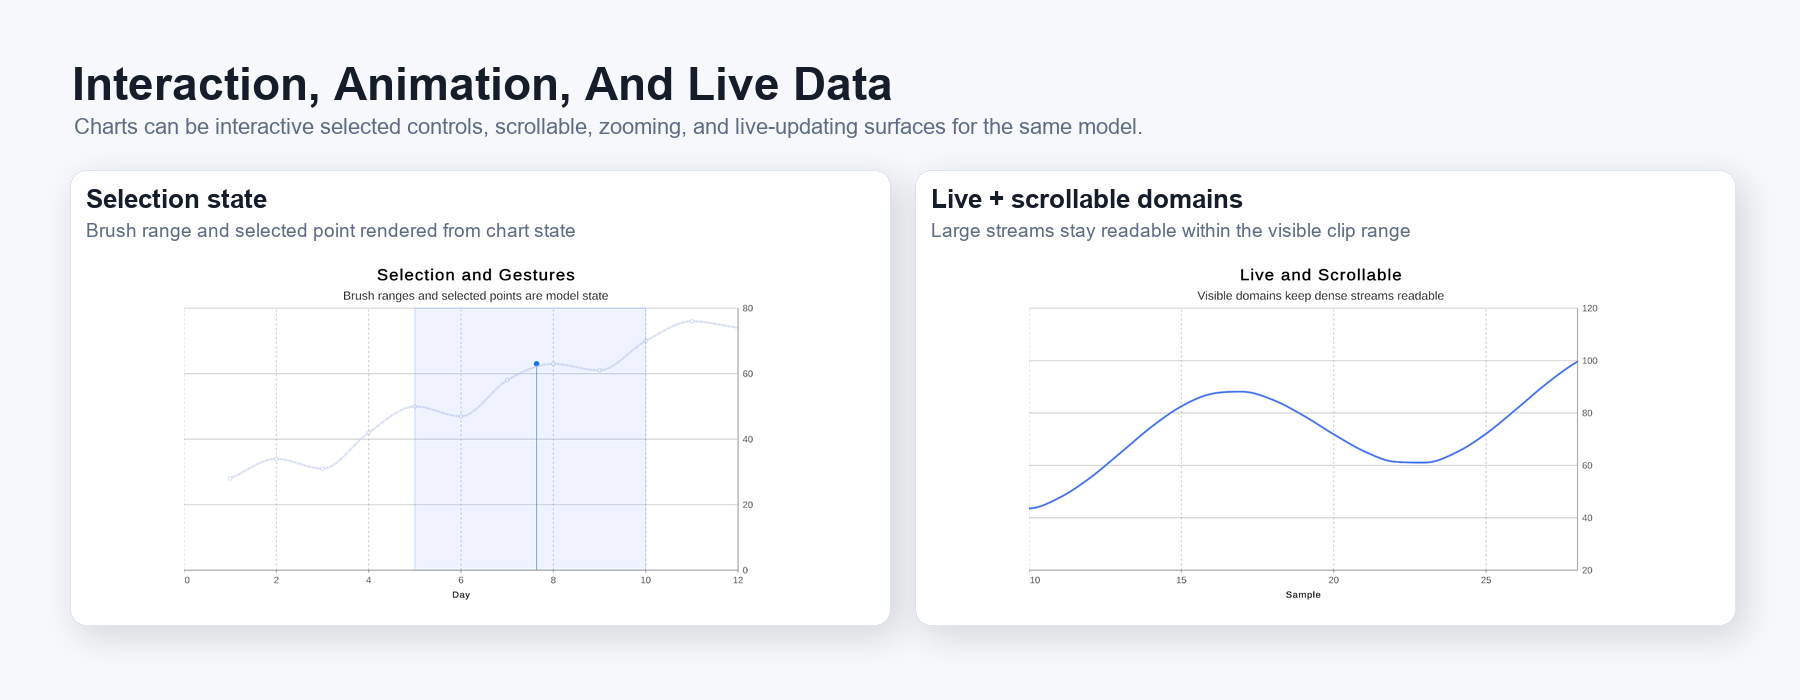
Figure 5. Interaction and live data: selection ranges, selected points, visible domains, scrolling, zooming, and streaming updates share the same chart model.
Accessible Charts and Audio Graphs
Give the chart a meaningful ChartAccessibilityLabel and, when useful, a ChartAccessibilityRepresentation that explains its message. Per-mark accessibility labels, values and identifiers improve navigation and stable selection matching. GetAccessibilitySummary() returns a textual summary; GetAccessibilityDescriptor() exposes visible marks and series as a platform-neutral description that an application can present through its own accessible UI.
On Unity 6, ChartAccessibilityHierarchyBridge can add those descriptions to Unity's native accessibility hierarchy. Supply chart and mark frame callbacks in screen coordinates. Integrate with the application's hierarchy when one already exists; a new bridge does not activate itself, and Activate() will not replace another active hierarchy by default. Retain the bridge, update frames as the chart moves and dispose it when the host is released.
using System;
using ChartGuru;
using UnityEngine;

public static class AccessibilityExample
{
#if UNITY_6000_0_OR_NEWER
    public static ChartAccessibilityHierarchyBridge Activate(
        Chart chart,
        Func<Rect> chartScreenFrame,
        Func<int, Rect> markScreenFrame)
    {
        var bridge = new ChartAccessibilityHierarchyBridge(
            chart,
            chartFrameGetter: chartScreenFrame,
            markFrameGetter: markScreenFrame);
        if (bridge.Activate()) return bridge;
        bridge.Dispose();
        return null;
    }
#endif
}
For an audio graph, retain a ChartAudioGraph, assign its caller-owned AudioSource, set SonificationOptions as needed and call Play(chart). Sonify(chart) returns notes and CreateAudioClip(chart) creates PCM audio when the application needs a separate playback workflow. Stop ends playback. The graph owns its generated clip; use ReleaseGeneratedClip or Dispose to release it. Audio is a supplement to readable text, units and accessible navigation.