Streaming Data
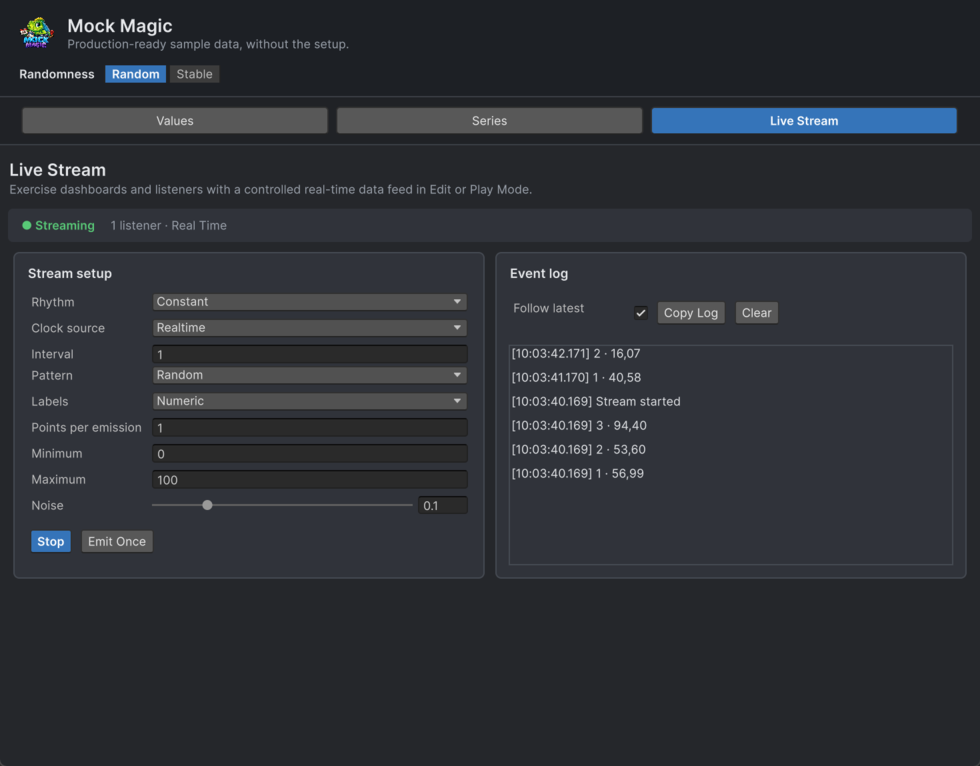
The Live Stream workspace provides continuous real-time mock data emission with clear configuration, status, validation, and an event log. It is suited to live dashboards, monitoring views, and any system that consumes a data feed.
Streaming removes the backend from the critical path when developing live behavior. You can validate updates, transitions, listener logic, monitoring views, and dashboard responsiveness in Edit Mode or Play Mode before a real feed is available.
Streaming works in both Edit Mode and Play Mode. You don't need to enter Play Mode to test a live data feed.
Using the Live Stream Workspace
- Status - Shows Streaming while running or Ready while idle, together with the current listener count and clock source.
- Rhythm - Select how data is emitted over time (see Rhythm Reference below). The controls below update dynamically based on the selected rhythm.
- Pattern - The series pattern used for generated values (same 15 patterns as the Series tab).
- Labels - The label preset for emitted data points.
- Points per emission - Set how many data points to generate per emission (1–100).
- Min / Max Value - Value range for generated data.
- Noise - Randomness factor (0–0.5).
- Start / Stop - Toggle button to begin or end streaming.
- Emit Once - Fire a single emission manually without starting continuous streaming.
- Clear - Clear the event log.
- Stream Log - A scrollable list of timestamped entries showing each emitted data point. Newest entries appear at the top. Maximum 100 entries.
Rhythm Reference
Rhythm | Behavior |
|---|---|
Constant | Emits at a fixed interval. Predictable, metronome-like. |
Random | Emits at random intervals within a range. More organic feel. |
Burst | Emits a rapid burst of data, then pauses. Simulates batch updates. |
Drip | Emits single values one at a time. Slow, steady feed. |
Label Continuity
Labels continue sequentially across emissions. If the first emission produces "Jan, Feb, Mar" and the next emission produces 3 more points, they will be labeled "Apr, May, Jun" - not "Jan, Feb, Mar" again. This makes streaming data behave realistically over time.
Choosing a Clock
Clock source controls timing separately from Rhythm. Game Time follows the game time scale in Play Mode; Unscaled Game Time and Real Time ignore it. Real Time is useful for Edit Mode previews. Manual does not schedule emissions: use Emit Once when you want the next batch.
Inspecting the Event Log
Follow latest keeps the newest event visible. Turn it off to inspect earlier entries, use Copy Log to copy the retained history, and use Clear to empty it. The log keeps the newest 100 entries, including start and stop feedback and emitted data points.
Listener Model
External systems receive stream data by registering as listeners. Live Stream shows the current listener count and records Emit Once, Start, and Stop feedback in the event log. Scripts, charts, and monitoring systems can register through the API.